“Birds of a feather flock together” is a common phenomenon in real life, indicating that similar things are likely to have similar attributes. Using this idea, machine learning can classify data, assigning it to the same category, such as similar or “nearest” neighbors. Today, let’s learn about nearest neighbor classification.

1. Understanding Nearest Neighbor Classification
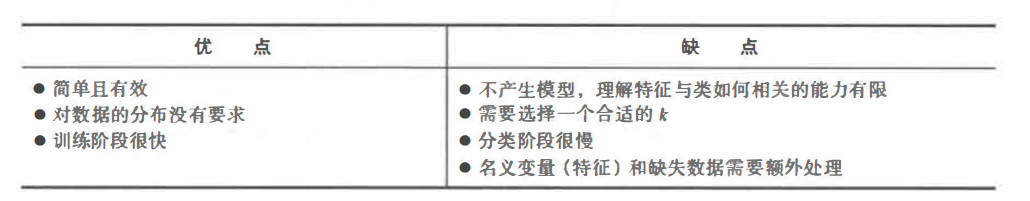
A nearest neighbor classifier categorizes unlabeled cases into the class of the labeled cases that are most similar to them. Generally, nearest neighbor classification is very suitable for classification tasks where the relationship between features and target classes is numerous, complex, or extremely difficult to understand, but similar class items are very close. In other words, if a concept is hard to define, but you know what it is when you see it, then nearest neighbor classification may be the appropriate method. On the other hand, if the data is noisy, and there are no clear boundaries between groups, then the nearest neighbor algorithm may struggle to determine class boundaries. So how can we implement nearest neighbor classification in R language?
2. kNN Algorithm
The kNN algorithm uses information about k nearest neighbors of a case to classify unlabeled examples. k is a variable option, indicating that any number of neighbors can be used. For each unlabeled record in the test dataset, kNN identifies the k records in the training set that are “closest” to that record in terms of similarity, assigning the unlabeled test example to the class that has the largest proportion among the k neighbors.
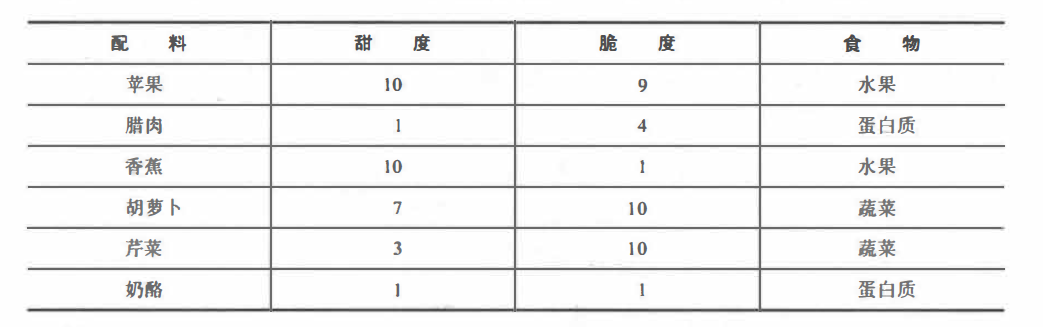
Suppose we create a taste dataset before having a mysterious meal. For simplicity, we estimate two features for each ingredient: crispness and sweetness, both rated from 1 to 10. We then label the ingredients into three types: fruit, vegetable, and protein. As shown below:
The kNN algorithm treats features as coordinates in a multi-dimensional feature space. Since there are only two features in this example, crispness and sweetness, the feature space is two-dimensional, and a scatter plot can be drawn as follows:
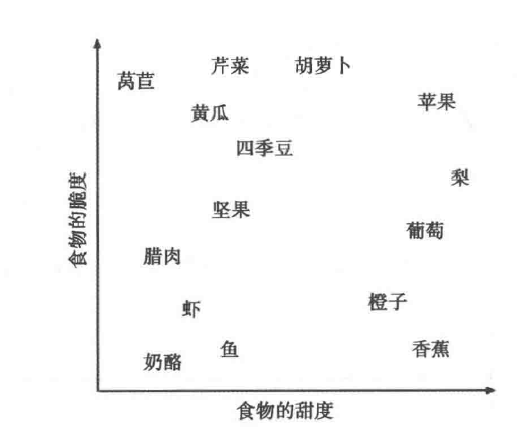
We can see that similar types of food tend to cluster closely together. As shown below, vegetables are often crisp and not sweet; fruits are often sweet, and they may or may not be crisp; proteins are usually neither crisp nor sweet. Now, using this dataset, we pose the question: is a tomato a fruit or a vegetable?
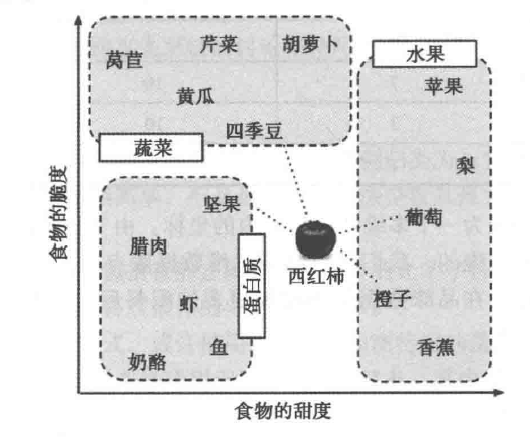
According to the idea of nearest neighbor classification, the key to determining whether a tomato is a fruit or a vegetable lies in the distance between the tomato and other ingredients, and the calculation of distance is also crucial to nearest neighbor classification.
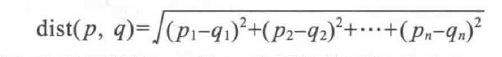
To measure similarity through distance, the kNN algorithm uses Euclidean distance, which measures the shortest distance by straight line.
Euclidean distance is defined by the following formula, where p and q are the cases to be compared, each having n features. The item p represents the value of the first feature of case p, while q represents the value of the first feature of case q:
Based on this formula, we can calculate the distances between the tomato and several of its neighbors, as shown in the following table:
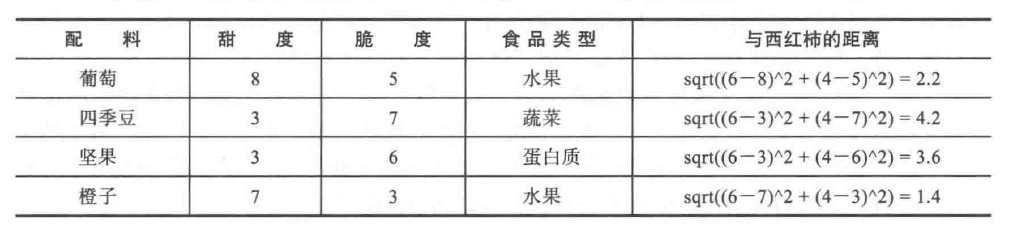
Here we find that the orange is closest to the tomato, and since the orange is a fruit, the tomato is also classified as a fruit. This classification based on a single neighbor is called 1NN classification, where the number of neighbors is 1, i.e., k=1. If we use k=3 in the kNN algorithm, it will vote among the three neighbors: orange, grape, and nut. Since the majority of these three neighbors are classified as fruits (2 out of 3 votes), the tomato is again classified as a fruit. At this point, we must ask, should k be 1 or 3?
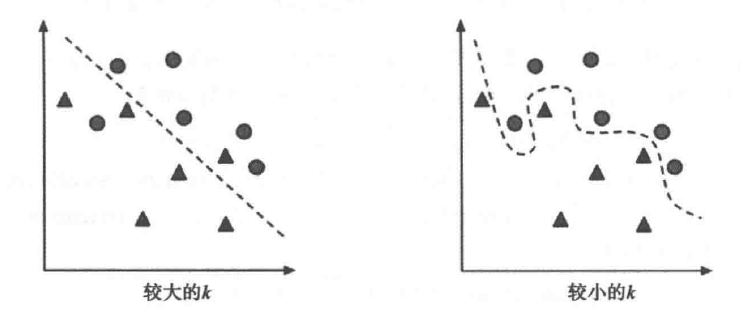
Determining the number of neighbors used for the kNN algorithm will decide how well the model generalizes to future data. The balance between overfitting and underfitting the training data is called the bias-variance tradeoff.
Suppose we take an extreme case where k is set to a very large number, equal to the total number of observations in the training data. Since every training case will appear in the final voting, the most common training class will always receive the majority of votes. Therefore, the model will always predict the majority training class, regardless of which neighbor is closest.
In the opposite extreme case, using a single neighbor makes the classification overly sensitive to noisy data or outliers. For instance, if some training cases are accidentally mislabelled, and some unlabeled cases are exactly closest to the incorrectly labeled training cases, then even if the other 9 neighbors have different votes, it will be predicted into the wrong class.
Clearly, the best k value should be somewhere between these two extremes.
Three Methods for Choosing k:
(1) The simplest method is the arithmetic square root of the number of cases; for 16 cases, k=4. This method does not yield good results.
(2) Test different k values in the dataset and choose the one that provides the best classification.
(3) Weighted voting: closer neighbors have more authoritative votes than farther ones. Many kNN implementations provide such an option.
3. Data Processing
Before applying the kNN algorithm, features are typically transformed to a standard range. The rationale for this step is that the distance formula heavily depends on how features are measured. Specifically, if one feature has a larger range of values than others, then the distance measurement will be strongly dominated by that feature with a larger range. For example, if crispness and sweetness both range from 1-10, but we introduce a third feature, spiciness, measured from 1-10000, then the distance calculation will largely depend on spiciness, neglecting sweetness and crispness.
The solution is to rescale the features by shrinking or expanding their ranges so that each feature contributes relatively equally to the distance formula. For instance, if sweetness and crispness both range from 1-10, we would also want the spiciness to range from 1-10. There are methods to achieve such scaling.
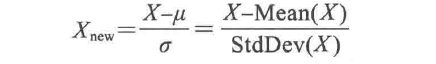
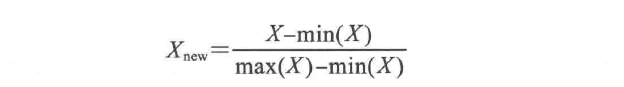
We can scale the data in two ways: one is min-max normalization, which transforms features so that all values fall within the range of 0-1, as shown in the formula:
The other is z-score normalization, where z-scores fall within an unbounded range of negative and positive values, differing from min-max normalized values, which have no predefined maximum and minimum.
4. Code Example
First, let’s understand the parameters of the kNN function:
rm(list = ls())library(class)library(datasets)library(MatchIt)data <- lalonde[,-4]# Using R's built-in dataset
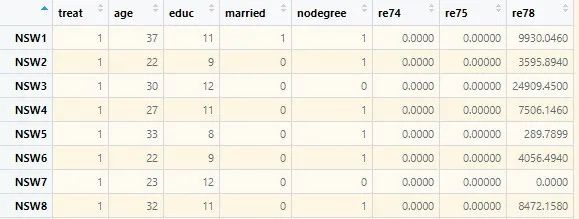
We split the data into training and testing sets in a 7:3 ratio, predicting the “treat” (0 or 1) feature in the test set using kNN. First, we find that features like age and education have different ranges, so we need to standardize the data:
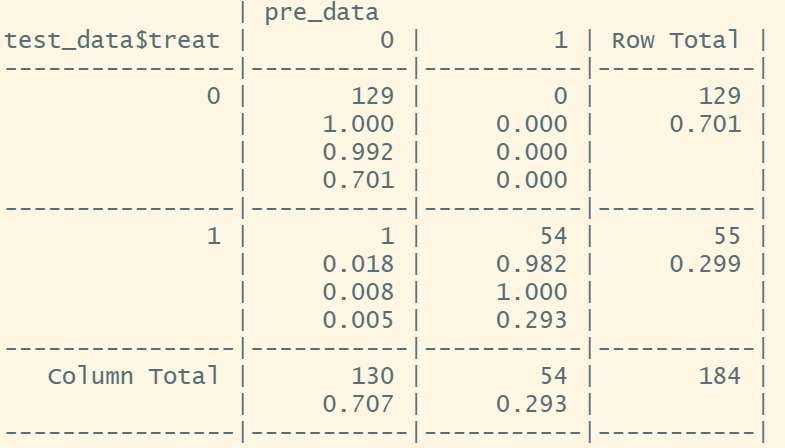
# Define min-max normalization functionnormalize <- function(x){return((x-min(x))/(max(x)-min(x)))}data <- as.data.frame(lapply(data,normalize))range(data)# Data is adjusted to be between 0-1[1] 0 1# Split data in a 7:3 ratioa <- sample(rownames(data)[data$treat=='0'],size = 300)b <- sample(rownames(data)[data$treat=='1'],size = 130)train <- c(a,b)train_data <- data[rownames(data)%in%train,]test_data <- data[!rownames(data)%in%train,]sqrt(430)# Set k based on arithmetic square rootk <- 21pre_data <- knn(train = train_data,test = test_data,cl = train_data$treat,k = 25)# Display results using CrossTablelibrary(gmodels)CrossTable(test_data$treat,pre_data,prop.chisq = F)
We find that only one sample is predicted incorrectly.
Next, let’s compare z-score normalization:
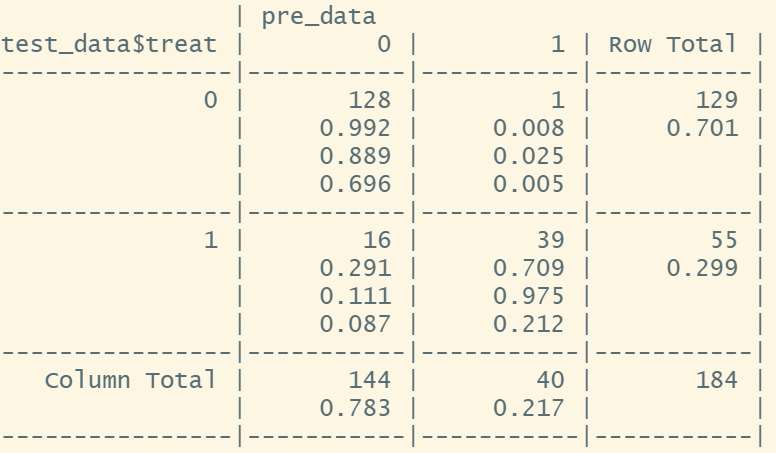
# Z-score normalizationdata <- lalonde[,-4]data[,-1] <- as.data.frame(scale(data[,-1]))# Z-score processing using scale range(data)[1] -3.906949 7.163301train_data <- data[rownames(data)%in%train,]test_data <- data[!rownames(data)%in%train,]pre_data <- knn(train = train_data,test = test_data,cl = train_data$treat,k = 21)library(gmodels)CrossTable(test_data$treat,pre_data,prop.chisq = F)
We find that 17 samples are predicted incorrectly, indicating that different data processing methods significantly impact the results.
Our sharing for today ends here, see you next time!
This article references: “Machine Learning and R Language”
Just so you know, we also share quality articles on Bilibili!

The wish of the Medical Monk is to create an excellent environment for supporters and research enthusiasts to learn, ask questions, help each other, and progress together. However, with many people, it is inevitable that there will be a mix of good and bad, and the group includes sincere and down-to-earth researchers whom we respect and welcome. Therefore, we do not want to be disturbed by a minority who come to advertise, slack off, or just watch the fun, which ultimately leads to our intentions going to waste and everyone’s enthusiasm being exhausted. To solve this problem, we have decided to raise the threshold for joining the group—charging for entry. Thus, those who wish to join are likely to be active users in the community, and mutual communication among community members would be delightful!
Therefore, to enhance everyone’s efficiency, motivate participation, and attract true research enthusiasts, we have decided to increase the number of groups and refine their functions, temporarily adding the following thematic groups:
-
Literature Download – Medical Monk
-
Machine Learning (Classification) – Medical Monk
-
ggplot Visualization – Medical Monk
-
Heatmap Visualization – Medical Monk
-
TCGA Mining – Medical Monk
-
GEO Mining – Medical Monk
-
Tumor Prognosis Models – Medical Monk
-
Tumor Molecular Subtypes – Medical Monk
We welcome friends to join the groups 👏👏👏, each group charges 15 yuan. Please contact the editor via WeChat yixuesengkyrj or scan the QR code below: