Click the above “Beginner’s Guide to Vision” to choose “Bookmark” or “Pin”
Important resources delivered promptlyPreviously, I mentioned PyTorch’s dedicated visualization tool visdom, refer to the PyTorch deep learning training visualization tool visdom. However, many TensorFlow users were accustomed to using TensorBoard for training visualization. To enable PyTorch users to also use TensorBoard, developers have provided a PyTorch version of TensorBoard, which is tensorboardX.
Installation and Startup
Users familiar with TensorBoard can seamlessly transition to tensorboardX, the installation method is:
pip install tensorboardXIn addition to installing PyTorch, you also need to install TensorFlow. Like TensorBoard, tensorboardX supports visualization methods for different types of objects such as scalar, image, figure, histogram, audio, text, graph, onnx_graph, embedding, pr_curve, video, etc.
The startup method for tensorboardX is the same as TensorBoard, run directly in the terminal:
tensorboard --logdir runsThen, execute the Python file in another terminal:
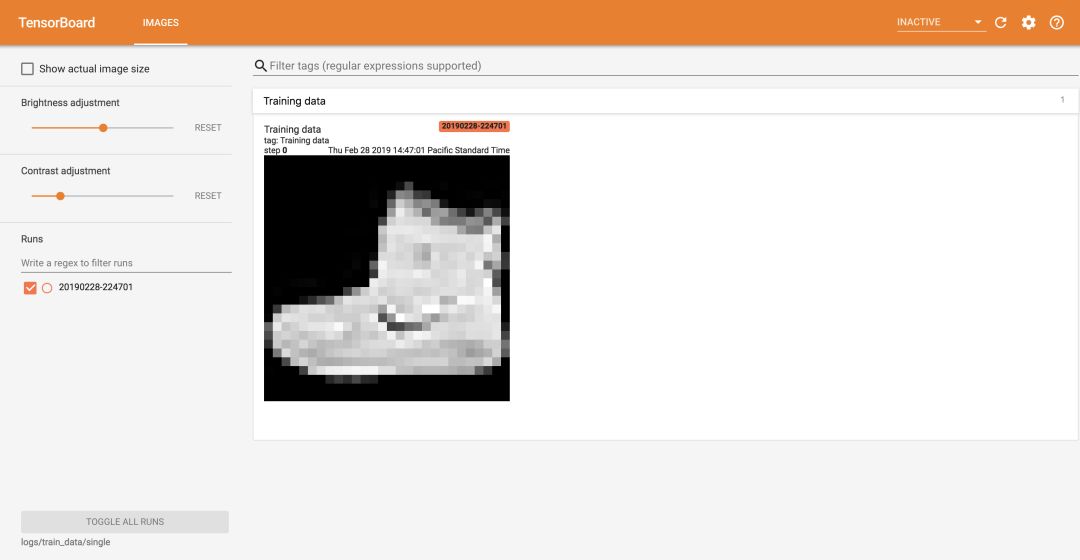
python demo.pyOpen localhost:6006 to see the tensorboardX visualization interface.
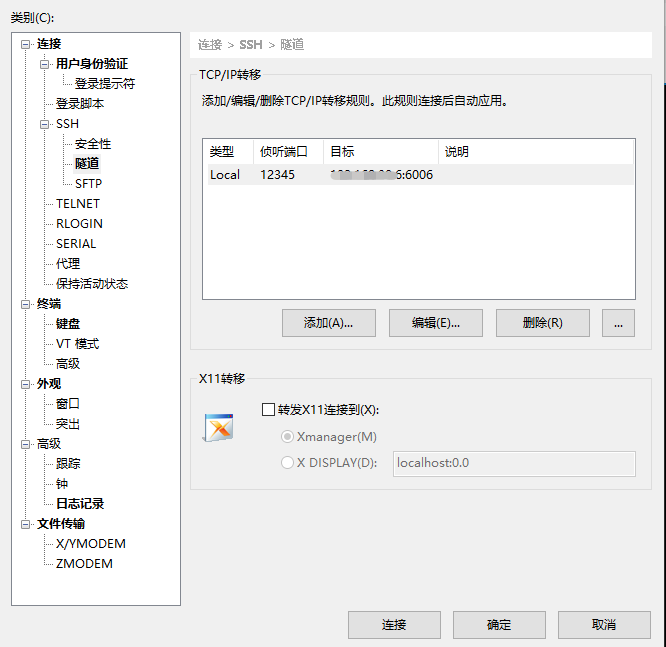
Starting tensorboardX locally is very easy, but generally, we train on a server, so to start tensorboardX remotely requires some simple settings. Taking the virtual machine tool xshell as an example: set file -> properties -> ssh -> tunnel -> add, type local, fill in the source host as 127.0.0.1 (local), set a port, for example, 12345, the target host is the server address, and the target port is generally 6006; if 6006 is occupied, it can be changed to another port.
After executing tensorboard and the Python script, open 127.0.0.1:12345 to access the remote TensorBoard interface.
Usage Example
Taking scalar as an example, let’s look at how to use tensorboardX:
import numpy as np
from tensorboardX import SummaryWriter
writer = SummaryWriter()
for i in range(100):
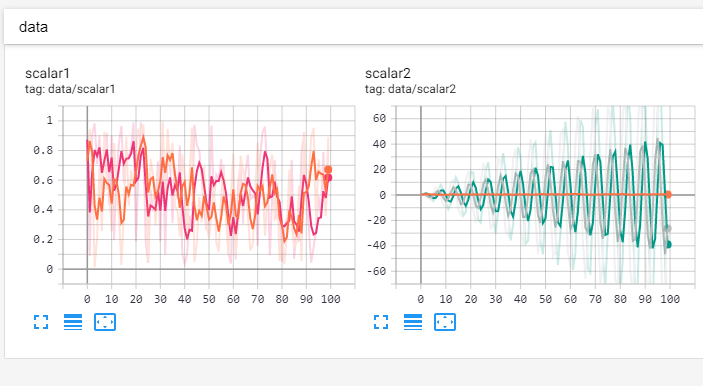
writer.add_scalar('data/scalar1', np.random.rand(), i)
writer.add_scalar('data/scalar2', {'xsinx': i*np.sin(i), 'xcosx': i*np.cos(i)}, i)
writer.close()The scalar visualization is shown in the figure below.
A complete tensorboardX usage demo is as follows:
import torch
import torchvision.utils as vutils
import numpy as np
import torchvision.models as models
from torchvision import datasets
from tensorboardX import SummaryWriter
resnet18 = models.resnet18(False)
writer = SummaryWriter()
sample_rate = 44100
freqs = [262, 294, 330, 349, 392, 440, 440, 440, 440, 440, 440]
for n_iter in range(100):
    dummy_s1 = torch.rand(1)
    dummy_s2 = torch.rand(1)
    # data grouping by `slash`
    writer.add_scalar('data/scalar1', dummy_s1[0], n_iter)
    writer.add_scalar('data/scalar2', dummy_s2[0], n_iter)
    writer.add_scalars('data/scalar_group', {'xsinx': n_iter * np.sin(n_iter),
                                             'xcosx': n_iter * np.cos(n_iter),
                                             'arctanx': np.arctan(n_iter)}, n_iter)
    dummy_img = torch.rand(32, 3, 64, 64)  # output from network
    if n_iter % 10 == 0:
        x = vutils.make_grid(dummy_img, normalize=True, scale_each=True)
        writer.add_image('Image', x, n_iter)
        dummy_audio = torch.zeros(sample_rate * 2)
        for i in range(x.size(0)):
            # amplitude of sound should in [-1, 1]
            dummy_audio[i] = np.cos(freqs[n_iter // 10] * np.pi * float(i) / float(sample_rate))
        writer.add_audio('myAudio', dummy_audio, n_iter, sample_rate=sample_rate)
        writer.add_text('Text', 'text logged at step:' + str(n_iter), n_iter)
        for name, param in resnet18.named_parameters():
            writer.add_histogram(name, param.clone().cpu().data.numpy(), n_iter)
        # needs tensorboard 0.4RC or later
        writer.add_pr_curve('xoxo', np.random.randint(2, size=100), np.random.rand(100), n_iter)
dataset = datasets.MNIST('mnist', train=False, download=True)
images = dataset.test_data[:100].float()
label = dataset.test_labels[:100]
features = images.view(100, 784)
writer.add_embedding(features, metadata=label, label_img=images.unsqueeze(1))
# export scalar data to JSON for external processing
writer.export_scalars_to_json("./all_scalars.json")
writer.close()
The visualization effect is shown below:
Good News!
Beginner’s Guide to Vision Knowledge Planet
Is now open to the public 👇👇👇
Download 1: OpenCV-Contrib Extension Module Chinese Version Tutorial
Reply in the “Beginner's Guide to Vision” public account: Extension Module Chinese Tutorial to download the first OpenCV extension module tutorial in Chinese, covering installation of extension modules, SFM algorithms, stereo vision, object tracking, biological vision, super-resolution processing, etc.

Download 2: Python Vision Practical Project 52 Lectures
Reply in the “Beginner's Guide to Vision” public account: Python Vision Practical Project to download 31 visual practical projects including image segmentation, mask detection, lane line detection, vehicle counting, eyeliner addition, license plate recognition, character recognition, emotion detection, text content extraction, face recognition, etc., to help quickly learn computer vision.

Download 3: OpenCV Practical Project 20 Lectures
Reply in the “Beginner's Guide to Vision” public account: OpenCV Practical Project 20 Lectures to download 20 practical projects based on OpenCV to achieve advanced learning of OpenCV.

Group Chat

Welcome to join the reader group of the public account to communicate with peers. Currently, there are WeChat groups for SLAM, 3D vision, sensors, autonomous driving, computational photography, detection, segmentation, recognition, medical imaging, GAN, algorithm competitions, etc. (will be gradually subdivided in the future). Please scan the WeChat number below to join the group, note: “nickname + school/company + research direction”, for example: “Zhang San + Shanghai Jiao Tong University + Vision SLAM”. Please note the format; otherwise, it will not be approved. After adding successfully, you will be invited to the relevant WeChat group based on research direction. Please do not send advertisements in the group; otherwise, you will be removed from the group. Thank you for your understanding~