Visualizing LSTM Networks: Exploring Memory Formation

Visualizing LSTM Networks: Exploring Memory Formation

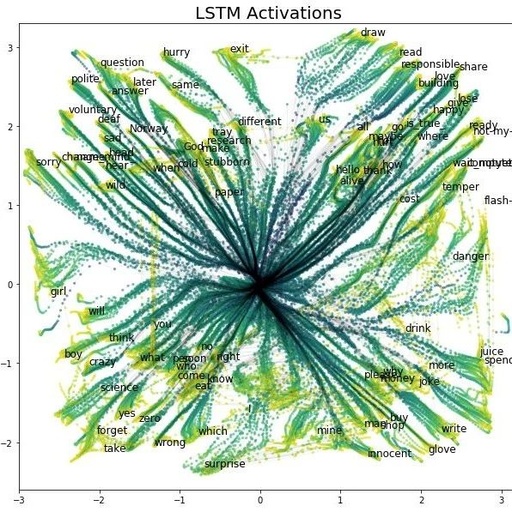
Selected from Medium Author: Piotr Tempczyk Translated by Machine Heart Contributors: Chen Yunzhu, Liu Xiaokun There are many studies on visualization in the field of convolutional neural networks, but there are not enough similar tools for LSTM. Visualizing LSTM networks can yield interesting results; due to their time-related characteristics, we can explore the relationships between … Read more

Visualizing LangGraph Structure With One Line of Code

Visualizing LangGraph Structure With One Line of Code

• Hello everyone, I am Student Zhang, sharing AI knowledge and practical cases daily. • Please like and follow 👏 for continuous learning and consistent valuable output. • +v: jasper_8017 let’s communicate 💬 and improve together 💪. Overview of Articles on Official Account Visualization is a very, very, very useful and friendly tool. In this … Read more

Explaining The Development of Explainable AI and Deep Learning

Explaining The Development of Explainable AI and Deep Learning

Click the “Expert Knowledge” above to follow for more AI insights! Source: Zhihu – Qs.Zhang https://zhuanlan.zhihu.com/p/30074544 【Introduction】Hello everyone, my name is Zhang Quanshi, a postdoctoral researcher at UCLA. Currently, I lead a team in Professor Zhu Songchun’s lab, focusing on explainable AI. The title of this article is quite grand; in this short essay, I … Read more

Understanding Character Relationships in ‘Story of Yanxi Palace’ Using Word2Vec

Understanding Character Relationships in 'Story of Yanxi Palace' Using Word2Vec

Source | Wujie Community Mixlab Editor | An Ke 【PanChuang AI Introduction】: Recently, everyone has been flooded with the popular Qing Dynasty drama “Story of Yanxi Palace”~ The male lead, Emperor Qianlong, is often referred to as a “big pig’s hoof” by everyone because he falls in love with every woman he meets. As simple … Read more

Understanding Machine Learning Model Explanations with R

Understanding Machine Learning Model Explanations with R

1. Introduction In the field of machine learning, the interpretability of models has always been an important research direction. Today, we would like to introduce a powerful R package — explainer, which provides strong support for understanding complex classification and regression models. This package mainly achieves detailed interpretation of complex models through Shapley analysis, which … Read more

Introducing PyTorch’s New Tool: MM for 3D Visualization of Matrix Multiplication and Transformer Attention

Introducing PyTorch's New Tool: MM for 3D Visualization of Matrix Multiplication and Transformer Attention

Click belowCard, follow the “CVer” public account AI/CV heavy content delivered instantly Click to enter—>【Computer Vision and Transformer】Group Chat Reprinted from: New Intelligence | Edited by:Peach 【Guide】The latest 3D visualization tool “mm” launched by the PyTorch team can simulate the matrix multiplication of the real world. The simulated world in the matrix is really here. … Read more

A Beginner’s Guide to TensorFlow Playground

A Beginner's Guide to TensorFlow Playground

Introduction: Hello, readers of the “Beginner’s Data Learning” series! It has been a while. Google recently launched a neural network visualization teaching platform called “TensorFlow Playground”. You can now play with neural networks right in your browser! Isn’t that amazing? After trying it out with the beginner, you’ll definitely feel like, “Aha, this is what … Read more

Gephi: A Python Library for Graph Data Visualization and Analysis

Gephi: A Python Library for Graph Data Visualization and Analysis

Gephi: A Python Library for Graph Data Visualization and Analysis In the fields of data science and network analysis, graph data is widely used in various areas such as social networks, internet link structures, and recommendation systems. As the scale of data increases and the complexity of analysis demands rises, how to efficiently visualize and … Read more

Data Visualization Tutorial for Animating Time-Dynamic Behavior in Social Networks

Data Visualization Tutorial for Animating Time-Dynamic Behavior in Social Networks

Big Data Digest authorized reprint from Data Pie THU Author: Haaya Naushan Translation: Che Qianzi, Ouyang Jin When it comes to analyzing social networks, my previous articles mainly focused on Natural Language Processing (NLP), or more specifically, Arabic NLP. However, tweets are not just text data; they represent network connections between Twitter users. Adding network … Read more

Kimi + Deepseek: Effortless Visualization Charts!

Kimi + Deepseek: Effortless Visualization Charts!

Thank you for reading. I am Jiang Feng, focusing on AI tools, intelligent agents, and AI programming. Follow our public account to receive a big gift package, including AI/Python/eBooks materials. There are benefits at the end of the article. The domestic large model Deepseek has successfully attracted the attention of AI tech leaders worldwide. Recently, … Read more