1. Introduction
install.packages("explainer")#install.packages("devtools")devtools::install_github("PERSIMUNE/explainer")library(explainer)library(mlr3verse)library(dplyr)df <- read.csv("boston.csv") tk <- as_task_regr(df,target="medv") # Set tasksp <- partition(tk) # Data splittingmod <- lrn("regr.lightgbm") # Set modelsmod$train(tk,sp$train) # Model trainingmod$predict(tk,sp$test) # PredictionSHAP_output <- eSHAP_plot_reg( task = tk, trained_model = mod, splits = sp, seed = 1)SHAP_output[[1]] # Interactive Shapley summary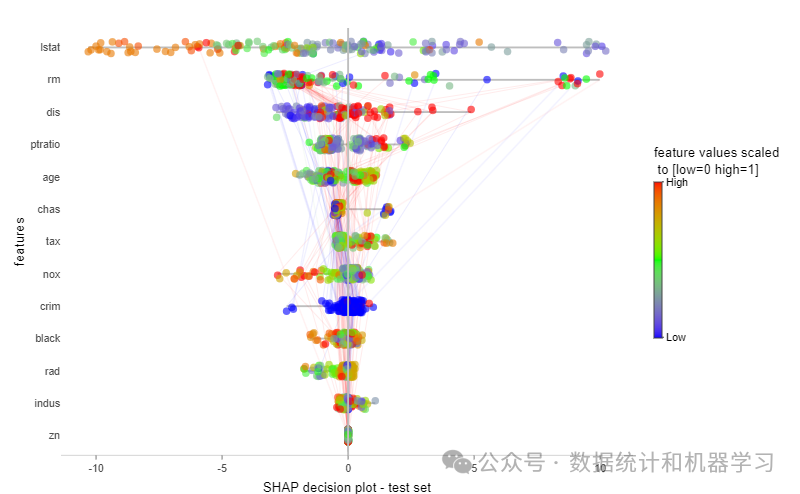
regressmdl_eval_results <- regressmdl_eval(  task = tk,  trained_model = mod,  splits = sp)
# Resultsregressmdl_eval_results
MSE RMSE MAE R_squared1 13.56915 3.683633 2.396991 0.8222139data("BreastCancer", package = "mlbench")BC <- BreastCancer[, -1] %>% na.omit()tk_class <- as_task_classif(BC,target="Class")sp_class <- partition(tk_class)mod_class <- lrn("classif.catboost",predict_type="prob")mod_class$train(tk_class,sp_class$train)mod_class$predict(tk_class,sp_class$test)confusionmatrix_plot <- eCM_plot( task = tk_class, trained_model = mod_class, splits = sp_class)confusionmatrix_plot$train_set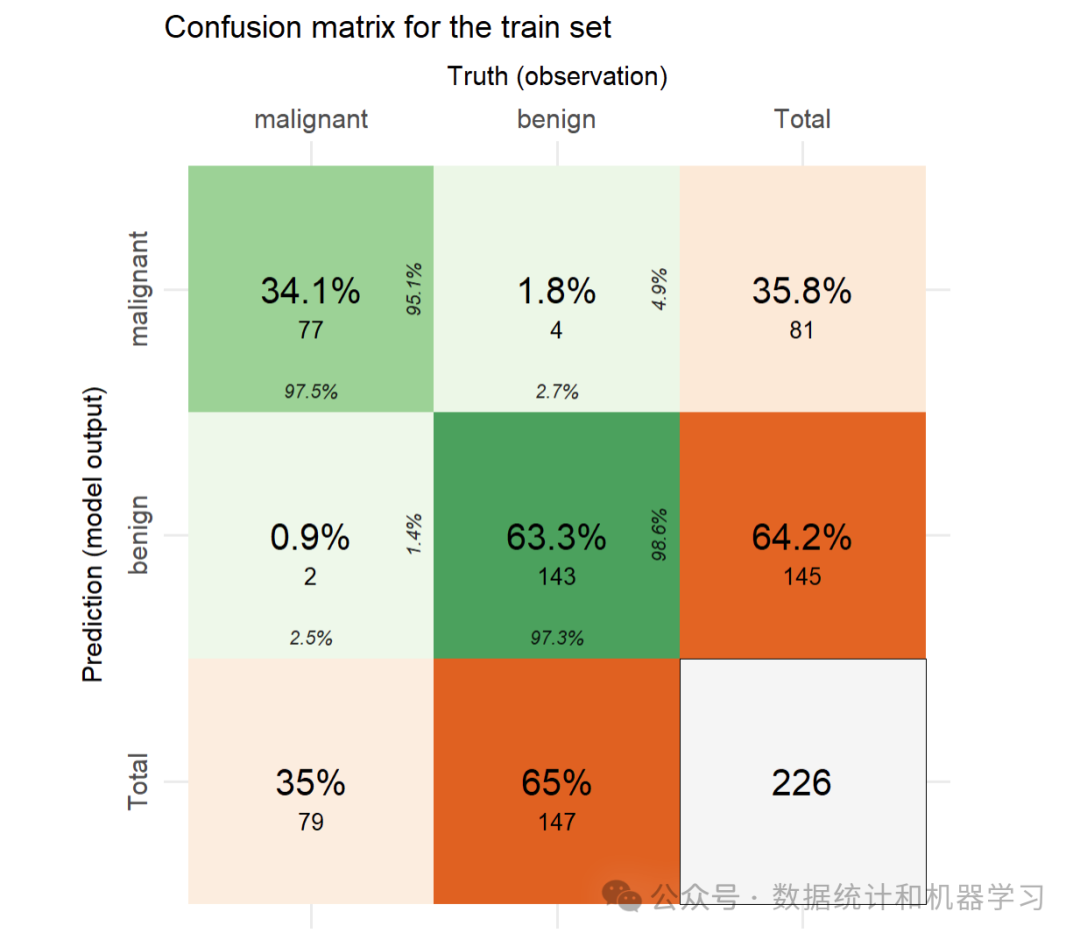
confusionmatrix_plot$test_set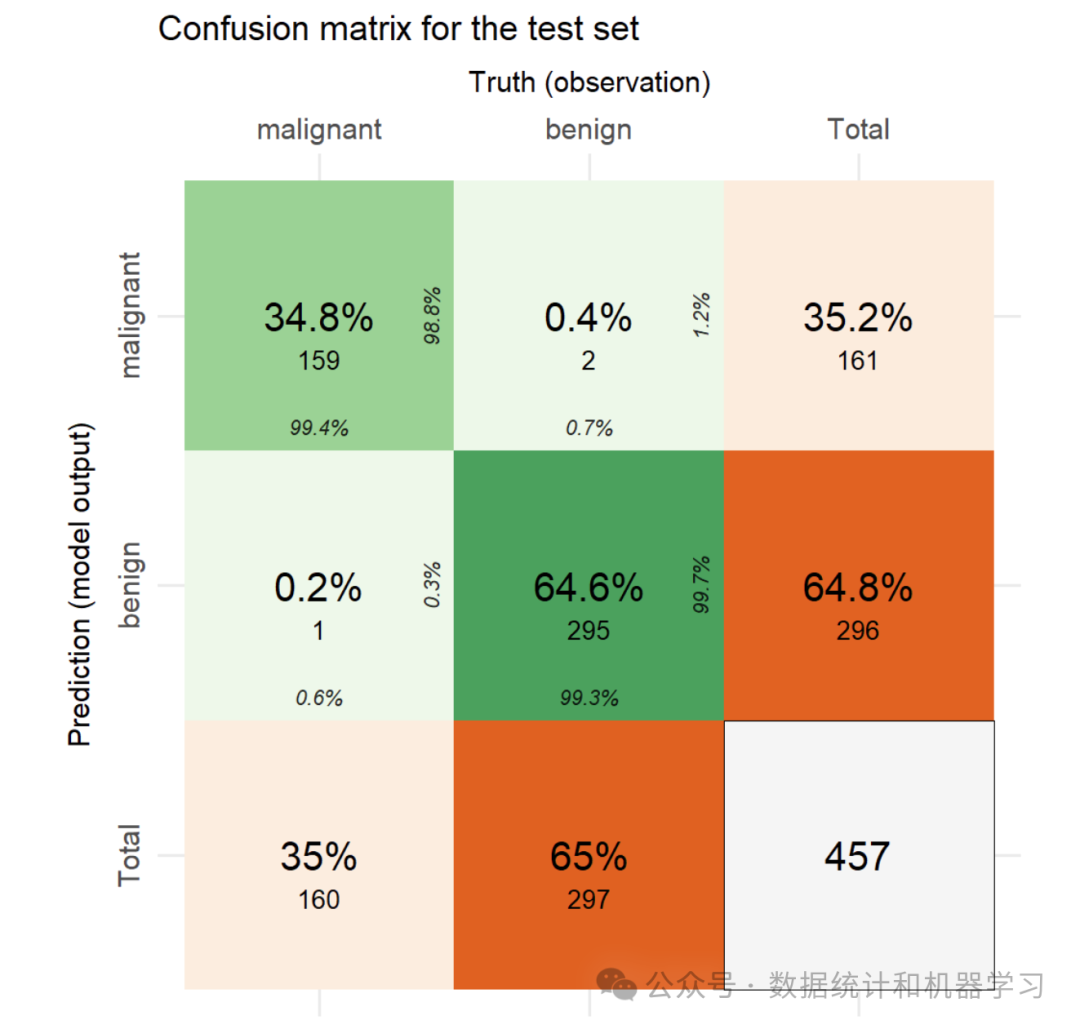
eDecisionCurve( task = tk_class, trained_model = mod_class, splits = sp_class, seed = 1)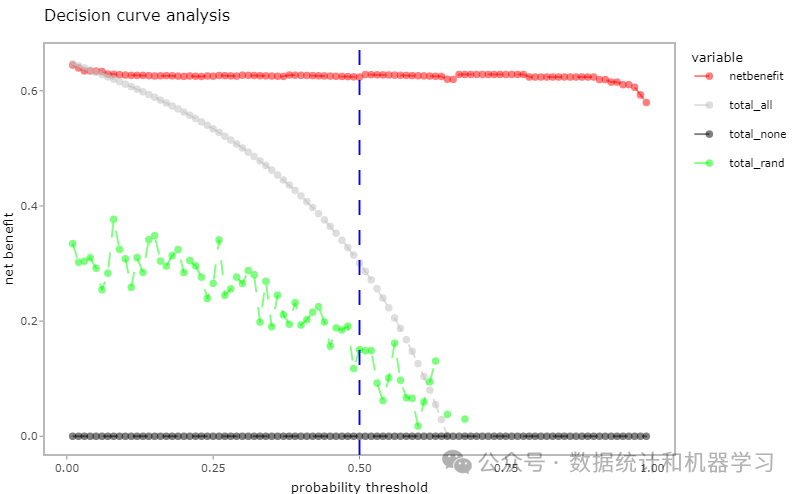
eROC_plot( task = tk_class, trained_model = mod_class, splits = sp_class)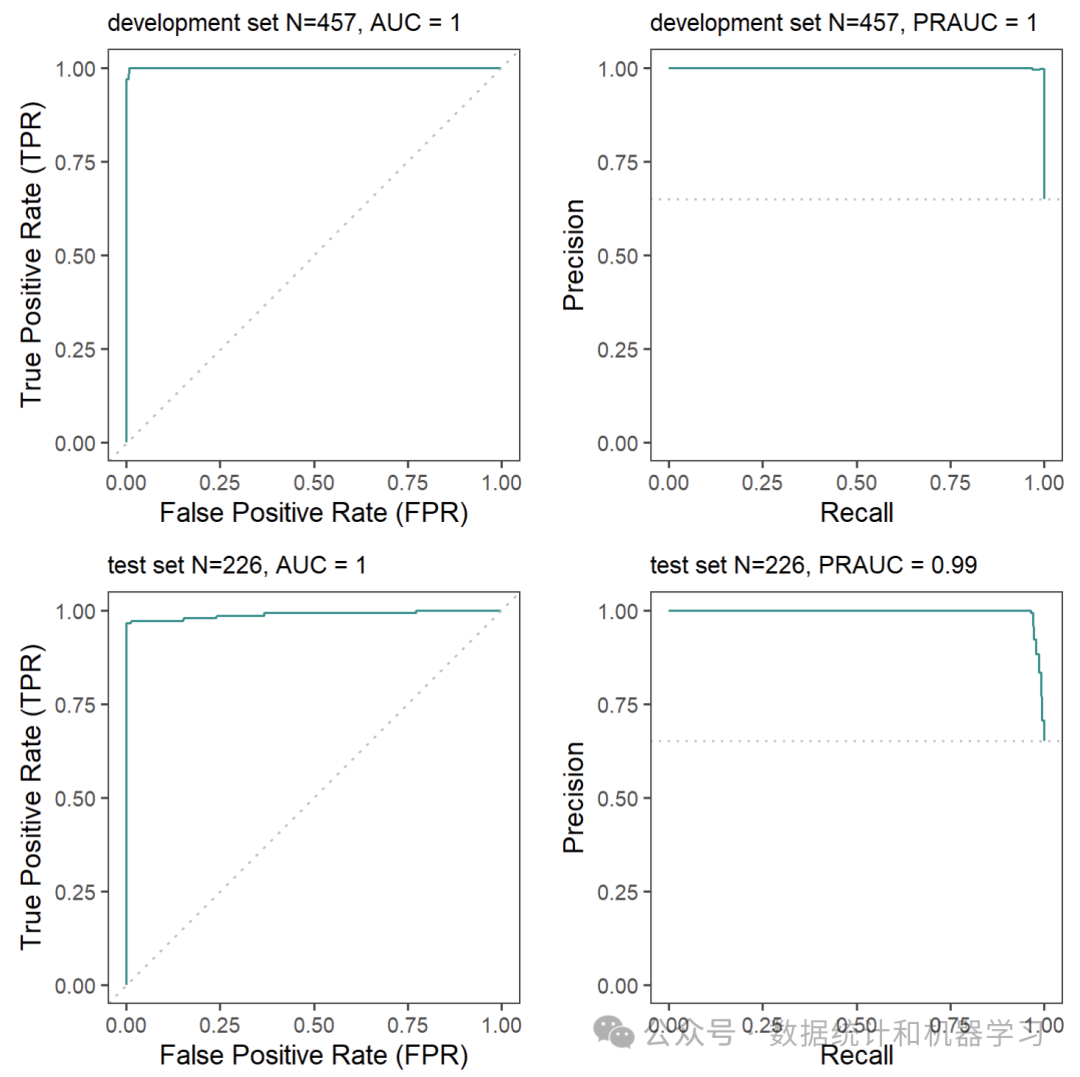
ePerformance( task = tk_class, trained_model = mod_class, splits = sp_class)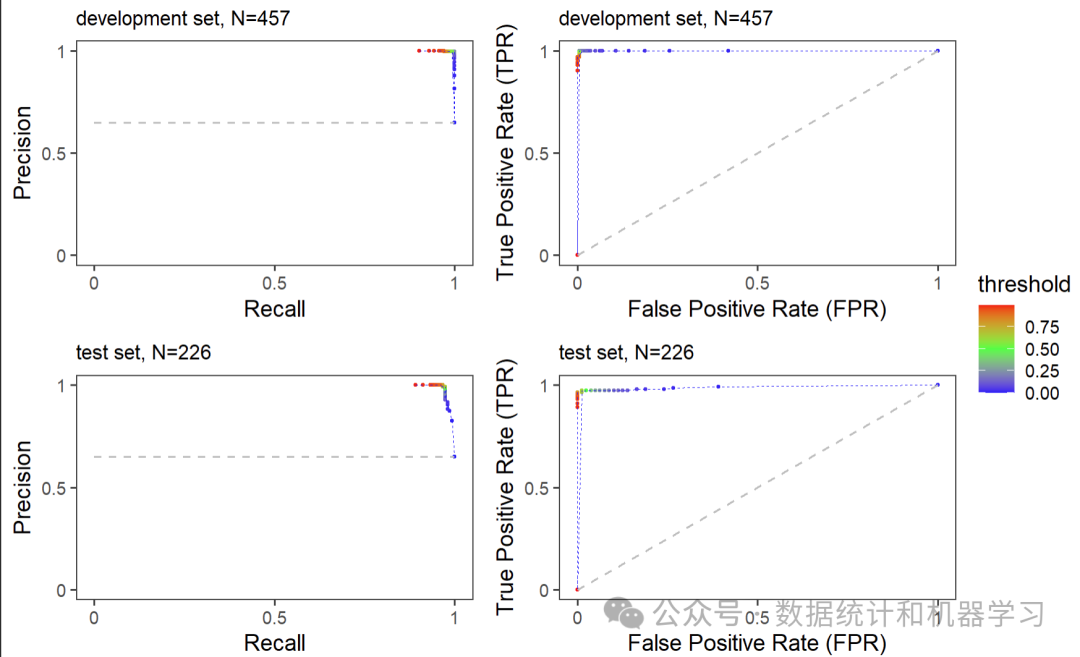
SHAP_output <- eSHAP_plot( task = tk_class, trained_model = mod_class, splits = sp_class, sample.size = 30, seed = 1, subset = .8)SHAP_output[[1]]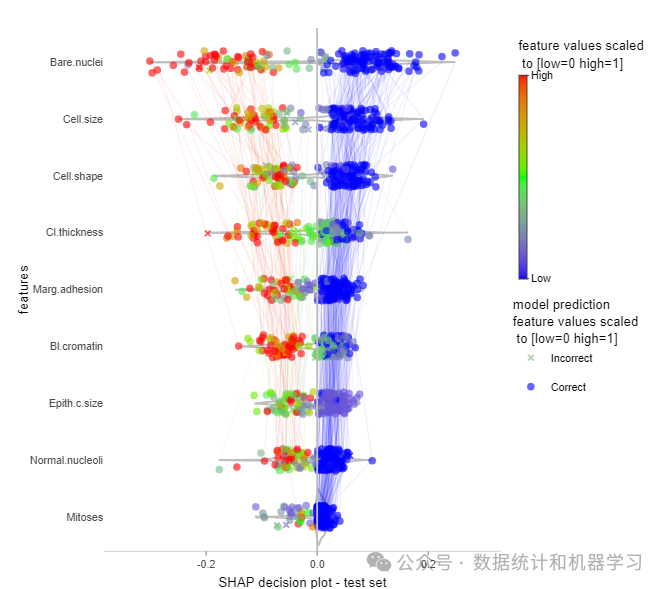
shap_Mean_wide <- SHAP_output[[2]]shap_Mean_long <- SHAP_output[[3]]shap <- SHAP_output[[4]]ShapFeaturePlot(shap_Mean_long)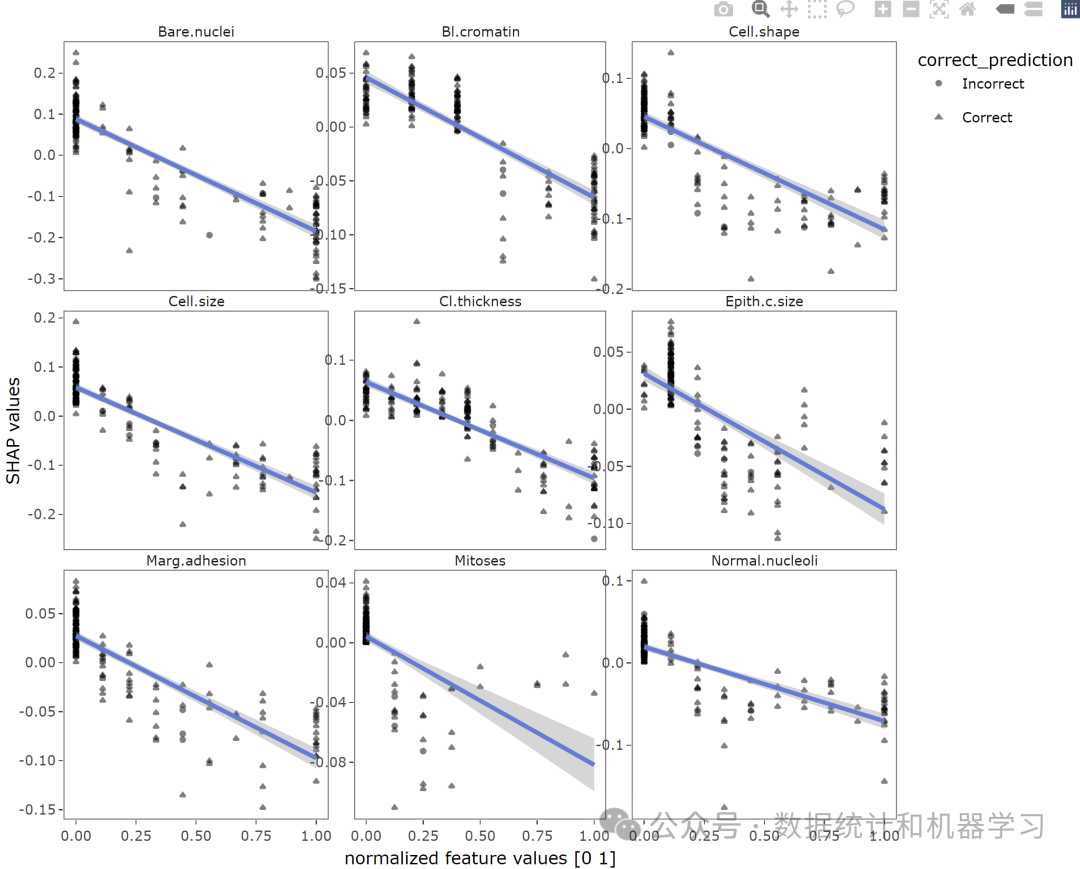
ShapPartialPlot(shap_Mean_long = shap_Mean_long)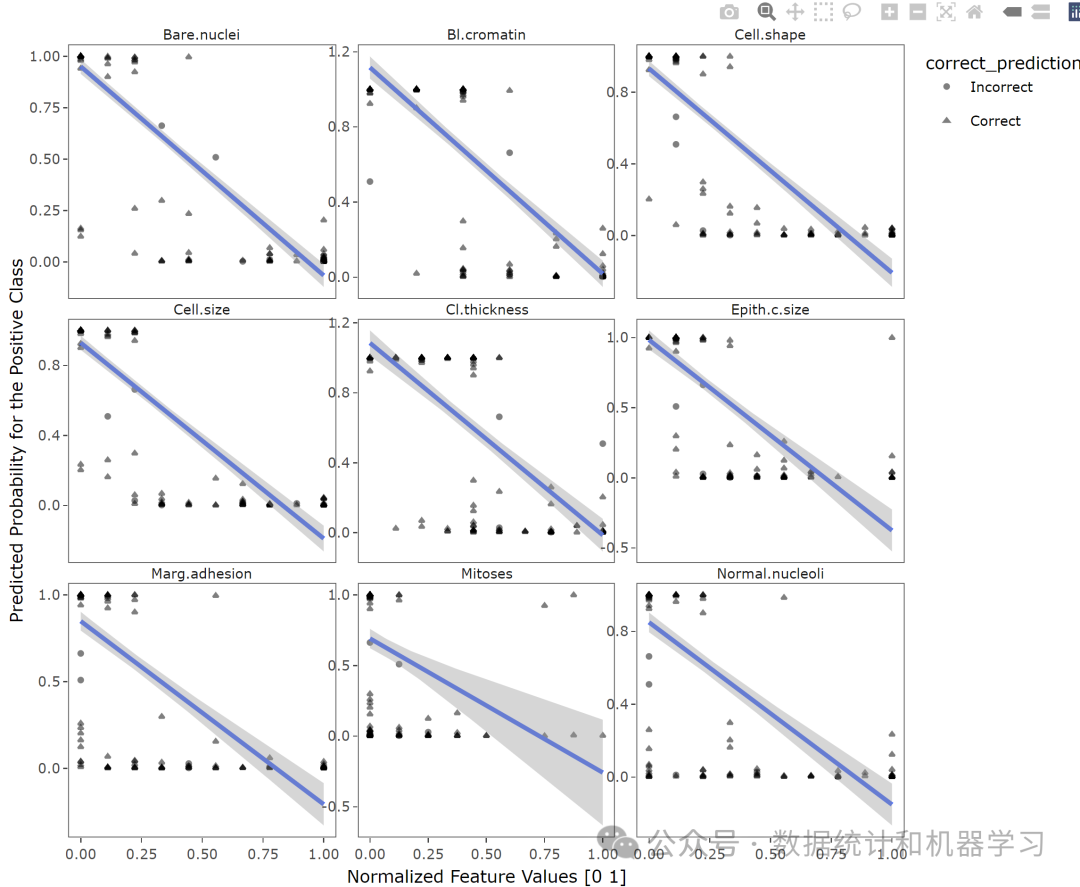
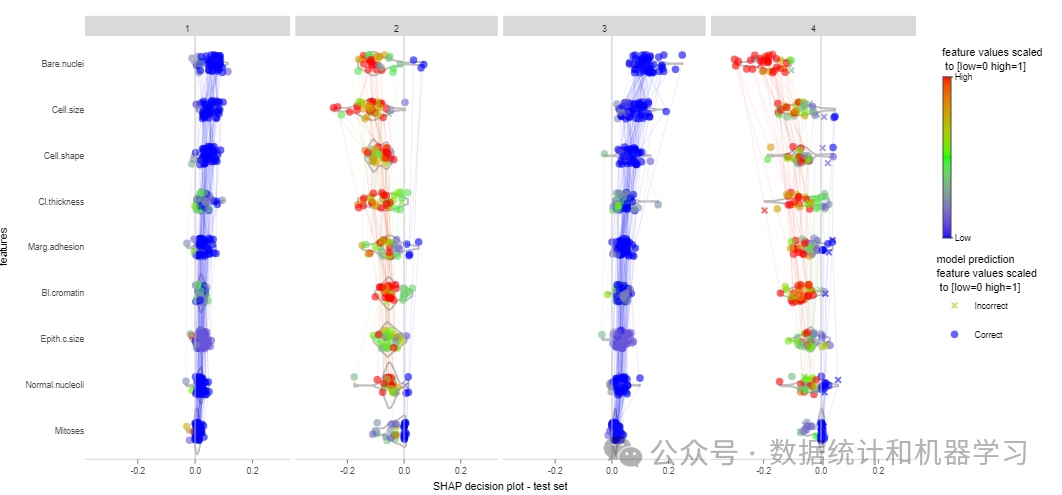
SHAP_plot_clusters <- SHAPclust( task = tk_class, trained_model = mod_class, splits = sp_class, shap_Mean_wide = shap_Mean_wide, shap_Mean_long = shap_Mean_long, num_of_clusters = 4, seed = 1, subset = .8)SHAP_plot_clusters[[1]]