Recently, I have been reading the book “Machine Learning in Action” because I want to delve deeper into machine learning algorithms, and since I want to learn Python, I chose this book to study based on my friend’s recommendation. Before writing this article, I had some understanding of FCM, so I feel an inexplicable affinity for the K-means algorithm. Anyway, today I will learn the K-means clustering algorithm with everyone.
1. Overview of K-Means Clustering
1. Clustering
“Class” refers to a collection of similar items. Clustering means dividing a dataset into several classes such that the data within each class is as similar as possible, while the data between classes is as different as possible. Cluster analysis is based on similarity, dividing the dataset into clusters, and is a type of unsupervised learning.
2. Unsupervised Learning vs. Supervised Learning
In the previous article, we verified KNN, which is different from K-means clustering as it belongs to unsupervised learning. So, what is the difference between supervised learning and unsupervised learning? Supervised learning knows what to learn from the objects (data), while unsupervised learning does not need to know the target it is searching for; it identifies common features of the data based on the algorithm. For example, in classification and clustering, classification already knows the categories to be obtained, while clustering is different; it only divides objects into different clusters based on similarity.
3. K-means
The k-means algorithm is a simple iterative clustering algorithm that uses distance as a similarity metric to discover K classes in a given dataset, where the center of each class is obtained by averaging all values in the class, and each class is described by its cluster center. For a given dataset X containing n d-dimensional data points and K categories to be divided, the Euclidean distance is chosen as the similarity metric, and the clustering objective is to minimize the sum of squared distances within each class, that is, to minimize:
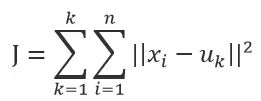
Combining the least squares method and Lagrange’s principle, the cluster center is the average of all data points in the corresponding category. To ensure the algorithm converges, the final cluster centers should remain as unchanged as possible during the iteration process.
4. Algorithm Process
K-means is a repetitive iterative process, and the algorithm consists of four steps:
1) Select K objects in the data space as initial centers, with each object representing a cluster center;
2) For the data objects in the sample, based on their Euclidean distance to these cluster centers, assign them to the class corresponding to the nearest cluster center (most similar) according to the nearest distance criterion;
3) Update the cluster centers: take the mean of all objects corresponding to each category as the cluster center for that category, and calculate the value of the objective function;
4) Determine whether the cluster centers and the value of the objective function have changed. If unchanged, output the results; if changed, return to step 2).
Let’s illustrate with the following example:
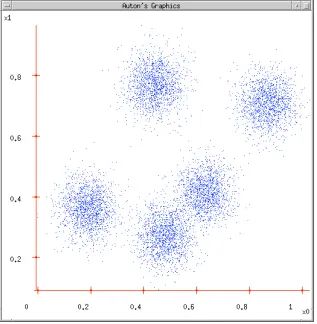
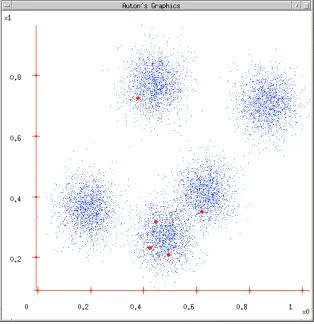
Figure 1 Figure 2
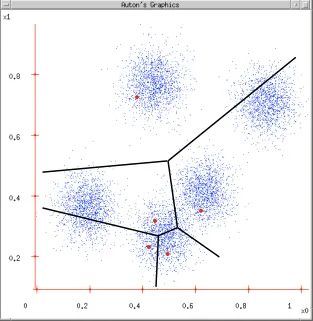
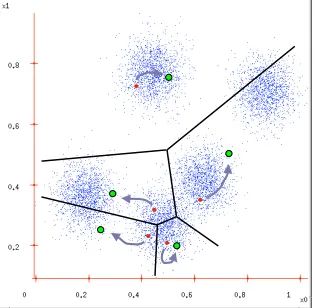
Figure 3 Figure 4
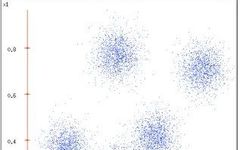
Figure 1: Given a dataset;
Figure 2: Initialize cluster centers based on K = 5, ensuring that the cluster centers are within the data space;
Figure 3: Divide the data based on the similarity metric calculated between the objects within the class and the cluster centers;
Figure 4: Use the mean of the data within the class as the cluster center and update the cluster center.
Finally, determine whether the algorithm has ended to ensure convergence.
2. Python Implementation
First, I need to mention that I am using Python 2.7, and here is the code:
# K-means algorithm implementation# -*-coding:utf-8 -*-from numpy import *from math import sqrt

import syssys.path.append("C:/Users/Administrator/Desktop/k-means的python实现") def loadData(fileName):    data = []    fr = open(fileName)    for line in fr.readlines():        curline = line.strip().split('\t')        frline = map(float,curline)        data.append(frline)    return data'''#testa = mat(loadData("C:/Users/Administrator/Desktop/k-means/testSet.txt"))print a'''# Calculate Euclidean distancedef distElud(vecA,vecB):    return sqrt(sum(power((vecA - vecB),2)))# Initialize cluster centersdef randCent(dataSet,k):    n = shape(dataSet)[1]    center = mat(zeros((k,n)))    for j in range(n):        rangeJ = float(max(dataSet[:,j]) - min(dataSet[:,j]))        center[:,j] = min(dataSet[:,j]) + rangeJ * random.rand(k,1)    return center'''#testa = mat(loadData("C:/Users/Administrator/Desktop/k-means/testSet.txt"))n = 3b = randCent(a,3)print b'''def kMeans(dataSet,k,dist = distElud,createCent = randCent):    m = shape(dataSet)[0]    clusterAssment = mat(zeros((m,2)))    center = createCent(dataSet,k)    clusterChanged = True    while clusterChanged:        clusterChanged = False        for i in range(m):            minDist = inf            minIndex = -1            for j in range(k):                distJI = dist(dataSet[i,:],center[j,:])                if distJI < minDist:                    minDist = distJI                    minIndex = j            if clusterAssment[i,0] != minIndex:# Check for convergence                clusterChanged = True            clusterAssment[i,:] = minIndex,minDist ** 2        print center        for cent in range(k):# Update cluster center            dataCent = dataSet[nonzero(clusterAssment[:,0].A == cent)[0]]            center[cent,:] = mean(dataCent,axis = 0)# axis is to sum each column, while axis=1 means summing each row    return center,clusterAssment'''#testdataSet = mat(loadData("C:/Users/Administrator/Desktop/k-means/testSet.txt"))k = 4a = kMeans(dataSet,k)print a'''
3. MATLAB Implementation
Previously, I had optimized some clustering algorithms using MATLAB, and naturally, it is a bit more intuitive for me compared to Python. Based on the steps of the algorithm, here is the program:
%%%K-means
clear allclc
%% Construct random data mu1=[0 0 0];  S1=[0.23 0 0;0 0.87 0;0 0 0.56]; data1=mvnrnd(mu1,S1,100);   % Generate Gaussian distribution data
%% Second class data mu2=[1.25 1.25 1.25];S2=[0.23 0 0;0 0.87 0;0 0 0.56];data2=mvnrnd(mu2,S2,100);
% Third class data mu3=[-1.25 1.25 -1.25];S3=[0.23 0 0;0 0.87 0;0 0 0.56];data3=mvnrnd(mu3,S3,100);
mu4=[1.5 1.5 1.5];S4=[0.23 0 0;0 0.87 0;0 0 0.56];data4 =mvnrnd(mu4,S4,100);
% Display data figure;plot3(data1(:,1),data1(:,2),data1(:,3),'+');title('Original Data');hold onplot3(data2(:,1),data2(:,2),data2(:,3),'r+');plot3(data3(:,1),data3(:,2),data3(:,3),'g+');plot3(data4(:,1),data4(:,2),data3(:,3),'y+');grid on;

data=[data1;data2;data3;data4];   [row,col] = size(data);K = 4;max_iter = 300;%% Iteration timesmin_impro = 0.1;%%%% Minimum step size display = 1;%%% Judgment condition center = zeros(K,col);U = zeros(K,col);%% Initialize cluster centers mi = zeros(col,1);ma = zeros(col,1);for i = 1:col    mi(i,1) = min(data(:,i));    ma(i,1) = max(data(:,i));    center(:,i) = ma(i,1) - (ma(i,1) - mi(i,1)) * rand(K,1);end
%% Start iterationfor o = 1:max_iter    %% Calculate Euclidean distance, using norm function    for i = 1:K        dist{i} = [];        for j = 1:row            dist{i} = [dist{i};data(j,:) - center(i,:)];        end    end        minDis = zeros(row,K);    for i = 1:row        tem = [];        for j = 1:K            tem = [tem norm(dist{j}(i,:))];        end        [nmin,index] = min(tem);        minDis(i,index) = norm(dist{index}(i,:));    end            %% Update cluster centers     for i = 1:K        for j = 1:col            U(i,j) = sum(minDis(:,i).*data(:,j)) / sum(minDis(:,i));        end     end          %% Judgment      if display   end   if o >1,       if max(abs(U - center)) < min_impro;           break;       else           center = U;       end   endend
 %% Return belonging categories class = []; for i = 1:row     dist = [];     for j = 1:K         dist = [dist norm(data(i,:) - U(j,:))];     end     [nmin,index] = min(dist);     class = [class;data(i,:) index]; end   %% Display final results[m,n] = size(class);figure;title('Clustering Results');hold on;for i=1:row     if class(i,4)==1            plot3(class(i,1),class(i,2),class(i,3),'ro');     elseif class(i,4)==2         plot3(class(i,1),class(i,2),class(i,3),'go');     elseif class(i,4) == 3         plot3(class(i,1),class(i,2),class(i,3),'bo');     else        plot3(class(i,1),class(i,2),class(i,3),'yo');     endendgrid on;
The final results are shown in Figures 5 and 6:
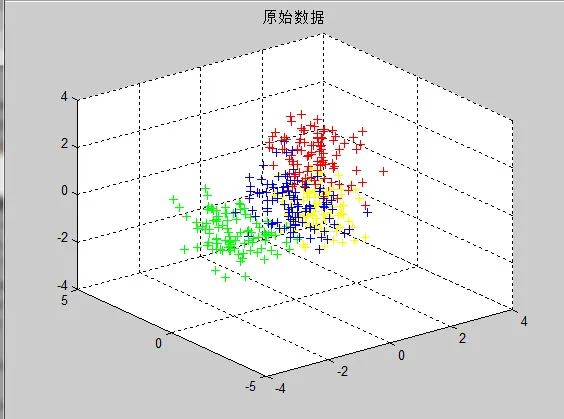
Figure 5 Original Data
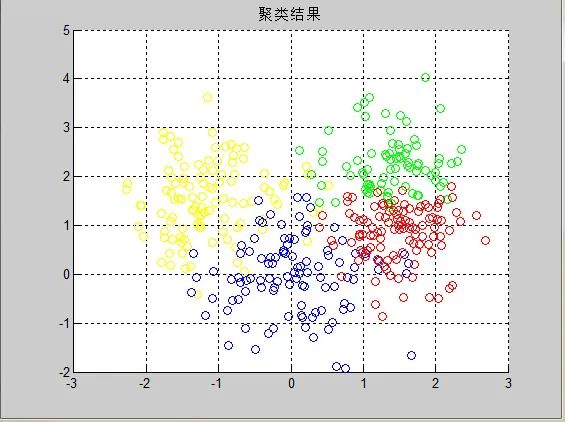 Figure 6 Clustering Results
Conclusion: During this program debugging, many issues arose, and the similarity metric used is still Euclidean distance. Previously, I was calculating directly according to the formula, but the Euclidean distance is actually the 2-norm, and the 2-norm is a unitary invariant norm; therefore, the 2-norm of a matrix is the largest singular value of the matrix, and during the solving process, the norm function can be used to simplify.
The results in the above figures clearly show that the algorithm has a certain clustering effect. To further verify, metrics such as MCR, NMI, or ARI can be used to measure the quality of clustering results. Here, I choose MCR for verification, with the code as follows:
%% Using MCR to judge clustering effect B = class(:,4); B = reshape(B,1,row); A = [ones(1,100),2 * ones(1,100),3 *ones(1,100),4 * ones(1,100)]; sum = 0;for i = 1:row if ( A(1,i) ~= B(1,i)) sum = sum + 1; endendMCR = sum / row;fprintf('MCR = %d\n',MCR);
Through multiple calculations, the average MCR obtained is 0.53, indicating a relatively high misclassification rate, and the clustering effect is not very ideal. The reason is that although the algorithm converges, it only converges to a local minimum, not the global minimum, so the bisecting K-means can be introduced to optimize the algorithm.
In addition, the FCM algorithm is also an optimization of the algorithm to some extent.
Furthermore, I imported the wine dataset from the UCI database for testing, and the results were not very satisfactory. As for the reasons, the performance of the algorithm is one aspect, and there may also be a relatively high dimensionality of the data… I do not dare to speculate, and will verify slowly later…