
Most existing commercial ECG analysis systems are often based on rule-based algorithms as disease-specific ECG diagnostic standards. Research indicates that machine learning can effectively recognize ECG diagnoses from a set of labeled data. This data-driven learning analysis can serve as a powerful supplement to existing automated ECG algorithms and can establish a new ECG diagnostic system or optimize current diagnostic standards. However, some operations of machine learning are difficult to understand, and existing ECG diagnostic standards are not easily integrated into these algorithms.
Therefore, to leverage the advantages of machine learning in routine ECG analysis, it is necessary to compare machine learning algorithms with the currently established clinical ECG standards, including commercial algorithms and interpretations by cardiology experts. Based on this, professors from the University of California developed a Convolutional Neural Network (CNN) that can accept and train on ECG data that is easily accessible by most institutions, namely XML format ECG waveform data and text diagnoses confirmed by cardiology experts. The performance of the CNN was analyzed and compared against the diagnoses of cardiology experts and the commercially available ECG system MUSE to evaluate the strengths and weaknesses of the CNN. The results were published in the journal JAMA Cardiology, which is worth our study and reference.
The study included ECGs from 365,009 adults (average age 56.2 years, 50.3% female, 48% white) totaling 992,748 ECGs. The ECGs were first analyzed by GE’s MUSE software, and the preliminary diagnoses from MUSE were submitted to cardiology experts for modification or confirmation. The unedited MUSE diagnoses and the clinical diagnosis texts confirmed by cardiology experts were extracted. Subsequently, the study developed and trained a CNN for 38 common ECG diagnoses (Table 1): first, the CNN validated against the clinical diagnoses of cardiology experts in the test dataset (Figure 1); additionally, a committee of three electrophysiologists conducted a second diagnostic validation to collaboratively determine the ECG diagnoses. The strengths and weaknesses of the CNN algorithm, MUSE algorithm, and clinical cardiology experts were compared.
Table 1: Comparison of CNN vs. Clinical Diagnoses by Cardiologists in 38 Diagnostic Categories Maintained in the Test Dataset (N = 32,576 patients; 91,440 ECGs)
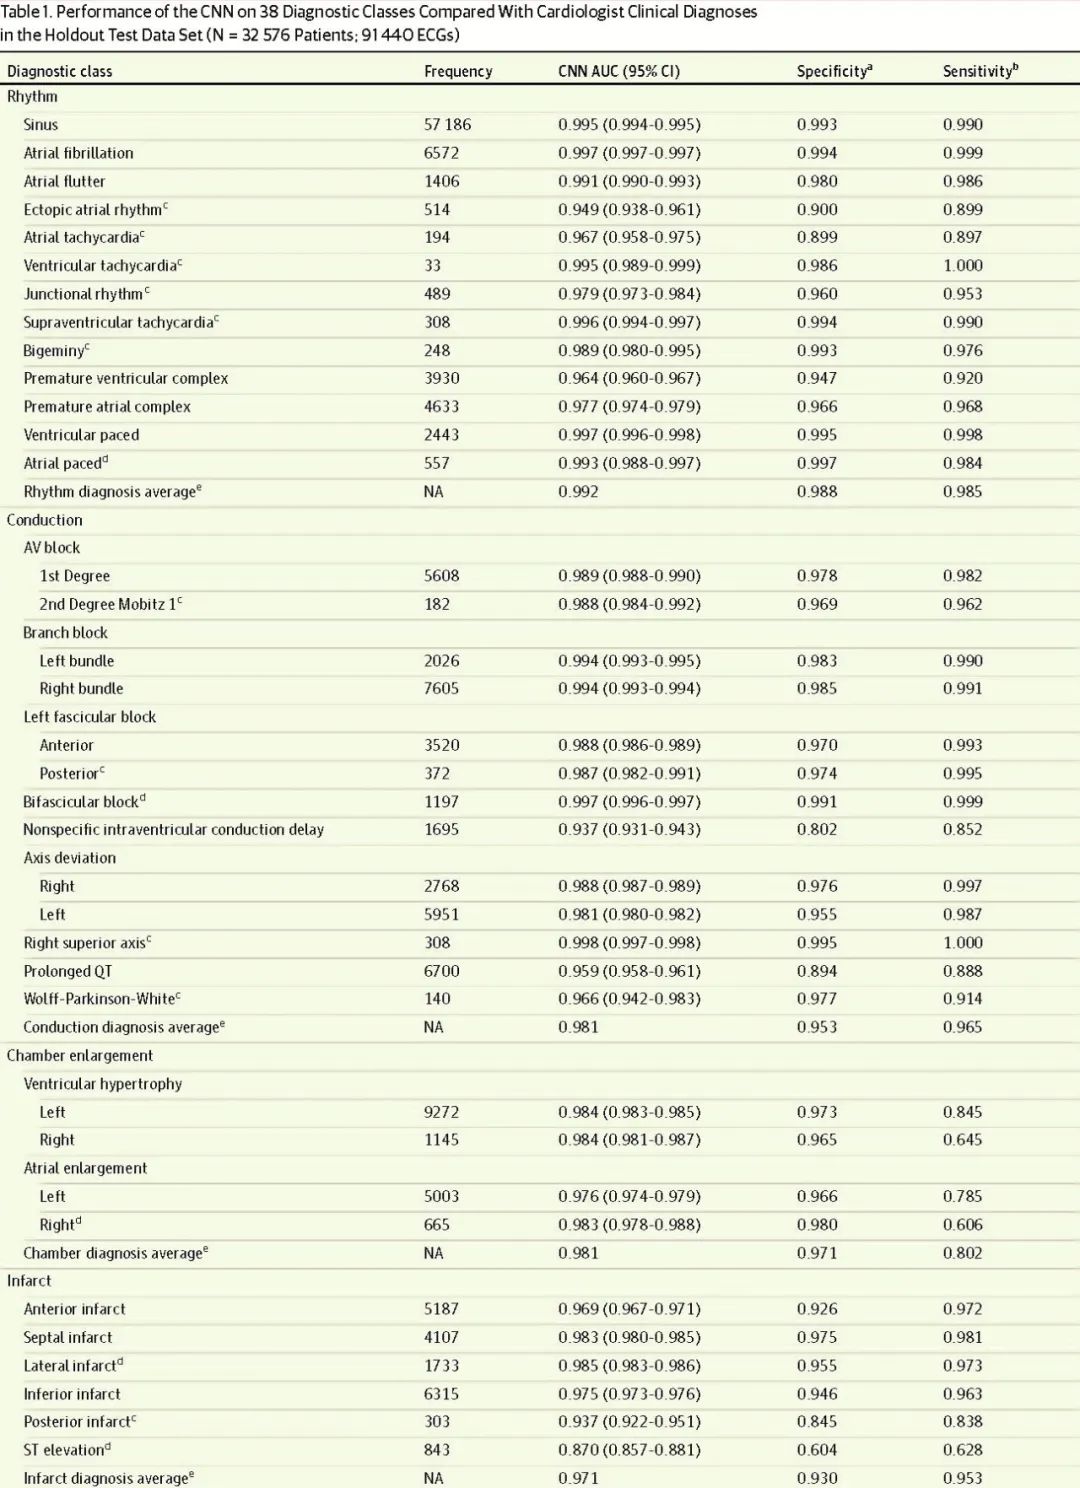

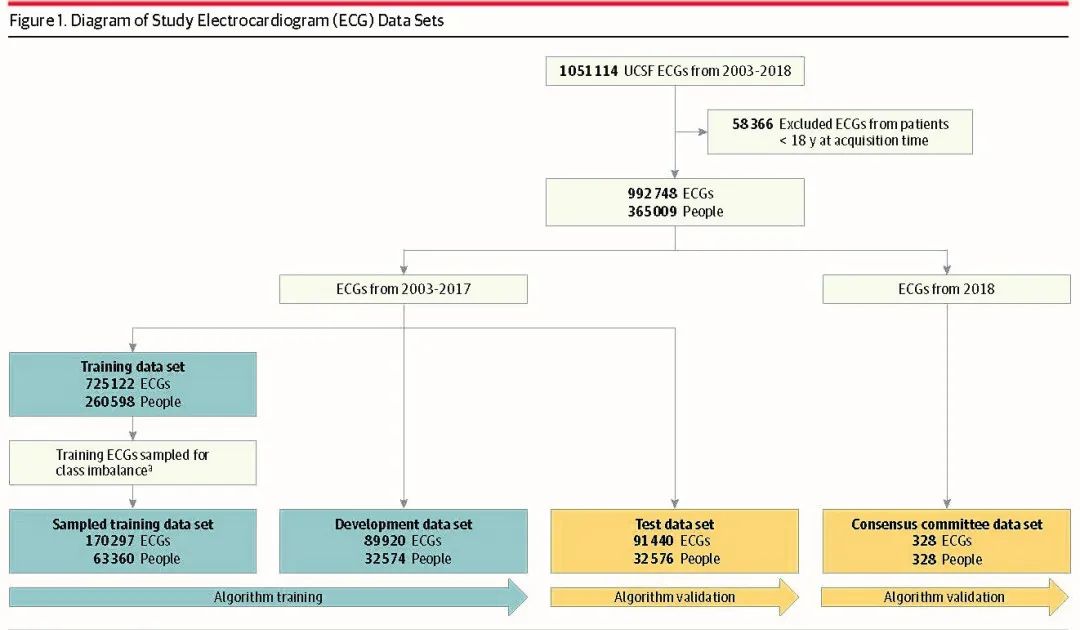
Figure 1: Flowchart of ECG Data Analysis.
a The sampled training dataset was randomly extracted from the training data to address class imbalance issues. The consensus committee dataset individuals were not included in other datasets. The blue box indicates the dataset used for training; the yellow box indicates the dataset used for validation.
UCSF stands for the University of California, San Francisco.
The results showed that in the 91,440 ECG test data, compared to the committee diagnoses, the CNN had a higher frequency-weighted F1 average across five analytical categories compared to cardiology experts and MUSE diagnoses (rhythm 0.812, conduction 0.729, chamber diagnosis 0.598, myocardial infarction 0.674, others 0.875; see Table 2, Figure 2). The CNN analysis diagnosed 32 out of 38 ECG categories (84.2%) with an area under the ROC curve of at least 0.96. The F1 value of the CNN was similar to that of the cardiology experts; except for atrial fibrillation, its sensitivity was superior to that of the cardiology experts (borderline arrhythmia 0.526 vs 0.72, ventricular premature beats 0.786 vs 0.87, WPW 0.8 vs 0.842); compared to MUSE diagnoses, the CNN diagnosis had a higher F1 value except for supraventricular tachycardia. The CNN analysis used a linear interpretable model-agnostic explanation (LIME) to highlight which ECG segments drove specific CNN diagnoses (Figure 3), indicating that examples within each diagnosis category showed similarities and could elucidate disease-related cardiac physiology.
Table 2: Performance Comparison of CNN, Cardiologists, and MUSE Diagnoses in 38 Diagnostic Categories Compared to Committee Consensus Diagnoses (N = 328)
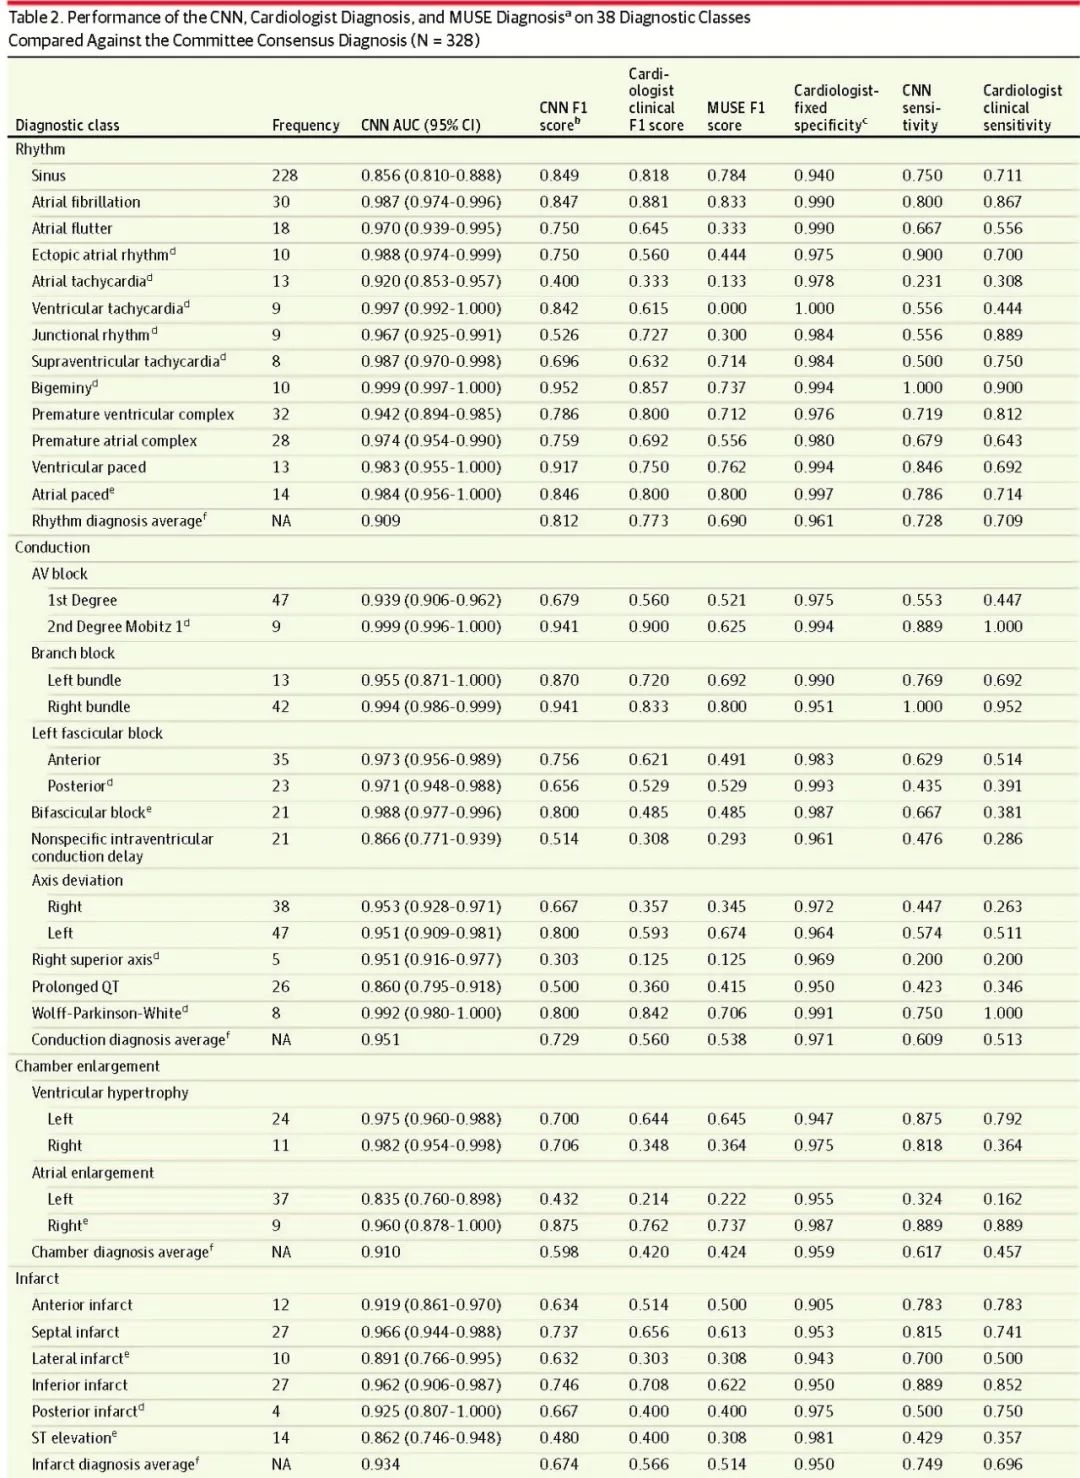

Abbreviations: AUC, area under the receiver operating characteristic curve; AV, atrioventricular; CNN, convolutional neural network; MUSE, ECG interpretation database management system by General Electric Healthcare;
a Total diagnosis N = 948.
b F1 score is a global indicator of algorithm performance, rewarding algorithms that maximize positive predictive values and sensitivity. The F1 score reported for CNN is the maximum F1 score in the consensus committee dataset.
c Each ECG category’s specificity is fixed to that of the cardiology experts. The convolutional neural network reports sensitivity for each category with the same fixed specificity as that of the cardiology experts’ clinical diagnoses. MUSE’s sensitivity and specificity are fixed and reported separately in eTable 3 in the supplement as MUSE’s specificity cannot be adjusted to match the specificity of the cardiology experts’ clinical diagnoses shown here.
dN = <4000 in the sampled training dataset for that category.
eN = <8000 in the sampled training dataset for that category.
f Frequency-weighted average.
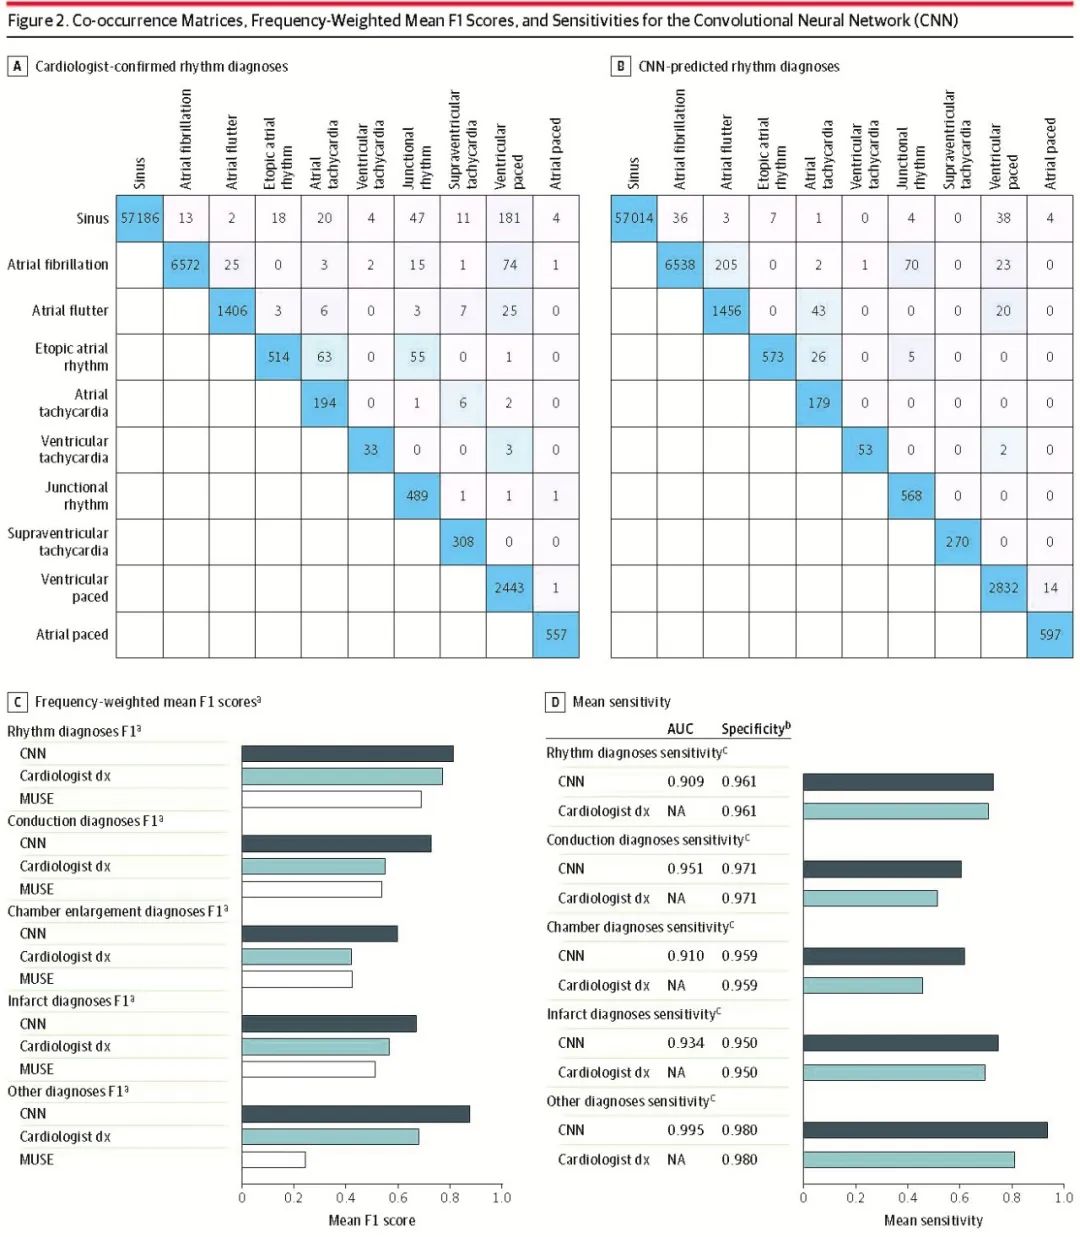
Figure 2: Co-occurrence Matrix, Frequency-Weighted Average F1 Score, and Sensitivity of the Convolutional Neural Network (CNN)
(A) Co-occurrence matrix of rhythm diagnoses confirmed by cardiology experts and (B) CNN predicted rhythm diagnoses. The counts of co-occurring diagnoses show totals on the diagonal. C, average F1 score with committee consensus diagnoses. D, average sensitivity with committee consensus diagnoses.
AUC indicates area under the receiver operating characteristic curve; cardiologist dx=clinical diagnosis by cardiology experts; MUSE=ECG interpretation database management system by General Electric Healthcare;
a Frequency-weighted average F1 score by category.
b Specificity fixed at the frequency-weighted average cardiology expert clinical diagnosis specificity for each category; sensitivity is reported here with that fixed specificity. MUSE sensitivity/specificity is unchangeable, so it is reported in the supplementary Table 3.
c Sensitivity averaged by category frequency.
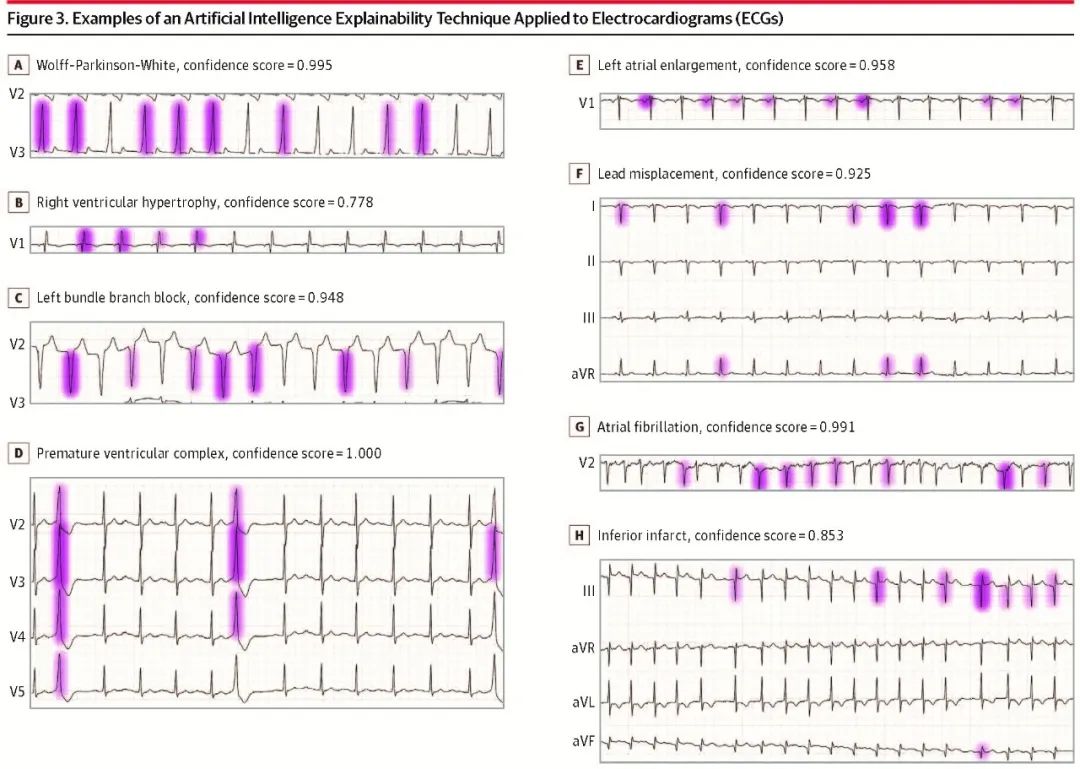
Figure 3: The Linear Interpretable Model-Agnostic Explanation (LIME) technique highlights the importance of each ECG segment’s diagnosis by the convolutional neural network, with greater color intensity indicating more critical segments. For each example, all segments highlighted with LIME, along with the CNN’s confidence scores. Highlighted ECG features include: Wolff-Parkinson-White, QRS pre-excitation “triangular wave”; in right ventricular hypertrophy, R-prime in V1; in inferior wall myocardial infarction, Q waves in inferior leads III and aVF. Unipolar limb leads (H), a indicates enhancement; F, foot; L, left arm; R, right arm; and V, vector.
Summary
The results of this cross-sectional study indicate that, except for a few ECG categories, currently accessible ECG data can be used to train CNN algorithms, achieving automatic analysis diagnoses comparable to those of clinical cardiology experts and superior to MUSE. The LIME technique can highlight the physiological value of ECG segments relevant to CNN diagnoses.
Source
PMID: 34347007
Editor | Review: Du Xianfeng
Translation: Shen Caijie
Editor: Fang Renyuan
Previous Recommendations
Catheter Ablation + ICD | First-line Treatment for Myopathy with Monomorphic Ventricular Tachycardia
Beware! High-IQ Research Teams Encounter High-IQ Scams
Is Early Discontinuation of Antithrombotic Drugs After Left Atrial Appendage Occlusion Dangerous?
Brugada Syndrome Risk Prediction Model
ECG Reading | What Arrhythmia Do You Consider?
Successful Completion of the Left Atrial Appendage Occlusion Cloud Salon
Atrioventricular Block with Wide-Narrow Wave Alternation: Revealing the Ashman Phenomenon
Can Thrombus Aspiration Be Performed in Left Atrial Appendage Occluder Thrombus?
At the Beginning of the Journey, Dust Not Yet Washed Away, Galloping Forward Again
What Are the Clinical Features and Risk Factors of Children with Brugada Syndrome or BrS-Type ECG?
Gender Differences in Left Atrial Appendage Occlusion Surgery
Can Mobile AI Software Accurately Identify QTc?
What Other Arrhythmias Can Smartwatches Detect Besides Atrial Fibrillation?
Occluder Embolization: An Inescapable “Secret”
What Are the Characteristics of Cardiac MRI and Electroanatomical Mapping in Brugada Syndrome?
Case Sharing | What? Can Pacemakers Be Installed in the Left Atrial Appendage?