From Financial Time Series to Image Recognition: Stock Quantitative Strategy Based on Deep CNN (With Code)
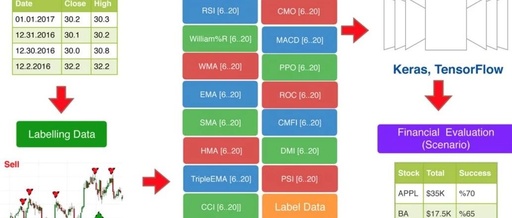
Star ★TopPublic AccountLove you all♥ Author: Nayak Translated by: 1+1=6 0 Introduction This article is based on a research paper titled“Algorithmic Financial Trading with Deep Convolutional Neural Networks: Time Series to Image Conversion Approach”: Get the paper at the end of the article We borrowed some core ideas from the authors of this paper while … Read more