
-
1. Visualization using Streamlit. -
2. Calculating rolling averages and momentum indicators to understand market trends. -
3. Using Llama 3 to interpret the data.
import yfinance as yf
import pandas as pd
import schedule
import time
import ollama
from datetime import datetime, timedelta
<span><span># Fetching historical data for Apple (AAPL) and Dow Jones (DJI) for yesterday (1-minute intervals)</span></span>stock = yf.Ticker("AAPL")
dow_jones = yf.Ticker("^DJI")
data = stock.history(period="1d", interval="1m")
dow_data = dow_jones.history(period="1d", interval="1m")
data.head()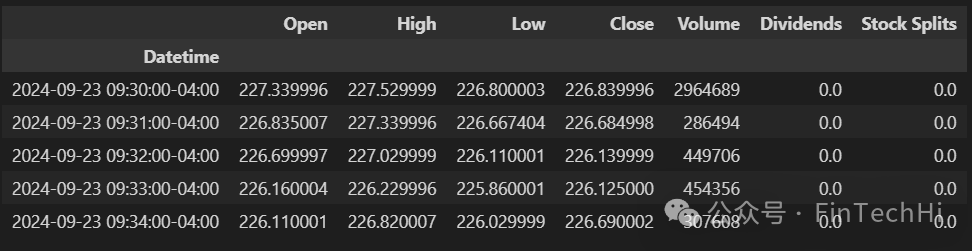
<span><span>Global</span><span> variables </span><span>to</span><span> store rolling data </span><span>for</span><span> analysis</span></span>
rolling_window = pd.DataFrame()
dow_rolling_window = pd.DataFrame()
# Variables to track daily context
daily_high = float('-inf')
daily_low = float('inf')
buying_momentum = 0
selling_momentum = 0
This code defines several global variables to store rolling data and track daily market conditions.
-
rolling_window and dow_rolling_window are used to store rolling data for Apple and the Dow Jones index. A few variables are then defined to track daily market conditions.
-
daily_high and daily_low are initialized to negative and positive infinity, respectively, to record the day’s highest and lowest prices. By initializing them to extreme values, we ensure that they will be correctly set to the day’s actual high and low prices as real data updates.
-
buying_momentum and selling_momentum are initialized to 0 to track the buying and selling momentum of the day. These variables help analyze market sentiment and trends, determining whether the market is in a buying or selling state.
<span><span>get_market_open_duration</span><span>: Extract current time from the last element of the window</span></span>def get_market_open_duration(window): # Extract current time from the last element of the window current_time = window.index[-1].time() # Returns a datetime.time object # Get the previous trading day's date previous_trading_day = datetime.today() - timedelta(days=1) # Combine the previous trading day with the current time current_datetime = datetime.combine(previous_trading_day, current_time) # Define the market opening time as 09:30:00 on the previous trading day market_start_time = datetime.combine(previous_trading_day, datetime.strptime("09:30:00", "%H:%M:%S").time()) # Calculate the duration the market has been open in minutes market_open_duration = (current_datetime - market_start_time).total_seconds() / 60 # in minutes return market_open_duration<span><span>get_natural_language_insights</span><span>: generate natural language insights using Ollama (******Important here, can be replaced with other models.)</span></span>
def get_natural_language_insights( rolling_avg, ema, rsi, bollinger_upper, bollinger_lower, price_change, volume_change, dow_rolling_avg, market_open_duration, dow_price_change, dow_volume_change, daily_high, daily_low, buying_momentum, selling_momentum): prompt = f""" You are a professional stock broker. Apple's stock has a 5-minute rolling average of {rolling_avg:.2f}. The Exponential Moving Average (EMA) is {ema:.2f}, and the Relative Strength Index (RSI) is {rsi:.2f}. The Bollinger Bands are set with an upper band of {bollinger_upper:.2f} and a lower band of {bollinger_lower:.2f}. The price has changed by {price_change:.2f}, and the volume has shifted by {volume_change}. The DOW price has changed by {dow_price_change:.2f}, and the volume has shifted by {dow_volume_change}. Meanwhile, the Dow Jones index has a 5-minute rolling average of {dow_rolling_avg:.2f}. The market has been open for {market_open_duration:.2f} minutes. Today's high was {daily_high:.2f} and low was {daily_low:.2f}. The buying momentum is {buying_momentum:.2f} and selling momentum is {selling_momentum:.2f}. Based on this data, provide insights into the current stock trend and the general market sentiment. The insights should not be longer than 100 words and should not have an introduction. """ response = ollama.chat( model="llama3", messages=[{"role": "user", "content": prompt}] ) response_text = response['message']['content'].strip() # Print the natural language insight print("Natural Language Insight:", response_text)<span><span>calculate_insights</span><span>: moving averages and trends</span></span>
def calculate_insights(window, dow_window): if len(window) >= 5: # Calculate 5-minute rolling average of the 'Close' prices rolling_avg = window['Close'].rolling(window=5).mean().iloc[-1] # Calculate price change and volume change price_change = window['Close'].iloc[-1] - window['Close'].iloc[-2] if len(window) >= 2 else 0 volume_change = window['Volume'].iloc[-1] - window['Volume'].iloc[-2] if len(window) >= 2 else 0 # Calculate DOW price change and volume change dow_price_change = dow_window['Close'].iloc[-1] - dow_window['Close'].iloc[-2] if len(dow_window) >= 2 else 0 dow_volume_change = dow_window['Volume'].iloc[-1] - dow_window['Volume'].iloc[-2] if len(dow_window) >= 2 else 0 # Calculate Exponential Moving Average (EMA) and Bollinger Bands (with a 5-period window) ema = window['Close'].ewm(span=5, adjust=False).mean().iloc[-1] std = window['Close'].rolling(window=5).std().iloc[-1] bollinger_upper = rolling_avg + (2 * std) bollinger_lower = rolling_avg - (2 * std) # Calculate Relative Strength Index (RSI) if there are enough periods (14 is typical) delta = window['Close'].diff() gain = delta.where(delta > 0, 0) loss = -delta.where(delta < 0, 0) avg_gain = gain.rolling(window=14, min_periods=1).mean().iloc[-1] avg_loss = loss.rolling(window=14, min_periods=1).mean().iloc[-1] rs = avg_gain / avg_loss if avg_loss != 0 else float('nan') rsi = 100 - (100 / (1 + rs)) # Calculate Dow Jones index rolling average dow_rolling_avg = dow_window['Close'].rolling(window=5).mean().iloc[-1] market_open_duration = get_market_open_duration(window) # Print the calculated insights print(f"5-minute Rolling Average: {rolling_avg:.2f}") print(f"EMA: {ema:.2f}") print(f"RSI: {rsi:.2f}") print(f"Bollinger Upper Band: {bollinger_upper:.2f}, Lower Band: {bollinger_lower:.2f}") print(f"Price Change: {price_change:.2f}") print(f"Volume Change: {volume_change}") print(f"DOW Price Change: {dow_price_change:.2f}") print(f"DOW Volume Change: {dow_volume_change}") print(f"Dow Jones 5-minute Rolling Average: {dow_rolling_avg:.2f}") print(f"Daily High: {daily_high:.2f}, Daily Low: {daily_low:.2f}") print(f"Buying Momentum: {buying_momentum:.2f}, Selling Momentum: {selling_momentum:.2f}") print(f"Market has been open for {market_open_duration:.2f} minutes") if int(market_open_duration) % 5 == 0: # Trigger LLM every 5 minutes get_natural_language_insights( rolling_avg, ema, rsi, bollinger_upper, bollinger_lower, price_change, volume_change, dow_rolling_avg, market_open_duration, dow_price_change, dow_volume_change, daily_high, daily_low, buying_momentum, selling_momentum )<span><span>process_stock_update</span><span>: process a new stock update every minute</span></span>
def process_stock_update(): global rolling_window, data, dow_rolling_window, dow_data global daily_high, daily_low, buying_momentum, selling_momentum if not data.empty and not dow_data.empty: # Simulate receiving a new data point for AAPL and Dow Jones update = data.iloc[0].to_frame().T time_str = update.index[0].time() print(time_str) # Output: ['09:30:00'] dow_update = dow_data.iloc[0].to_frame().T data = data.iloc[1:] # Safely remove the first row without causing index issues dow_data = dow_data.iloc[1:] # Append the new data points to the rolling windows rolling_window = pd.concat([rolling_window, update], ignore_index=False) dow_rolling_window = pd.concat([dow_rolling_window, dow_update], ignore_index=False) # Update daily high and low daily_high = max(daily_high, update['Close'].values[0]) daily_low = min(daily_low, update['Close'].values[0]) # Calculate momentum based on price changes if len(rolling_window) >= 2: price_change = update['Close'].values[0] - rolling_window['Close'].iloc[-2] if price_change > 0: buying_momentum += price_change else: selling_momentum += abs(price_change) # Limit the rolling window to 5 minutes for moving average if len(rolling_window) > 5: rolling_window = rolling_window.iloc[1:] if len(dow_rolling_window) > 5: dow_rolling_window = dow_rolling_window.iloc[1:] # Calculate insights (moving averages, Bollinger Bands, RSI, etc.) calculate_insights(rolling_window, dow_rolling_window)<span><span>Schedule job to simulate receiving updates every minute:</span></span>
schedule.every(10).seconds.do(process_stock_update)
# Run the scheduled jobs
print("Starting real-time simulation for AAPL stock updates...")
while True:    schedule.run_pending()    time.sleep(1)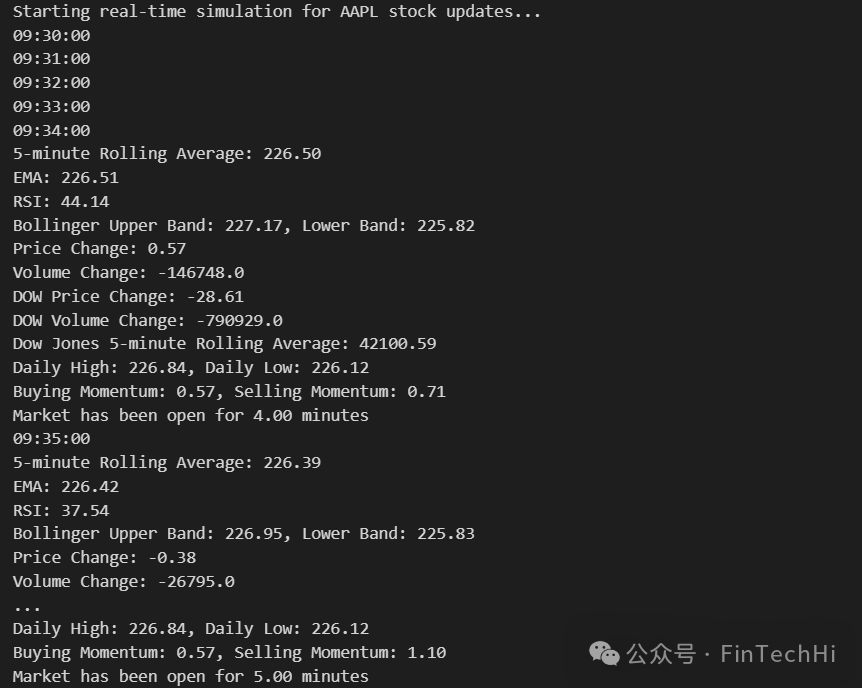
UsingStreamlit to design an interface:
# Streamlit UI
st.title("AI Stock Advisor")
logtxtbox = st.empty()
logtxt = '09:30:00'
logtxtbox.caption(logtxt)
message = st.chat_message("assistant")
message.write("Starting real-time simulation for AAPL stock updates. First update will be processed in 5 minutes...")