Skip to content
In 2020, the “butterfly effect” was triggered in China’s pharmaceutical industry, with the two wings of this butterfly being the introduction of the MAH system and the initiation of centralized procurement. The MAH system is of great significance in encouraging drug innovation and improving drug quality. According to the MAH system, the drug marketing authorization holder will bear legal responsibility for the safety, efficacy, and quality control of the drug. The “soulful bargaining” of centralized procurement has left many manufacturers in tears on-site. How to reasonably control and reduce the quality costs of drugs while ensuring high safety, high efficacy, and high quality of drugs is of extremely important practical significance.
 This article does not intend to start from lean production or process optimization; rather, it attempts to introduce data mining and machine algorithms into drug inspection work in this era of emerging advanced algorithms, establishing a predictive model that may serve as a glimpse into the broader picture and ignite further discussion.
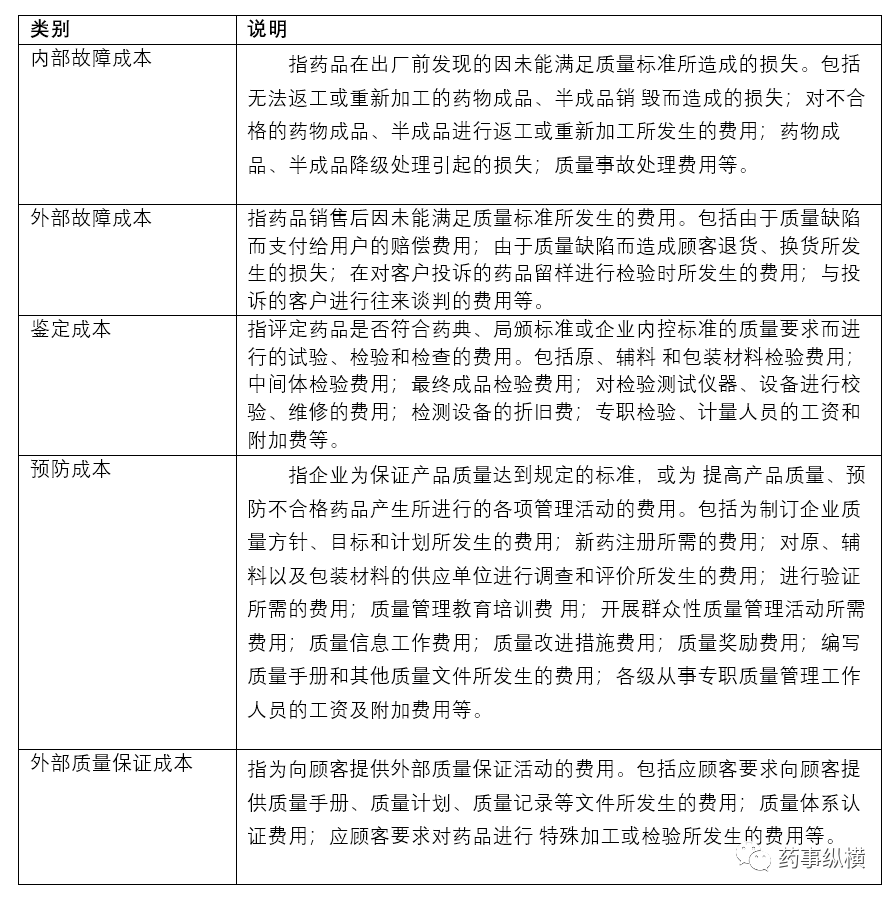
First, we simplify the quality costs of drugs into the following five categories:
This article mainly considers how to balance the first two types of quality costs mentioned above, namely internal failure costs and external failure costs. The specific content includes: first, constructing a collaborative value model for the above two costs; secondly, building a prediction model for non-conforming drugs based on the Xgboost algorithm; finally, outputting the cost control strategy that optimizes total costs based on the above two models.
1. Collaborative Value Model of Internal and External Failure Costs
Typically, in the quality inspection stage before a drug leaves the factory, if a batch of drugs is determined to be non-conforming, that batch will not be allowed to enter the sales phase; conversely, if the sample is judged to be conforming, that batch will be allowed to enter the sales phase.
The possible outcomes of the above two judgments can be categorized into four types:
1) Hit: Judging a batch of drugs as non-conforming and being correct; at this point, internal failure cost b will be incurred. From the quality inspection perspective, this cost is worthwhile as it avoids incurring external failure cost a.
2) Misjudgment: Judging a batch of drugs as non-conforming but being incorrect; at this point, internal failure cost b will also be incurred. From the quality inspection perspective, this cost is not worthwhile as it treats conforming drugs as non-conforming, wasting human and material resources in the production stage.
3) Missed judgment: Judging a batch of drugs as conforming but being incorrect; at this point, no internal failure cost b needs to be incurred. However, it allows non-conforming products to enter the sales phase, resulting in external failure cost a, which is usually a >> b, causing significant losses to the enterprise.
4) Pass: Judging a batch of drugs as conforming and being correct; at this point, neither internal failure cost b nor external failure cost a needs to be incurred.
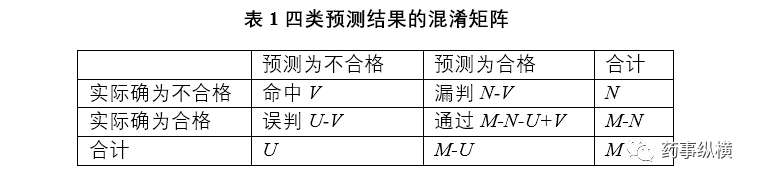
Let M be the total number of batches of a certain drug, with N being the number of actual non-conforming batches; let U be the number of batches judged as non-conforming in the quality inspection stage, with V being the number of hits. It is easy to calculate: the number of misjudgments should be U-V, the number of missed judgments should be N-V, and the number of wasted judgments should be M-N-U+V. The numerical relationships of the four types of predictive results are shown in Table 1.
This article does not intend to start from lean production or process optimization; rather, it attempts to introduce data mining and machine algorithms into drug inspection work in this era of emerging advanced algorithms, establishing a predictive model that may serve as a glimpse into the broader picture and ignite further discussion.
First, we simplify the quality costs of drugs into the following five categories:
This article mainly considers how to balance the first two types of quality costs mentioned above, namely internal failure costs and external failure costs. The specific content includes: first, constructing a collaborative value model for the above two costs; secondly, building a prediction model for non-conforming drugs based on the Xgboost algorithm; finally, outputting the cost control strategy that optimizes total costs based on the above two models.
1. Collaborative Value Model of Internal and External Failure Costs
Typically, in the quality inspection stage before a drug leaves the factory, if a batch of drugs is determined to be non-conforming, that batch will not be allowed to enter the sales phase; conversely, if the sample is judged to be conforming, that batch will be allowed to enter the sales phase.
The possible outcomes of the above two judgments can be categorized into four types:
1) Hit: Judging a batch of drugs as non-conforming and being correct; at this point, internal failure cost b will be incurred. From the quality inspection perspective, this cost is worthwhile as it avoids incurring external failure cost a.
2) Misjudgment: Judging a batch of drugs as non-conforming but being incorrect; at this point, internal failure cost b will also be incurred. From the quality inspection perspective, this cost is not worthwhile as it treats conforming drugs as non-conforming, wasting human and material resources in the production stage.
3) Missed judgment: Judging a batch of drugs as conforming but being incorrect; at this point, no internal failure cost b needs to be incurred. However, it allows non-conforming products to enter the sales phase, resulting in external failure cost a, which is usually a >> b, causing significant losses to the enterprise.
4) Pass: Judging a batch of drugs as conforming and being correct; at this point, neither internal failure cost b nor external failure cost a needs to be incurred.
Let M be the total number of batches of a certain drug, with N being the number of actual non-conforming batches; let U be the number of batches judged as non-conforming in the quality inspection stage, with V being the number of hits. It is easy to calculate: the number of misjudgments should be U-V, the number of missed judgments should be N-V, and the number of wasted judgments should be M-N-U+V. The numerical relationships of the four types of predictive results are shown in Table 1.
 Clearly, among the above four outcomes, “Pass” incurs no costs, thus it need not be considered; “Hit” is caused by the production stage producing non-conforming products, which cannot be eliminated through the quality inspection stage and can only be resolved by improving production quality in the production stage; while the internal failure cost brought by “Misjudgment” and the external failure cost brought by “Missed judgment” should theoretically be completely eliminated by adjusting the quality inspection strategy (quality inspection model). In practice, the goal should be to find the minimum sum of the two quality costs under certain constraints, i.e., the optimal solution.
When a certain quality inspection strategy f is deployed in the quality inspection stage, the sum of the two quality costs can be expressed as:
If the quality inspection strategy is the “ideal strategy”, meaning all judgments are correct with no “Missed judgments” or “Misjudgments”, the sum of the two quality costs can be expressed as:
The cost ratio of strategy f is defined as:
2. Data Sources and Modeling Preparation
Data Source: Production, quality inspection, and sales data of a certain best-selling drug from a pharmaceutical company from January 2017 to December 2019. For modeling convenience, approximately 10,000 batches of drugs produced from different production lines were extracted, of which 5% were actual non-conforming batches (this is the result after resampling the samples). These 10,000 batches of drugs were randomly sampled and divided into training and testing sets in a 4:1 ratio.
Each batch of drugs has about 60 attribute variables. If all are used for modeling, on one hand, modeling time will be long; on the other hand, some interfering fields will reduce model accuracy. Therefore, data preprocessing and feature engineering are necessary, specifically including:
1) Checking for duplicate data: Conducting data checks on overall key indicators and deleting duplicate data.
2) Outlier data: Outliers are reflected in the data as extreme values, i.e., deviating significantly from most normal values, identified and deleted through the histogram or scatter plot of variables.
3) Severely missing features: For missing data, evaluate the difficulty and value of supplementation, identify and delete severely missing feature rows.
4) String re-encoding: For example, “production address”, “raw material supplier”, etc., automatically re-encode strings into numerical variables in advance.
5) After correlation analysis, delete about 20 features poorly correlated with product conformity.
6) Derive new features based on the 10 features with higher correlation.
3. Quality Inspection Modeling Based on Xgboost Algorithm
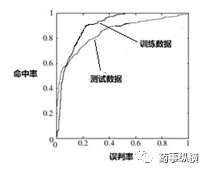
The training dataset consists of 10,000 batches of drug data, with non-conforming batches marked as positive samples and conforming batches marked as negative samples. Using the Xgboost algorithm in a Python environment, a binary classification model for “whether a product is non-conforming” was constructed. After applying the model to both the training and testing datasets, the ROC (receiver operating characteristic curve) is shown in Figure 1, with AUC (area under curve) values of 0.823 and 0.726 respectively.
Clearly, among the above four outcomes, “Pass” incurs no costs, thus it need not be considered; “Hit” is caused by the production stage producing non-conforming products, which cannot be eliminated through the quality inspection stage and can only be resolved by improving production quality in the production stage; while the internal failure cost brought by “Misjudgment” and the external failure cost brought by “Missed judgment” should theoretically be completely eliminated by adjusting the quality inspection strategy (quality inspection model). In practice, the goal should be to find the minimum sum of the two quality costs under certain constraints, i.e., the optimal solution.
When a certain quality inspection strategy f is deployed in the quality inspection stage, the sum of the two quality costs can be expressed as:
If the quality inspection strategy is the “ideal strategy”, meaning all judgments are correct with no “Missed judgments” or “Misjudgments”, the sum of the two quality costs can be expressed as:
The cost ratio of strategy f is defined as:
2. Data Sources and Modeling Preparation
Data Source: Production, quality inspection, and sales data of a certain best-selling drug from a pharmaceutical company from January 2017 to December 2019. For modeling convenience, approximately 10,000 batches of drugs produced from different production lines were extracted, of which 5% were actual non-conforming batches (this is the result after resampling the samples). These 10,000 batches of drugs were randomly sampled and divided into training and testing sets in a 4:1 ratio.
Each batch of drugs has about 60 attribute variables. If all are used for modeling, on one hand, modeling time will be long; on the other hand, some interfering fields will reduce model accuracy. Therefore, data preprocessing and feature engineering are necessary, specifically including:
1) Checking for duplicate data: Conducting data checks on overall key indicators and deleting duplicate data.
2) Outlier data: Outliers are reflected in the data as extreme values, i.e., deviating significantly from most normal values, identified and deleted through the histogram or scatter plot of variables.
3) Severely missing features: For missing data, evaluate the difficulty and value of supplementation, identify and delete severely missing feature rows.
4) String re-encoding: For example, “production address”, “raw material supplier”, etc., automatically re-encode strings into numerical variables in advance.
5) After correlation analysis, delete about 20 features poorly correlated with product conformity.
6) Derive new features based on the 10 features with higher correlation.
3. Quality Inspection Modeling Based on Xgboost Algorithm
The training dataset consists of 10,000 batches of drug data, with non-conforming batches marked as positive samples and conforming batches marked as negative samples. Using the Xgboost algorithm in a Python environment, a binary classification model for “whether a product is non-conforming” was constructed. After applying the model to both the training and testing datasets, the ROC (receiver operating characteristic curve) is shown in Figure 1, with AUC (area under curve) values of 0.823 and 0.726 respectively.
Fig. 1 ROC Curves
The hit rate in the figure represents the proportion of all non-conforming batches correctly predicted by the model, calculated as follows:
The misjudgment rate in the figure represents the proportion of all conforming batches incorrectly predicted as non-conforming, calculated as follows:
4. Optimal Quality Inspection Strategy for Minimum Total Cost
By substituting the ROC curve of the testing data into equation (3) and iterating, the minimum value of the quality inspection strategy cost ratio η can be obtained, with the parameter selection and final results for ηmax shown in Table 2.

Table 2 indicates that from a post-analysis perspective, if the quality inspection strategy based on the Xgboost model had been adopted initially, the total quality cost (internal failure cost + external failure cost) would only be 1.489 times the ideal cost, which is far less than the cost ratio of the actual quality cost in the same period of the enterprise’s history.
This article constructed a binary classification prediction model for “whether a product is non-conforming” based on the Xgboost algorithm and training dataset. After parameter tuning, the output quality inspection strategy achieved an effect of η=148.9% in the testing dataset, which is significantly lower than the cost ratio of the actual quality cost in the same period of the enterprise’s history.
Therefore, introducing data mining and machine learning algorithms into future drug quality inspection work to construct a predictive model for non-conforming products and output the optimal quality inspection strategy based on this model may yield innovative results.
Submission Guidelines for Pharmaceutical Affairs: Increased Manuscript Fees, Welcome to Submit
Hello friends, if you find this article helpful, please click the “View” button below so that your friends can see it too.