
Abstract: In recent years, cognitive load overload has become an important factor affecting the effectiveness of online learning. To address this issue, the article focuses on the assessment of cognitive load in online learning, first designing a research framework for online learning cognitive load assessment based on multimodal data, which includes three parts: multimodal data collection, multimodal feature extraction, and evaluation model construction. Next, through experiments, the article collects multimodal data of learners in a specific online learning environment, extracting facial expression features, eye-tracking indicators, and EEG signal features to construct an online learning cognitive load assessment model. Subsequently, the accuracy of the evaluation model is verified, finding that among five machine learning algorithm models, the KNN model has the best overall performance, thus selecting this model as the final online learning cognitive assessment model; at the same time, the article analyzes multimodal data and finds that multimodal fusion methods have superiority in cognitive load assessment. The assessment model constructed in this article can empower online learning platforms to achieve real-time assessment of cognitive load, thereby enabling personalized learning based on cognitive load, enhancing learning motivation, improving learning outcomes, and promoting the quality of online education.
Keywords: Multimodal data; Online learning; Cognitive load; Facial expression; Eye tracking; EEG signal
// Introduction
Since the 21st century, with the rapid development of the internet, multimedia, and other technologies, online learning has gradually become popular. Generally speaking, online learning can be divided into two forms: synchronous live classrooms and asynchronous video learning[1]. This study focuses on asynchronous online learning environments, so the “online learning” mentioned below refers to asynchronous online learning based on multimedia resources.
When a person is in a learning or task situation, if the consumption of cognitive resources in the brain exceeds their cognitive capacity, cognitive load will occur[2]. Online learning can break through time and space limitations, offering high flexibility[3], and allows access to a wealth of information and resources via the internet—though this provides strong support for learners to engage in personalized learning, it also brings challenges in filtering and processing resources and information; at the same time, online learning lacks teacher supervision, requiring learners to manage their time independently and effectively, making online learning challenging and leading to cognitive load overload, which in turn affects learning outcomes and experiences[4].
Both excessive and insufficient cognitive load can affect learners’ final learning outcomes, so assessing cognitive load during the learning process is crucial—it can not only help teachers understand learners’ learning states but also optimize the implementation of teaching activities, improve learning outcomes, and has significant practical implications[5]. However, traditional assessment methods are not suitable for online learning due to their subjectivity and retrospective evaluation nature. With the development of technology, methods for building assessment models based on various objective data have begun to emerge, and the complementary information between various modal data means that multimodal assessment models perform better than unimodal assessment models. Based on this, this study attempts to design a research framework for online learning cognitive load assessment based on multimodal data and build an assessment model based on this framework, aiming to provide a new feasible method for cognitive load assessment in online learning environments.
// 1 Related Research
1 Cognitive Load Assessment
Research on cognitive load assessment originated in the 20th century, primarily using scales for assessment—these scales are applied based on the premise that individuals can rate their cognitive resource consumption during cognitive processes, and this consumption is related to task difficulty, mental effort, time pressure, and other factors[6]. Common scales include the CH (Cooper-Harper) scale[7], WP (the Workload Profile Index Ratings) scale[8], and NASA-TLX (National Aeronautics and Space Administration-Task Load Index) scale[9]. Among them, the CH scale requires subjects to directly score their overall self-perceived cognitive load, with higher scores indicating higher cognitive load; the WP and NASA-TLX scales evaluate cognitive load indirectly from multiple dimensions, calculating cognitive load based on the weighted contributions of different dimensions. Although these scales have been widely used, they are all retrospective subjective evaluation methods, requiring learners to recall and self-report their cognitive load after completing learning tasks, making results from such subjective evaluation methods susceptible to environmental and subjective attitude influences[10], and they cannot provide real-time assessments, thus not suitable for online learning environments. Therefore, this study opts to combine cognitive load assessment scales with sensor technology[11] to effectively enhance the accuracy and validity of cognitive load assessments.
2 Multimodal Data-Based Cognitive Load Assessment
In the field of cognitive load assessment research, with the maturity of various sensor technologies and the reduction of application costs, more and more researchers are attempting to use multimodal data to assess cognitive load. Compared to unimodal data, multimodal data-based assessment methods have higher robustness and noise resistance[12]. Currently, modalities such as facial expressions, eye tracking, and EEG signals have been used for cognitive load assessment, and due to the complementary information that can be achieved between different modalities, more accurate assessment results can be obtained[13]. For example, Trisitichoke et al.[14] found that facial expressions are highly correlated with perceived comprehensibility, indicating that facial expressions can be used to assess cognitive load related to language comprehension. Eye tracking technology can assess cognitive load by collecting gaze, saccade, and pupil dilation data during the learning process. For instance, Xue Yaofeng et al.[15] combined metrics such as fixation duration, number of fixation points, and pupil diameter to construct a quantitative model of online learning cognitive load based on eye tracking technology, and experimentally validated the feasibility and accuracy of the model. Cognitive load is closely related to the brain, and EEG signals have a high degree of synchronization with cognitive load[16], so using EEG signals to assess cognitive load has also become a common research approach. For example, Zhao et al.[17] evaluated the cognitive load of drone operators by extracting power spectral density features from different frequency bands of EEG signals. Based on the above research findings, this study chooses to apply multimodal data consisting of facial expressions, eye tracking, and EEG signals to assess cognitive load in online learning.
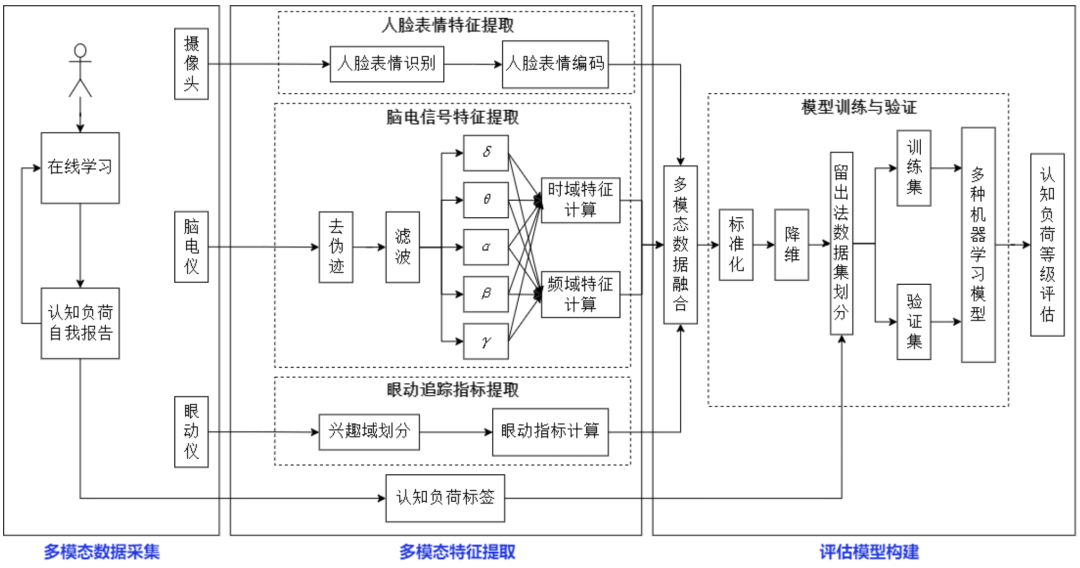
Figure 1 Research Framework for Online Learning Cognitive Load Assessment Based on Multimodal Data
// 2 Research Framework Design
Referring to related application studies of multimodal data[18][19][20], and drawing on experiences in experimental design and data processing, this study designs a research framework for online learning cognitive load assessment based on multimodal data. This framework includes three parts: multimodal data collection, multimodal feature extraction, and evaluation model construction, as shown in Figure 1.
1 Multimodal Data Collection
This study uses cameras, EEG devices, and eye trackers to collect multimodal data from learners during the learning process. Each time a learner completes a stage of the learning task, they self-report their cognitive load using the “Paas Cognitive Load Scale”[21]. This scale is simple to use and has high reliability and validity[22], and its results will serve as labels combined with multimodal data to form a dataset for the construction of the evaluation model.
2 Multimodal Feature Extraction
(1) Facial Expression Feature Extraction
Facial expressions contain rich emotional information. Analyzing a person’s emotions helps to explore the relationship between emotions, learning motivation, learning styles, and cognition, and reveals the impact of emotions on learning outcomes[23]. Based on the emotional theories proposed by Boucher et al.[24] and Plutchik et al.[25], this study categorizes learners’ emotions in the online learning environment into six types: happy, surprised, neutral, focused, confused, and annoyed. Subsequently, researchers record learners’ faces in real time using cameras during the learning process and apply facial expression recognition technology to classify and code learners’ real-time emotions, completing the extraction of facial expression features.
(2) Eye Tracking Metric Extraction
Eye movement data can quantify learners’ attention distribution and cognitive processes, aiding in the understanding of human learning behavior and cognitive patterns[26]. Based on this, researchers first use eye trackers to record learners’ eye movement tracking data and categorize different interest areas, such as text, images, etc., based on the layout of learning materials. Researchers then calculate eye tracking metrics within different interest areas to obtain learners’ attention allocation on different elements. The eye tracking metrics recorded in this study mainly include: the number of fixation points across the entire screen, fixation duration, average diameter of the left pupil, standard deviation of the left pupil diameter, average diameter of the right pupil, and standard deviation of the right pupil diameter.
(3) EEG Signal Feature Extraction
EEG signals, also known as electroencephalograms, are a method of collecting and recording brain activity by placing several electrodes on the scalp[27]. EEG signals can be filtered and decomposed into five different frequency bands: Delta waves (0.5–4Hz), Theta waves (4–7Hz), Alpha waves (8–12Hz), Beta waves (13–30Hz), and Gamma waves (>30Hz)[28]. Among these, Delta waves are more active when a person is in deep sleep, Theta waves often occur during dreaming, fatigue, deep relaxation, or meditation, Alpha waves typically appear when a person is awake and relatively relaxed, Beta waves are more active when a person focuses attention, and Gamma waves appear during high-level cognitive activities.
EEG signals obtained from EEG devices often contain artifacts such as ECG, EMG, EOG, and power line interference[29], thus requiring preprocessing. Researchers first use notch filtering to remove 50Hz power line interference, and then apply a bandpass filter of 0.1–50Hz to eliminate low-frequency ECG artifacts and high-frequency EMG artifacts, followed by independent component analysis to remove EOG artifacts.
For the preprocessed EEG signals Xall, researchers use different bandpass filters to decompose them into Delta, Theta, Alpha, Beta, and Gamma frequency bands, denoted as Xb, extracting their time-domain and frequency-domain features[30]. Time-domain features are statistical characteristics calculated for EEG signals, mainly including mean, standard deviation, maximum, minimum, mean of absolute first differences, and mean of absolute second differences, with relevant calculation formulas shown in Table 1. Frequency-domain features involve using the Welch method to convert original time-series information into frequency-domain information[31], mainly including absolute power spectral density and relative power spectral density, with relevant calculation formulas shown in Table 2.
Table 1 Time-Domain Feature Calculation Formulas
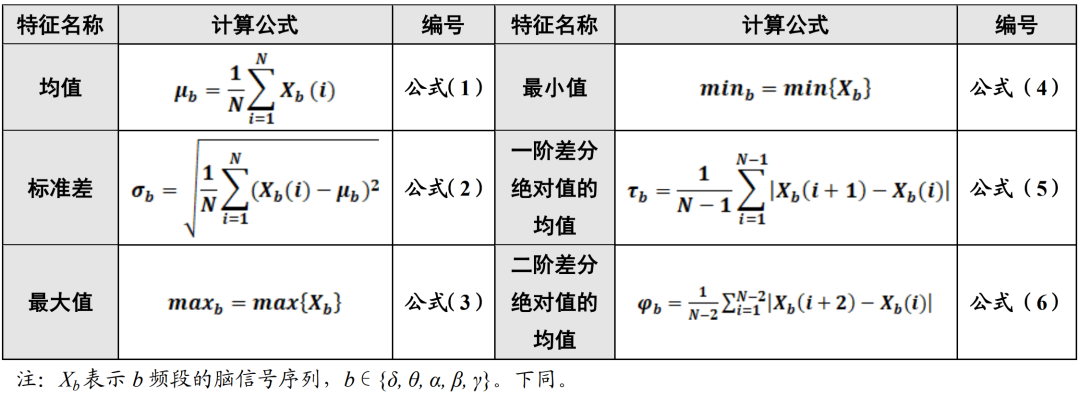
Table 2 Frequency-Domain Feature Calculation Formulas

3 Model Construction
(1) Multimodal Data Fusion
There are three main strategies for multimodal data fusion: data-level fusion, feature-level fusion, and decision-level fusion[32]. Among them, data-level fusion involves merging raw data from different sources into a single dataset for analysis, modeling, and decision-making; feature-level fusion involves first extracting data features from different modalities, then concatenating these features into a complete feature vector for model construction; decision-level fusion involves establishing sub-models for each modality and making decisions based on the outputs of each sub-model. Considering that feature-level fusion can retain information from the original data as much as possible and that different modalities can achieve sufficient information complementarity, this study chooses to adopt a feature-level fusion strategy for the construction of the evaluation model.
(2) Model Training and Validation
Holdout method is a common model validation method, which involves dividing the dataset into training and validation sets, using the training set to train the evaluation model to adjust parameters, and using the validation set to assess the model’s generalization ability. This study uses learners’ self-reported cognitive load as labels, combined with multimodal data to form a dataset, and employs the holdout method to divide the dataset: 70% of the data is used for model training, and the remaining 30% for model validation. Before applying the holdout method for data division, preprocessing of multimodal data is required, including normalization and principal component analysis for dimensionality reduction, to unify the scale of the data and reduce its complexity. The construction of the evaluation model selects multiple machine learning algorithms and determines the optimal model based on cognitive load level assessment results.
//3 Experiment Design
1 Experimental Subjects
This study takes undergraduate students majoring in education at H University in East China as research subjects. However, the experimental subjects are required to have uncorrected or corrected vision of 1.0 to ensure normal collection of eye tracking data; moreover, all participants must have sufficient rest and relaxation before participating in the experiment, avoiding excessive tension, fatigue, or other negative states to ensure successful collection of EEG signals during the experiment. Ultimately, a total of 288 subjects participated in this experiment.
2 Experimental Materials and Tools
This study uses the “University English Vocabulary Analysis” course on the MOOC platform as experimental material. After completing each video learning segment, subjects need to self-report their cognitive load using the “Paas Cognitive Load Scale.” This study designs two questions based on the two dimensions of this scale (i.e., task difficulty and mental effort): ① How do you perceive the difficulty of the words just learned? ② How much effort did you exert to remember and understand the words just learned?
3 Experimental Environment
The experimental equipment for this study includes a Lenovo laptop, a Tobii T120 eye tracker, a camera, and a 16-channel EEG device developed based on the OpenBCI biosensor kit. The eye tracker serves as an external display, collecting eye movement data while presenting experimental materials. The experiment is conducted in a comfortable and quiet environment to ensure that subjects are not disturbed.
4 Experimental Preparation
① Data Collection: While subjects are learning the “University English Vocabulary Analysis” course, the camera records and saves their facial expressions, the eye tracker continuously records their eye movement data, the EEG device collects their EEG signals, and the Paas cognitive load scale is used to record subjects’ cognitive load after completing each video learning segment.
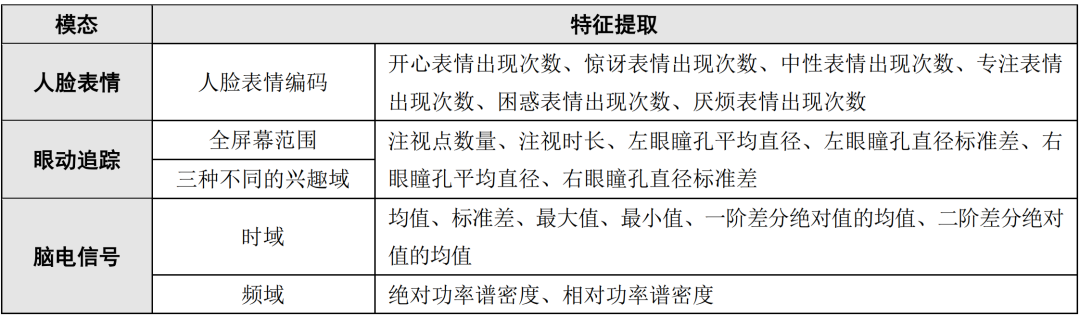
② Feature Extraction: This includes using facial expression recognition technology to identify subjects’ facial expressions and count the occurrences of each expression; calculating eye tracking metrics in the entire screen area and three different interest areas; and decomposing EEG signals into five different frequency bands to calculate time-domain and frequency-domain features for each band, with results shown in Table 3. The three different interest areas are based on the layout design of each element in the learning materials, which are the image area, the spelling, phonetics, and part-of-speech area, and the definition and example sentence area, so each interest area needs to calculate the corresponding six eye tracking metrics separately. The overall features obtained from the original data of the three modalities after feature extraction will be used for subsequent data analysis and evaluation model construction.
Table 3 Feature Extraction Results of Each Modality Data
③ Model Construction: First, a feature-level fusion strategy is employed to fuse the three modalities of facial expressions, eye tracking, and EEG signals. Next, preprocessing operations such as normalization and dimensionality reduction are performed on the multimodal data. Then, using the holdout method, the multimodal data is divided into training and validation sets in a 7:3 ratio. The training set data is used to calculate model parameters for optimal fitting, while the validation set data is used to verify the effectiveness of the trained model. Finally, five different machine learning algorithms, including Bayesian networks (Bayes), random forests (RF), linear discriminant analysis (LDA), support vector machines (SVM), and K-nearest neighbors (KNN), are used to construct the evaluation model, followed by training and validating each model, and selecting the model with the best performance as the final online learning cognitive load assessment model based on validation results.
// 4 Research Analysis
1 Model Performance Validation
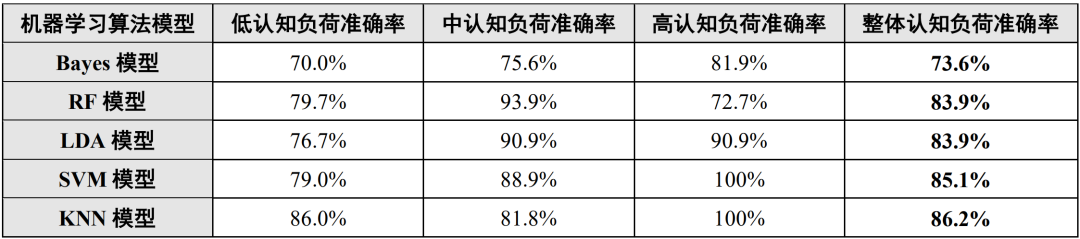
Statistically, this study obtained 172,800 facial expression data points, 345,600 eye tracking data points, and 1,440,000 EEG data points. The three modalities’ data underwent feature extraction to form a feature matrix. At the same time, the original cognitive load was equally divided into low, medium, and high levels based on its value range, serving as cognitive load labels for subsequent data analysis and evaluation model construction. This study compares the assessment accuracy of five machine learning algorithm models on the validation set, with results shown in Table 4. It can be seen that the KNN model has the best overall performance, with an overall cognitive load accuracy of 86.2%, and its accuracy for low, medium, and high cognitive load levels is all above 80%. Therefore, this study selects the KNN model as the final online learning cognitive assessment model.
Table 4 Assessment Accuracy of Five Machine Learning Algorithm Models on the Validation Set
2 Analysis of Each Modality Data
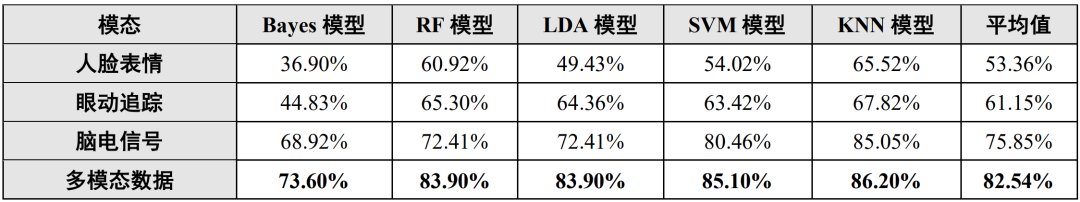
To understand the influence of each modality data on the evaluation results of the five machine learning algorithm models, this study compares the accuracy of different modality data in the five machine learning algorithm models and their averages, with results shown in Table 5. It can be seen that EEG signals have the greatest impact on the evaluation results of the five machine learning algorithm models (with the highest average of 75.85%), followed by eye tracking (with the second highest average of 61.15%), and facial expressions have the least impact (with the lowest average of 53.36%). It can be seen that, compared to facial expressions and eye tracking, EEG signals are more closely related to cognitive load. However, the average of multimodal data is greater than that of any single modality data, thereby verifying the superiority of multimodal fusion methods in cognitive load assessment.
Table 5 Influence of Each Modality Data on the Evaluation Results of Five Machine Learning Algorithm Models
① Analysis of Facial Expression Data: The statistical results of facial expression data in this experiment show that regardless of the level of cognitive load, the most frequently occurring expression is neutral, followed by focused expression, while confused and happy expressions occurred less frequently, and surprised and annoyed expressions did not occur at all, as shown in Figure 2. The reason may be that the learning time for the words was relatively short, and the learning objectives were clear, so there was not much change in the subjects’ facial expressions. Further observation reveals that as cognitive load increases, the subjects exhibit fewer neutral expressions but more focused expressions, and confused expressions also increase with higher cognitive load. This indicates that using emotion recognition can achieve perception of online learners’ emotions and learning states[33]. However, it should be noted that the changes in subjects’ facial expressions in this study were not significant, and some subjects exhibited distractions and lapses in attention; in such cases, facial expressions become a confounding factor in online learning cognitive load assessment, necessitating complementary information from other modality data.
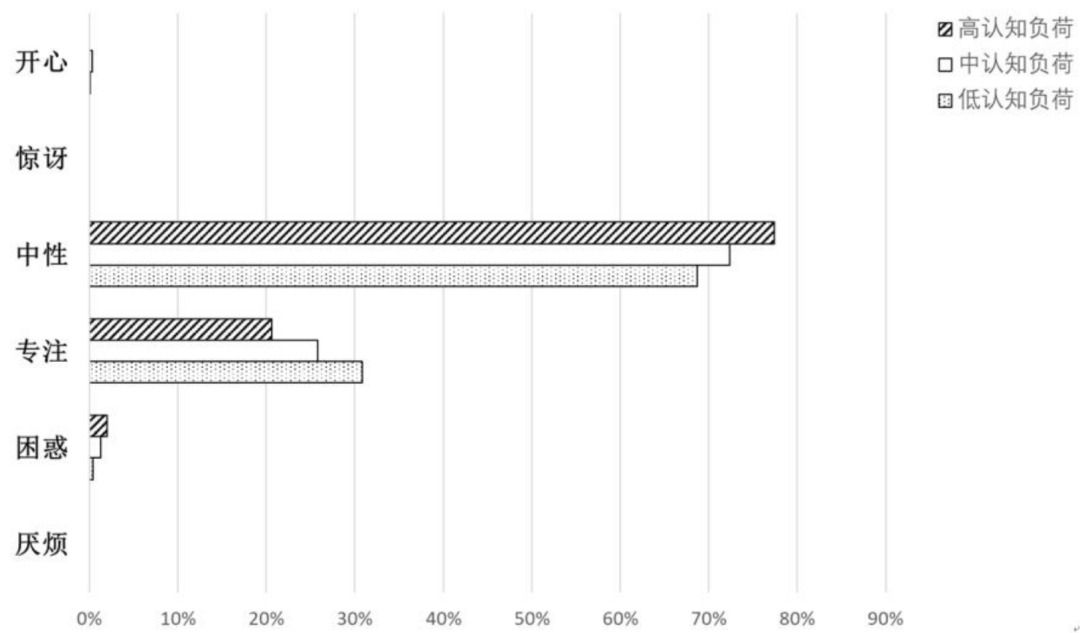
Figure 2 Distribution of Different Facial Expressions Under Different Cognitive Load Levels
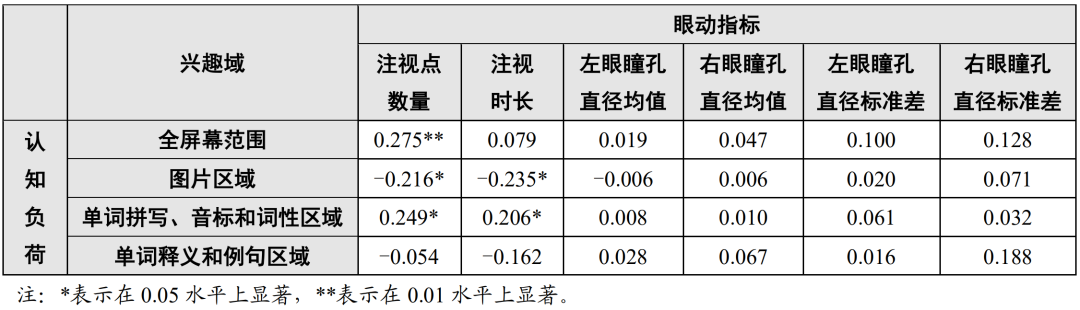
② Analysis of Eye Tracking Metrics: This experiment conducted a correlation analysis between eye tracking metrics in different interest areas and cognitive load, with results shown in Table 6. Among all eye tracking metrics, the number of fixation points and fixation duration have relatively higher correlations with cognitive load, indicating that fixation behavior is more closely related to cognitive load, consistent with the findings of Mutlu-Bayraktar et al.[34]. However, pupil diameter-related metrics have weaker and non-significant correlations with cognitive load, possibly due to the extreme sensitivity and instability of human pupils, which are easily affected by light intensity, physiological responses, and other factors[35]. Additionally, the number of fixation points and fixation duration in the image area are significantly negatively correlated with cognitive load, while those in the spelling, phonetics, and part-of-speech area are significantly positively correlated with cognitive load, indicating that when cognitive load is lower, visual attention is more allocated to the image area, and conversely, more attention is allocated to the spelling, phonetics, and part-of-speech area. Thus, eye tracking metrics can reflect learners’ visual attention allocation and learning effort. Based on this, to avoid cognitive load overload, teachers can design learning resources with helpful images for more difficult learning materials to effectively reduce learners’ cognitive load[36].
Table 6 Correlation Analysis of Eye Tracking Metrics in Different Interest Areas with Cognitive Load
③ Analysis of EEG Signal Data: The statistical results of EEG signal data in this experiment show that the activation patterns of EEG signals vary under different cognitive load levels, as shown in Figure 3. Overall, at the moment the learning materials appear at second 0, the brain begins to be stimulated, and EEG signals respond according to the cognitive activities of the brain. From seconds 4 to 10, regardless of the cognitive load level, the frontal lobe area of the brain exhibits relatively strong EEG signals, while the signals in the temporal, parietal, and occipital lobes are relatively weak. However, as the learning comes to an end, the EEG signals in the frontal lobe gradually weaken, while those in the occipital lobe become relatively stronger, and the comparison becomes more pronounced with higher cognitive load levels. The above analysis results again demonstrate the close relationship between EEG signals and cognitive load, and the EEG signals in the frontal lobe are related to various cognitive activities and working memory[37], so the difficulty of learning materials should consider the management level of cognitive load to alleviate the burden on the brain.
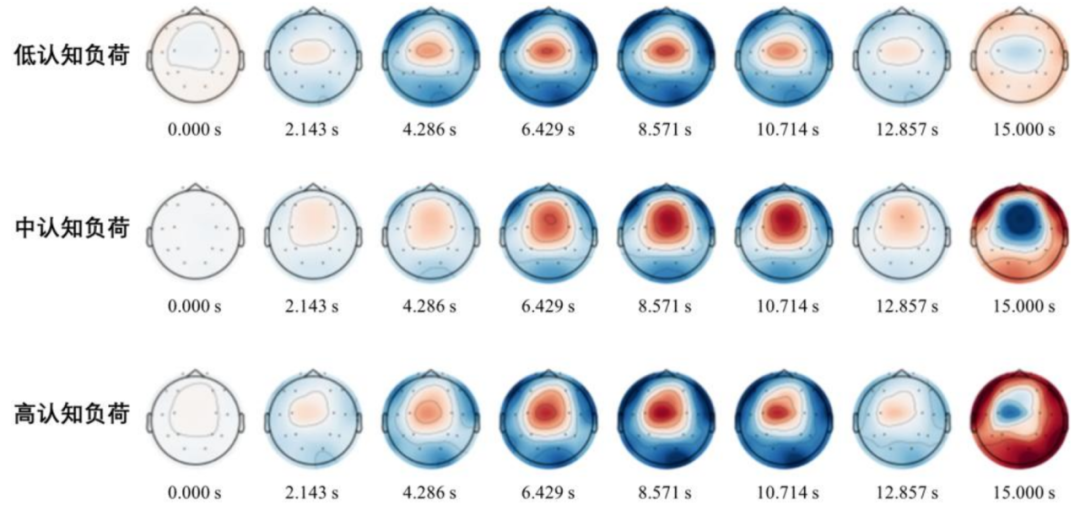
Figure 3 Activation Patterns of EEG Signals Under Different Cognitive Load Levels
//5 Conclusion
This study designed a research framework for online learning cognitive load assessment based on multimodal data and built an assessment model based on facial expressions, eye tracking, and EEG signals. By comparing the assessment accuracy of five machine learning algorithm models on the validation set, this study selects the KNN model with the best overall performance as the final online learning cognitive assessment model. Additionally, this study finds through multimodal data analysis that the assessment model based on multimodal data outperforms any unimodal assessment model, thus proving the superiority of multimodal fusion methods in cognitive load assessment.
The online learning cognitive load assessment model proposed in this study can empower online learning platforms to perform real-time assessments of learners’ cognitive load, thereby automatically adjusting the difficulty of learning materials based on learners’ cognitive load, ensuring that learning content is both challenging and within learners’ learning capabilities, thereby enhancing learning motivation, improving learning outcomes. At the same time, the cognitive load assessment data generated during the online learning process also has certain value for subsequent educational research, helping researchers or teachers understand changes in learners’ cognitive load and serving as a basis for course optimization. Future research will focus on practical applications to enhance the online learning cognitive load assessment model, improving its performance, efficiency, and reducing computational costs; simultaneously, different online learning scenarios and themes will be designed, and the experimental scale will be expanded to enhance the model’s generalization ability and further improve its universality and accuracy.
References
[1] Chen N, Ko H, Kinshuk, et al. A model for synchronous learning using the Internet[J]. Innovations in Education and Teaching International, 2005,(2):181-194.
[2] Sweller J. Cognitive load during problem solving: Effects on learning[J]. Cognitive Science, 1988,(2):257-285.
[3] Wu Fat, Lai Song, Gao Shurui, et al. Joint facial cues and eye movement features for online learning focus recognition[J]. China Educational Technology, 2022,(11):37-44.
[4] Chen C Y, Pedersen S, Murphy K L. Learners’ perceived information overload in online learning via computer-mediated communication[J]. Research in Learning Technology, 2011,(2):101-116.
[5][6][11][22] Wang Guohua, Nie Shengxin, Xue Ruixin. Cognitive load in multimedia learning: A review of measurement methods and technologies[J]. Educational Technology Research, 2022,(4):19-25, 54.
[7] Cooper G. Cognitive load theory as an aid for instructional design[J]. Australasian Journal of Educational Technology, 1990,(2):108-113.
[8] Tsang P S, Velazquez V L. Diagnosticity and multidimensional subjective workload ratings[J]. Ergonomics, 1996,(3):358-381.
[9] Hart S G. NASA-task load index (NASA-TLX): 20 years later[J]. Proceedings of the Human Factors and Ergonomics Society Annual Meeting, 2006,(9):904-908.
[10] Xu Ziming, Niu Yifan, Wen Xuyun, et al. A review of cognitive load assessment based on EEG signals[J]. Aerospace Medicine and Medical Engineering, 2021,(4):339-348.
[12] Debie E, Rojas R F, Fidock J, et al. Multimodal fusion for objective assessment of cognitive workload: A review[J]. IEEE Transactions on Cybernetics, 2019,(3):1542-1555
[13] Wang Yiyan, Zheng Yonghe. Multimodal data fusion: The core driving force to solve key issues in intelligent education[J]. Modern Distance Education Research, 2022,(2):93-102.
[14] Trisitichoke T, Ando S, Saito D, et al. Analysis of native listeners’ facial microexpressions while shadowing non-native speech—Potential of shadowers’ facial expressions for comprehensibility prediction[A]. Interspeech 2019[C]. Austria: International Speech Communication Association, 2019:1861-1865.
[15][20] Xue Yaofeng, Li Zhuowei. Research on quantitative model of online learning cognitive load based on eye tracking technology[J]. Modern Educational Technology, 2019,(7):59-65.
[16] Wang Xiaoming. Three major issues in cognitive load measurement: construct, observation indicators, and interpretation[J]. Global Education Outlook, 2021,(6):50-66.
[17] Zhao Y, Yang X, Wang Y, et al. EEG assessment of driving cognitive distraction caused by central control information[A]. 14th International Conference on Applied Human Factors and Ergonomics (AHFE 2023)[C]. USA: AHFE Open Access, 2023:131-121.
[18] Sun Bo, Liu Yongna, Chen Jiubing, et al. Emotion analysis based on facial expressions in intelligent learning environments[J]. Modern Distance Education Research, 2015,(2):96-103.
[19] Chen Bo, Lu Tianyi, Yu Ling, et al. A precise online testing model based on multimodal data[J]. Modern Educational Technology, 2023,(4):92-100.
[21] Paas F G. Training strategies for attaining transfer of problem-solving skill in statistics: A cognitive-load approach[J]. Journal of Educational Psychology, 1992,(4):429-434.
[23] Yadegaridehkordi E, Noor N F B M, Ayub M N B, et al. Affective computing in education: A systematic review and future research[J]. Computers & Education, 2019,142:103649.
[24] Boucher J D, Ekman P. Facial areas and emotional information[J]. Journal of Communication, 1975,(2):21-29.
[25] Plutchik R, Kellerman H. Theories of emotion[M]. USA: Academic Press, 1980:3-33.
[26] Zhang Qi, Yang Lingyu. Research progress and trends in learning measurement in e-Learning environments—Based on the perspective of eye movement applications[J]. China Educational Technology, 2016,(11):68-73.
[27] Chen Zelong, Xie Kangning. Analysis and classification methods of EEG signals[A]. Proceedings of the China Medical Equipment Conference and 2019 Medical Equipment Exhibition[C]. Beijing: “China Medical Equipment” Magazine, 2019:8.
[28] Zhang B, Chai C, Yin Z, et al. Design and implementation of an EEG-based learning-style recognition mechanism[J]. Brain Sciences, 2021,(5):613.
[29] Zhu Jiajun, Lin Tingyu, Zhang Hengyun, et al. Review of EEG wave analysis and processing[J]. Intelligent Computer and Applications, 2021,(2):123-128.
[30] Liu Weinan, Liu Yan, Tong Baotong, et al. Prediction of epilepsy seizures during sleep based on power spectrum[J]. Journal of Biomedical Engineering, 2018,(3):329-336.
[31] Welch P. The use of fast Fourier transform for the estimation of power spectra: A method based on time averaging over short, modified periodograms[J]. IEEE Transactions on Audio and Electroacoustics, 1967,(2):70-73.
[32] Muszynski M, Tian L, Lai C, et al. Recognizing induced emotions of movie audiences from multimodal Information[J]. IEEE Transactions on Affective Computing, 2021,(1):36-52.
[33] Wang S. Online learning behavior analysis based on image emotion recognition[J]. Traitement Du Signal, 2021,(3):865-873.
[34] Mutlu-Bayraktar D, Ozel P, Altindis F, et al. Relationship between objective and subjective cognitive load measurements in multimedia learning[J]. Interactive Learning Environments, 2023,(3):1322-1334.
[35] Fei X, Zhang Y, Kong D, et al. Quantitative model study of the psychological recovery benefit of landscape environment based on eye movement tracking technology[J]. Sustainability, 2023,(14):11250.
[36] Kaplan-Rakowski R, Lin L, Wojdynski T. Learning vocabulary using 2D pictures is more effective than using immersive 3D stereoscopic pictures[J]. International Journal of Human-Computer Interaction, 2022,(4):299-308.
[37] Garcia-Alvarez L, Gomar J J, Sousa A, et al. Breadth and depth of working memory and executive function compromises in mild cognitive impairment and their relationships to frontal lobe morphometry and functional competence[J]. Alzheimer’s & Dementia: Diagnosis, Assessment & Disease Monitoring, 2019,(1):170-179.
This article is cited from: Xue Yaofeng, Wang Kun, Qiu Yisheng, et al. Cognitive Load Assessment in Online Learning Based on Multimodal Data[J]. Modern Educational Technology, 2024,(3):79-88.