
How to Create Simple BI Reports Directly from CSV Data

Business intelligence applications help enterprises leverage data as a resource for making critical decisions, and we will use AI to build such an application.
AI is set to play an increasingly significant role in BI tools; more specifically, LLM-based applications will enable BI applications to create visualizations, provide insights through data analysis, and automate business reporting.
In this article, we will explore how LLM applications can assist in creating business intelligence. It will not be a comprehensive BI application; however, it will automatically create charts and text reports directly from data.
We will build a program using CrewAI and the OpenAI API to showcase AI’s potential in this field, ultimately forming a simple AI-driven BI application.
I should point out that I am using these specific components because they are convenient—I have become increasingly familiar with CrewAI, which I used in a recent tutorial (if you are not familiar with CrewAI, I recommend reading up on it). CrewAI defaults to using OpenAI, so I chose this as well.
Other LLMs, such as Anthropic’s Claude and Google’s Gemini, are equally effective; while CrewAI is easy to use, other AI agent frameworks that support code execution, such as Autogen or similar frameworks, are also suitable.
Here, I am using CrewAI’s open-source product, which is, of course, free; OpenAI requires an API key, so you must register and will incur usage costs [1].
BI Applications and Data
We will explore two functionalities: creating charts and text reports. Both require an LLM capable of analyzing and understanding data, which should not be a problem for most modern LLMs.
We will create two agents: one for creating charts and another for analyzing data and generating reports.
The data we will use is in CSV format and entirely fictional. It was generated by ChatGPT, involving a company selling unlikely products (from smart TVs to bed frames) across various regions globally.
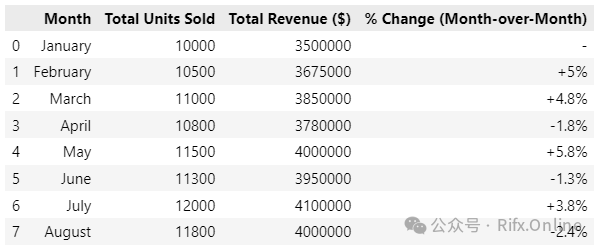
There are three tables in total. The first records monthly sales.
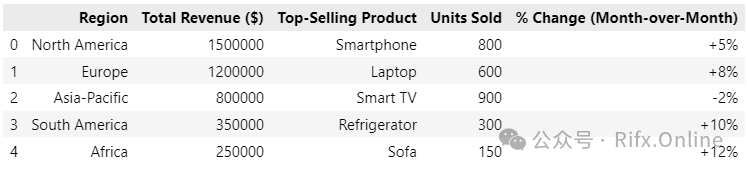
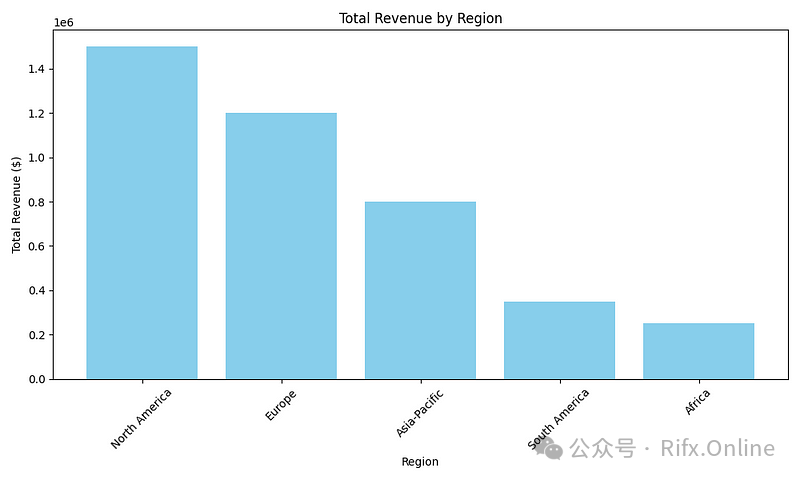
The second shows the sales of best-selling products in each region.
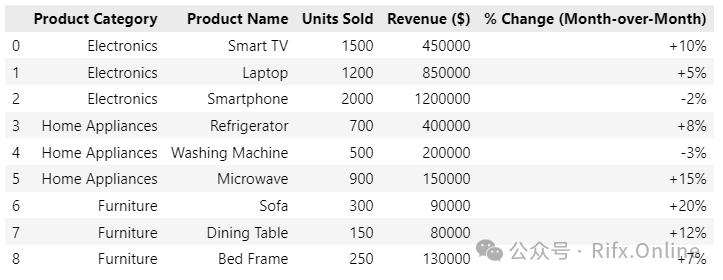
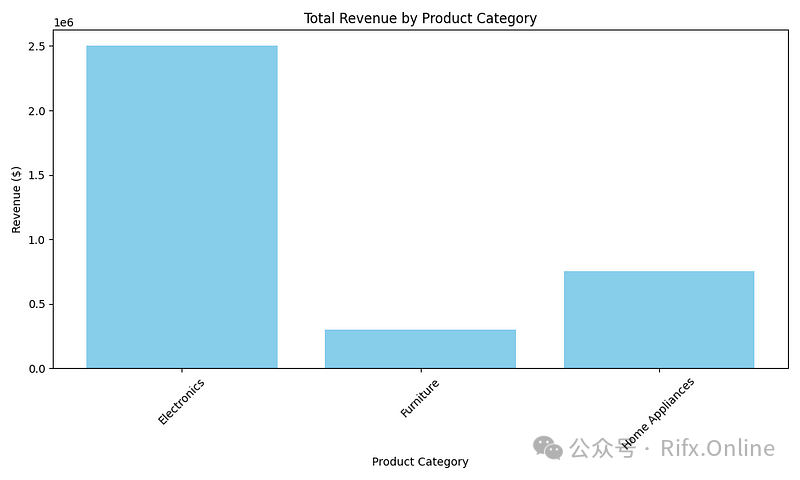
The third details the sales of each product.
Is this a set of realistic data that sales executives might find useful? I will candidly admit I have no idea. I do not own a company or sell anything, so I cannot claim any expertise in this area.
However, I am not sure it really matters. We can use the data provided by ChatGPT to create charts and perform some analysis and reporting, regardless of whether this data is accurate (or even vaguely typical).
So, let’s get started. I am writing these examples using Jupyter Lab, and you can find all the notebooks in my GitHub repository under the AIBI-3 folder.
Charts are always a feature of BI reports, so let’s start with chart generation.
Chart Generator
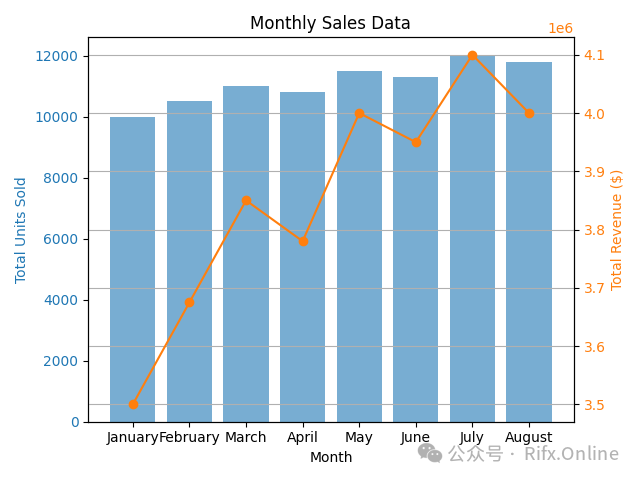
First, we will obtain the CSV file and let the LLM create charts from it. Below is an example—it was generated using Matplotlib.
We will use the LLM to generate code and run it using CrewAI.
Running code generated by the LLM can be unsafe, as the LLM can produce arbitrary code that may not be what we want (it could generate code that might damage the local file system at runtime).
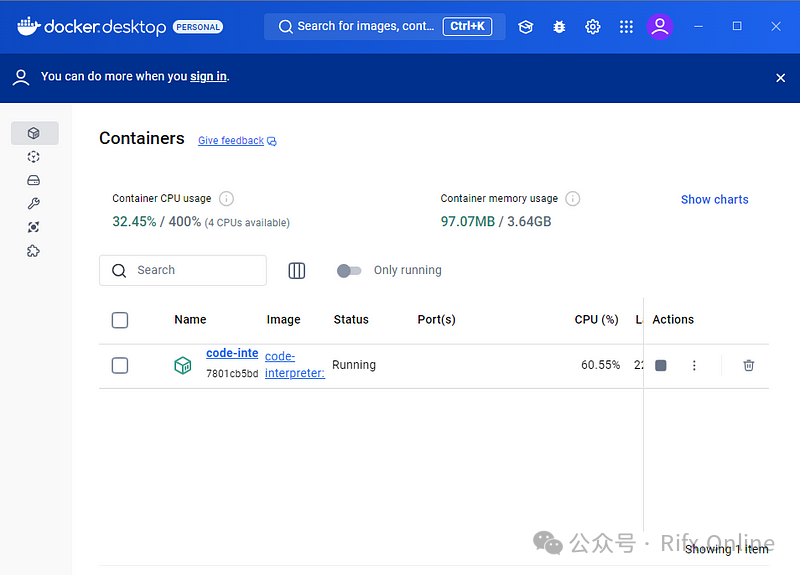
Therefore, it needs to be checked by a human first or run in some sort of sandbox. There are different approaches to this, for example, Autogen lets you choose how to run the code, but CrewAI prioritizes safety, running all code in a Docker container isolated from the local file system.
This means you need to run Docker on your local machine. It’s simple—just visit the Docker website, download the desktop application suitable for your operating system, install and run it. You do not need to create an account or log in—you don’t even need to understand Docker, just let it run, and CrewAI will use it.
We will let the LLM decide what charts it wants to create and see what the results are. I am writing code in separate Jupyter code cells for each code block below; they together form a complete program.
We will use the default OpenAI API [1], which means your API key should be accessible as an environment variable. If it is stored as an environment variable, you need to run the following code block first.
import os
os.environ["OPENAI_API_KEY"] = "your api key"
To begin, you first need to import the necessary libraries and set the LLM model.
from crewai import Agent, Task, Crew
llm = "gpt-4o-mini"
The CrewAI application consists of several elements: agents, tasks, and the crew that runs the tasks and agents. We will see how they are used in the following sections. (For a more detailed introduction to CrewAI, see my article AI Agents vs. AI Pipelines: a Practical Guide to Coding Your LLM Application).
To perform tasks that the LLM cannot complete, we also need to provide tools for the agents—we will see their operation shortly.
The tools we need here allow the LLM to read data files and write charts and reports to the local file system. Therefore, next, we import the tools required by CrewAI to read and write files.
from crewai_tools import FileReadTool, FileWriterTool

file_read_tool = FileReadTool()
file_writer_tool = FileWriterTool()
In the CrewAI application, many tasks are performed by one or more agents. Below, we set up the chart_agent.
## Define Agent

chart_agent = Agent(
        role="Chart Creator",
        goal="""Read the provided data and create a matplotlib chart based on that data.\n                If you receive specific instructions on how to plot the chart, follow them; if not, create a chart that best represents the data""",
        backstory="""Your goal is to read and analyze sales data and create a matplotlib chart""",
        tools=[file_read_tool, file_writer_tool],
        llm=llm,
        allow_code_execution=True
    )
You can see that this is an object instantiated from the CrewAI Agent class. The first three parameters are used to create system prompts—what we expect the agent to do is defined in the goal and backstory parameters. You can also see that we declared the tools that the LLM can use and mentioned the LLM we will use.
We provided instructions to the agent that will give it autonomy in content creation unless specific instructions are given.
Importantly, we set allow_code_execution to True. This implicitly allows the LLM to use its code execution tools and run code in Docker.
I defined the files we want to use in a Python dict—the data files, of course, already exist, and the image files are where we want to save the charts.
files = [
    {
        'data_file_name':'sales_product_cat.csv',
        'chart_file_name': 'sales_product_summary.png',
    },
    {
        'data_file_name': 'monthly_sales.csv',
        'chart_file_name': 'monthly_sales.png',
    },
    {
        'data_file_name': 'sales_by_region.csv',
        'chart_file_name': 'sales_by_region.png',
    }
]
The next step is to create a task that further defines what we want to do. It tells the agent to create a chart for the data file and save it to a local file. We also need to specify the appropriate agents (possibly more than one) and the necessary tools.
Finally, we set up a crew. This defines the list of agents we want to run and the list of tasks (in this case, the list contains only one element). The verbose parameter does what you expect; when set to True, the agent will write all its thoughts to the console. If you don’t want to be overwhelmed by a lot of text, set it to False.
Alright, almost the last step. We certainly need to kick off the crew and collect the results. We would typically use the crew.kickoff() method, but in this case, we have a list of files we want to process, and CrewAI provides us with a useful method to iterate through the list in crew.kickoff_for_each(), as shown below, which requires a list as a parameter.
create_chart = Task(
    description="""Create a chart for {data_file_name} and save it in {chart_file_name}.""",
    expected_output="""A matplotlib chart""",
    agent=chart_agent,
    tools=[file_read_tool, file_writer_tool]
)

## Define Crew
crew = Crew(
    agents=[chart_agent],
    tasks=[create_chart],
    verbose=True
)
result = crew.kickoff_for_each(inputs=files)
Running the crew this way produces a lot of text, which I do not intend to replicate here, but it details the steps the agent is going through. The sequence of events is as follows:
-
• Read the data files using
files_read_tool -
• Send the data to the LLM to analyze and generate code to create a Matplotlib chart
-
• Run the LLM-generated code in Docker
-
• Use
file_writer_toolto write the chart to a PNG file in the local file system.
It will perform this for each data file, and if you open the Docker window, you will see it running the code interpreter images as needed.
Since the code is generated by the LLM, we cannot guarantee that it will produce the same results every time. However, it seems to be quite consistent. Each data file generates an image; the monthly sales data can be seen at the beginning of this section, and the other two images are shown below.

Agent-Generated Reports
Now that we have the charts, let’s proceed to generate a report, which will be the result of the LLM performing some simple analysis and Q&A. This report, along with the previously generated image links, will be merged into a Markdown file, which will be the final report.
We need a new agent, which we will call data_analysis_agent.
We set up the agent in a similar format to before, but of course, the role, goal, and backstory are different this time. Additionally, we have disabled code execution this time, as we do not need it to create the report.
data_analysis_agent = Agent(
        role="Data Analyser",
        goal="""You aim is to read and analyse sales data. You should\n                then write a report on sales performance \n                that includes an executive summary.\n                """,
        backstory="You are assigned to perform sales analysis for a company",
        tools=[file_read_tool, file_writer_tool],
        llm=llm,
        allow_code_execution=False
    )
This time, the task assigned to the agent is, of course, different. The description tells the agent what to do: the first few sentences provide the files it needs (data and charts), followed by a list of questions the LLM should try to answer. It also tells it where to save the report, which should be in Markdown format.
Note that the files are included after the questions; the reason is that, in earlier versions of the program, the LLM seemed to forget the chart files, including them again can solve this issue.
After defining the task, we set up the crew and execute it.
write_report = Task(
    description=f"""The following contains a set of data files and\n                    corresponding charts:\n                        {files}\n                    Write report in Markdown that includes and overview of all\n                    of the sales data and incorporate the corresponding charts.If the information is available, or you can calculate it,\n                    try and answer the following questions: \n                    1. What has been the overall revenue for the latest month?\n                    2. What are the top selling 5 items during the reporting \n                    period?\n                    3. In which regions have there been the most sales and \n                    what items are popular those regions?\n                    4. What sort of growth has there been over the reporting \n                    period?\n                    5. Are there any trends that you can detect?\n                    The overview of the data and the corresponding charts from {files} should be included in an appendix.\n                    \n                    Save the result in the file './report.md'.\n                    """,
    expected_output="""A markdown file""",
    agent=data_analysis_agent,
    tools=[file_read_tool, file_writer_tool]
)
## Define Crew
crew = Crew(
    agents=[data_analysis_agent],
    tasks=[write_report],
    verbose=True
)
result = crew.kickoff()
The generated report is too long to include in the text, so I have attached it at the end of the article. However, the program reasonably attempts to answer the questions and faithfully includes the charts.
The report is relatively short; more complex prompts could lead to more comprehensive content. However, when designing prompts, care must be taken not to provide the LLM with inappropriate hints. For example, I cut and pasted some suggestions from a ChatGPT session that included questions about supply chain issues. Of course, such a question cannot be inferred from the given data, but the LLM fabricated a non-existent supply chain issue to explain the sales decline!
Conclusion and Outlook for More Practical Programs
Creating such a very basic BI report generator is straightforward, but there can be many improvements in chart creation and report writing.
This program is quite generic; it can accept any set of CSV files and try to interpret them and build appropriate charts. We can better tailor it for specific applications by including descriptions of the data files in the files data structure, and we can also add specifications for the charts we want to create—the agent is already prepared to expect this, but we need to make some minor adjustments to incorporate data descriptions. Both measures help ensure more consistent output and better meet our needs.
The report writing prompts can also be more specifically targeted at particular applications and expanded to provide longer reports.
If we were to put this prompt and the files data structure into a separate file, it would allow the program to be adjusted for different applications.
This is just a basic attempt at using AI to generate BI reports, but there is still much room for improvement. Using external files to specify more detailed data file descriptions and explicit chart specifications would allow non-programmers to adjust the program according to their specific needs while maintaining the program’s generality. Of course, Jupyter Notebook is not necessarily the best vessel for an application intended for non-programmers. But I hope this gives you some food for thought.
As always, thank you for reading—I hope this is helpful to you. You can see more articles on my website and subscribe to my occasional newsletter here.
The code and data for this article can be found in the GitHub repository under the AIBI-3 folder. The generated charts and reports are also in the same folder.
Notes and References
-
1. If you run the code here, you will need an OpenAI account and API key. Using this service will incur costs. Running the code here should not exceed a few dimes, but you should always check your spending on the OpenAI dashboard.
-
2. All images and screenshots are provided by me, the author, unless otherwise stated.
-
3. Disclaimer: I have no commercial ties to any companies mentioned in this article.
Appendix — Report
Please note that the rendering of Markdown format in Medium is not perfect, but what you see is very close to what was generated.
Sales Performance Report
Executive Summary
This report analyzes the sales performance of the company during the reporting period, highlighting overall revenue, best-selling products, regional performance, growth trends, and notable observations. The analysis is based on sales data across product categories, monthly sales figures, and regional performance metrics.
Sales Overview
-
1. Overall revenue for the latest month:
-
• August total revenue: $4,000,000
2. Top five selling items:
-
• 1. Smartphone — $1,200,000
-
• 2. Laptop — $850,000
-
• 3. Smart TV — $450,000
-
• 4. Refrigerator — $400,000
-
• 5. Washing Machine — $200,000
3. Regions with the most sales:
-
• North America:
-
• Total Revenue: $1,500,000
-
• Best-selling product: Smartphone (800 units)
-
• Europe:
-
• Total Revenue: $1,200,000
-
• Best-selling product: Laptop (600 units)
-
• Asia-Pacific:
-
• Total Revenue: $800,000
-
• Best-selling product: Smart TV (900 units)
-
• South America:
-
• Total Revenue: $350,000
-
• Best-selling product: Refrigerator (300 units)
-
• Africa:
-
• Total Revenue: $250,000
-
• Best-selling product: Sofa (150 units)
4. Growth during the reporting period:
-
• Overall trends show continuous growth in sales. For example, revenue increased from $4,000,000, indicating a gradual upward trajectory in sales performance.
5. Trends detected:
-
• Sales of electronics are steadily increasing, especially smartphones and laptops.
-
• Seasonality may affect sales, as evidenced by monthly performance fluctuations.
-
• New product categories, particularly in home appliances and furniture, show good growth potential.
Appendix
-
• Product Category Sales Chart:
-
• Monthly Sales Chart:

-
• Regional Sales Chart:

This article was originally published on my website, click here