【Introduction】The traditional visual recognition methods struggle to directly distinguish between NIs (Natural Images) and CG (Computer Generated images). This article proposes an efficient image recognition method based on Convolutional Neural Networks (CNNs). A large number of experiments were conducted to evaluate the model’s performance. The experimental results show that this method outperforms existing recognition methods and, unlike traditional methods using CNN models for image recognition, it can also utilize advanced visualization tools.
▌ Abstract
Considering the limitations of training existing CCNs from scratch or fine-tuning pre-trained networks, this research proposes a more suitable idea: adding two cascaded convolutional layers at the bottom of the CNN model during the design phase. This network can adaptively adjust to different sizes of image inputs while maintaining a fixed depth, stabilizing the CNN structure and achieving good recognition performance. For the proposed model, we adopt a strategy called “local to global,” where the CNN can obtain recognition decisions based on local images, while global recognition decisions can be obtained through simple voting. We conducted numerous experiments to evaluate the model’s performance. The experimental results indicate that this method outperforms existing recognition methods and demonstrates good robustness on post-processed images. Furthermore, compared to traditional methods using CNN models for image recognition, our method can leverage advanced visualization tools to further visualize the differences between NIs and CG.
▌ Introduction
Currently, image recognition research on NIs and CG has received widespread attention. The main challenge in solving this problem lies in the near-identical realism and image patterns of NIs and CG. Previous studies typically involved manually designing distinguishable features to differentiate between NIs and CG. However, a common issue with these methods is that the manually designed features may not be the most suitable for the given image recognition problem, especially for complex databases where recognition performance is poorer.
Unlike traditional methods that require prior knowledge and assumptions, Convolutional Neural Networks (CNNs) can automatically learn the features and their abstract representations from data, making them more widely applicable to complex databases. In this paper, we propose a CNN-based framework to recognize NIs and CG. This framework performs automatic feature learning in an end-to-end manner without the need for manually designed image features. Our work is summarized as follows:
-
We proposed a CNN-based universal recognition framework for NIs and CG, which can adapt to different sizes of image input blocks through fine-tuning.
-
For the fine-tuned CNN model, we designed an improved scheme to enhance our recognition performance, and both CNN-based schemes outperform the current state-of-the-art methods.
-
Our method shows good recognition performance on both Google and PRCG databases, and it exhibits strong robustness against post-processing operations such as resizing images and JPEG compression.
-
Using visualization tools, we further explored how the CNN model distinguishes between NIs and CG.
▌ Dataset
The experimental data we used includes the Columbia Photographic and PRCG databases. The database consists of three groups of images: (1) 800 PRCGs obtained from 40 3D graphics websites; (2) 800 NIs collected by us; and (3) 795 photographic images obtained from Google searches.
We collected 300 NIs using a small digital camera. Previous research methods have not been tested on the Google and PRCG databases because the NIs in Google and the CG images in PRCG originate from different sources. Our study not only attempts to address this issue but will also conduct tests under two different database combinations: Personal and PRCG, as well as Personal+Google and PRCG.
▌ Framework
We view the image recognition problem of NIs and CG as a binary classification problem. For this issue, we propose two different standard frameworks for image recognition, as shown in Figure 1: where f is the feature extractor, and c represents a classifier (such as SVM). Our framework is a two-stage model, with the core being the feature extractor. Typically, the feature extraction process not only requires a significant amount of time but also the extracted features may not necessarily be what we need for our task. Our CNN framework can automatically learn and extract the required features in an end-to-end manner, providing a solution to the feature extraction problem. Therefore, we propose an applicable CNN model and employ the following three different training methods: (1) following existing network structures and training the CNN model from scratch; (2) fine-tuning a pre-trained CNN network that has been trained on other datasets or tasks; (3) designing a new network and training it from scratch.
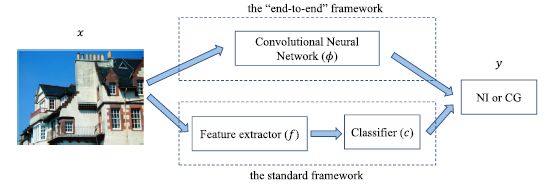
Figure 1 Two Different Image Recognition Frameworks
Local to Global Strategy
Considering the computational cost of the model, the diversity of image sizes, and the performance requirements of image recognition, we adopt a local-to-global strategy to train local images and use a simple voting rule to classify the global images. This local-to-global strategy is based on the idea of data augmentation and is a commonly used technique in training, especially in the field of deep learning.
For the image classification problem, the local strategy (i.e., high precision local images) is crucial for image recognition; on the other hand, images cropped from CG are essentially still CG, and the same applies to NIs. Therefore, we introduce data augmentation methods, meaning that we select a fixed number of images from each training session to enhance the training dataset and obtain higher precision images whenever possible. In the practical phase, we use Maximal Poisson-disk to randomly crop a certain number of images from each training session to construct new training datasets. In the testing phase, we crop a certain number of local images from each test image and label each local image (CG belongs to 0, while NI belongs to 1), with higher numbered labels serving as the predicted result for the image.
Network Structure
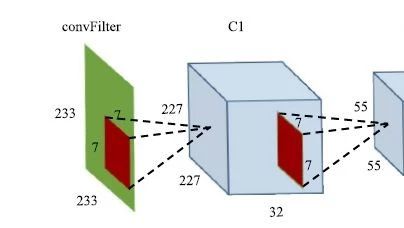
The network structure we adopted consists of ConvFilter layers, 3 groups of convolutional layers, 2 fully connected layers, and 1 softmax classification layer, with the model input being in binary image format. Its structure is shown in Figure 2: our input is an RGB image of size 233*233, represented by a green square; the red square represents the convolution kernel, with numbers nearby indicating the size of the convolution kernel, while the left red square represents a 7*7 convolution kernel; the feature map is illustrated by the shaded rectangular part.
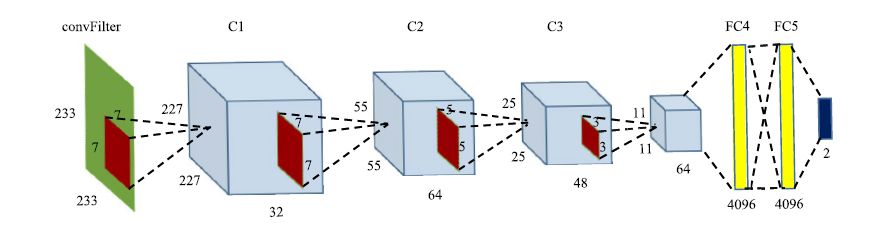
Figure 2 Our Network Structure
▌ Experimental Results
Experimental Setup and Details
We used bicubic interpolation to resize all images, ensuring that the shorter edge of the adjusted images is 512 pixels to maintain consistency in image size. Based on the original dataset, we set the training and testing sets with a separation rate of 3:1, and used MPS to crop 200 images from each training data to meet the needs of the local-to-global strategy and achieve training data augmentation. Similarly, we cropped 30 images from each testing data to serve as the testing set. During training, we used a batch size of 128, with a learning rate set to 0.001, reducing the learning rate by 10 every 30k iterations until completing 90k iterations. Additionally, except for regularization settings of 60×60 and 30×30 image blocks set to 5e-5 and 1e-5 respectively, the default values for other regularization weights were set to 1e-4.
Performance Analysis of Fine-tuned CaffeNet and Convolution Filter Layers
The testing results of the fine-tuned CaffeNet are shown in Table 1. We can see that the testing performance of the fine-tuned network (C-1 to C-7) is superior to that of the network trained from scratch (C-S), which may be due to the beneficial feature learning of the model during the pre-training period with a large number of NIs. Compared to traditional methods (with a maximum accuracy of 80.65%), our network performs better with a higher accuracy after fine-tuning.
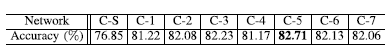
Table 1 Classification Accuracy of the Model, where C indicates CaffeNet, “C-S” indicates the network CaffeNet trained from scratch, and “C-N” indicates the first N layers of CaffeNet after fine-tuning, with N ranging from 1 to 7.
Additionally, we also performed four different configurations for the ConvFilter layer: (1) two cascaded convolution layers; (2) removing the convFilter layer; (3) adding a ReLU activation layer after the convFilter layer; and (4) incorporating a high-pass filter into the convFilter layer. Table 2 shows the model performance corresponding to these four configurations, with the highest accuracy obtained when using two cascaded convolution layers.
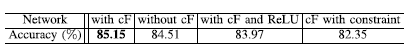
Table 2 Classification Accuracy of convFilter under Four Different Configurations
Classification Performance on Different Size Image Blocks
Figure 3 shows the classification accuracy of our method compared to three manually designed feature methods on different size image blocks. Compared to the other three methods, our method achieves higher accuracy on any image block size, and the classification accuracy of the network decreases as the image block size shrinks.
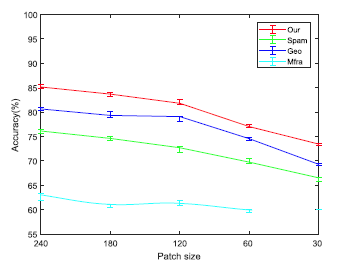
Figure 3 Classification Accuracy of Our Method Compared to Three Manually Designed Feature Methods on Different Size Image Blocks
Robustness Analysis of Post-processing
An effective image recognition algorithm should not only handle raw data but also demonstrate good robustness in post-processed data. In this study, we conducted robustness analysis for two typical post-processing operations: image resizing and JPEG compression. Figure 4 shows the classification accuracy performance of four classification methods under five post-processing conditions (solid line part). It can be seen that our model exhibits stronger robustness for post-processed data.
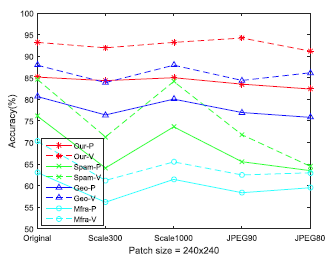
Figure 4 Classification Accuracy Performance of Different Classification Methods on Post-processed Data
Analysis of Local to Global Strategy
Furthermore, we analyzed the classification accuracy performance of the local-to-global strategy on full-sized images. As shown in Table 3, the experimental results indicate that the model accuracy on full-sized images is higher than that on image blocks, and the full-sized classification accuracy obtained through image block voting is superior to the accuracy obtained directly on full-sized images. The voting accuracy’s robustness against post-processing operations is represented by the dashed line in Figure 4.
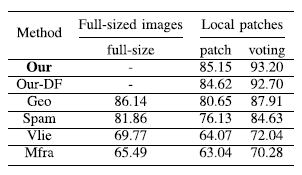
Table 3 Impact of Local to Global Strategy on Classification Accuracy of Six Methods
▌Visualization
In computer vision tasks, there is a common phenomenon where the convolution kernels learned by the model in the first layer resemble Gabor filters and color blobs. We present the convolution visualization results of the model in Figure 5, where (a) shows the Fourier Transform (FFT) results of the first layer convolution kernels of our model, (b) represents the results of the pre-trained CaffeNet, (c) corresponds to the visualization results of the first 96 convolution kernels in CaffeNet, and (d) corresponds to the last 96 results. The filters are grouped according to the three color channels B, G, and R, with brighter pixels indicating higher corresponding B, G, and R values.
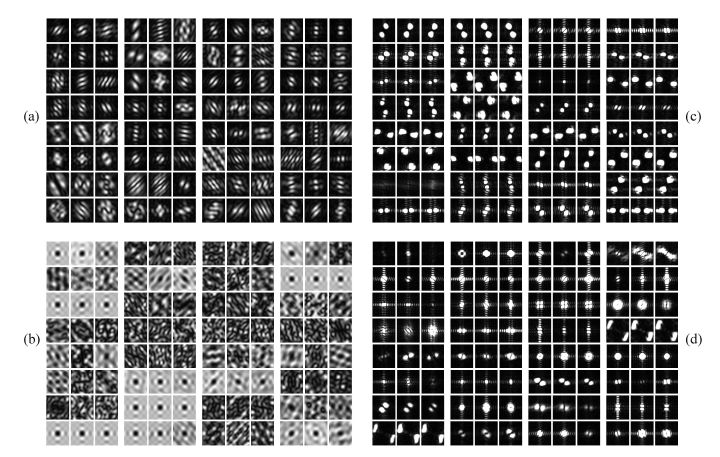
Figure 5 Convolution Visualization Results
▌Conclusion
In this paper, we proposed a universal framework based on CNN to distinguish between natural images (NIs) and computer-generated images (CG), which can be tested not only on the Google and PRCG datasets but also demonstrates good robustness in post-processing. These advantages are highly effective and important for image recognition tasks in real life.
In future work, we will attempt to further improve our model’s performance by introducing a semantic-level CNN ensemble model. Additionally, we will extend our methods and apply them to explore the differences in video data.
For more content, please refer to the paper
https://ieeexplore.ieee.org/document/8355795/
For more information, please scan the QR code below and follow the Machine Learning Research Association

Source: AI Technology Base Camp