Xiao Xiao Yu Yang from Aofeisi
Reported | Quantum Bit
When it comes to computer vision, CNN is indispensable.
But what do convolution, pooling, and Softmax actually look like, and how are they interconnected?
Imagining it from code can be a bit chilling. So, someone simply used Unity to create a complete 3D visualization.
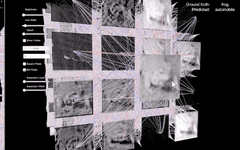
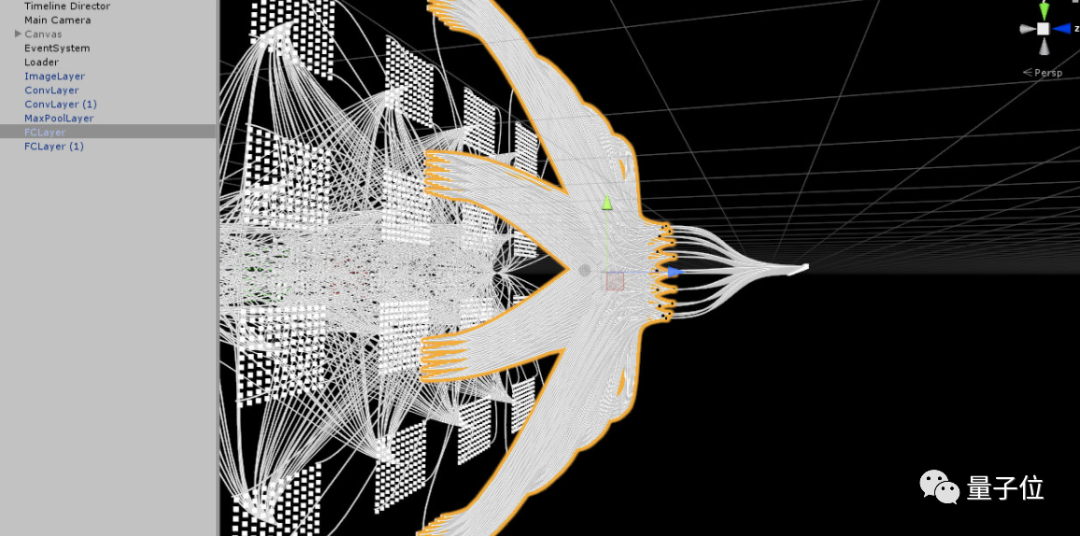
It’s not just a framework; the training process is also presented clearly.
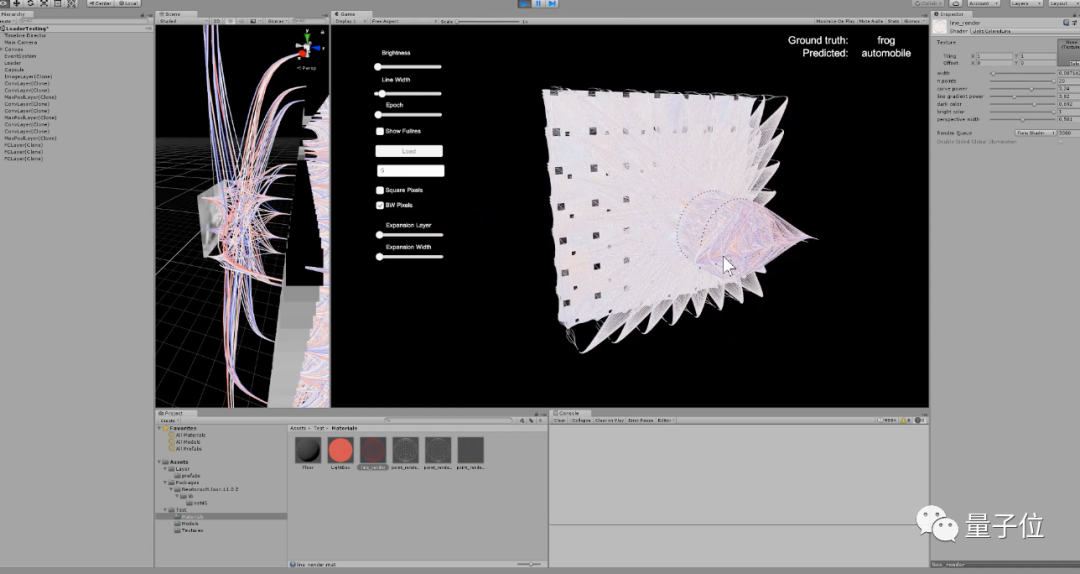
For example, the real-time changes in each layer during the training process vary with the epoch (the number of iterations).
To better showcase the details of the network, users can freely fold and expand each layer.
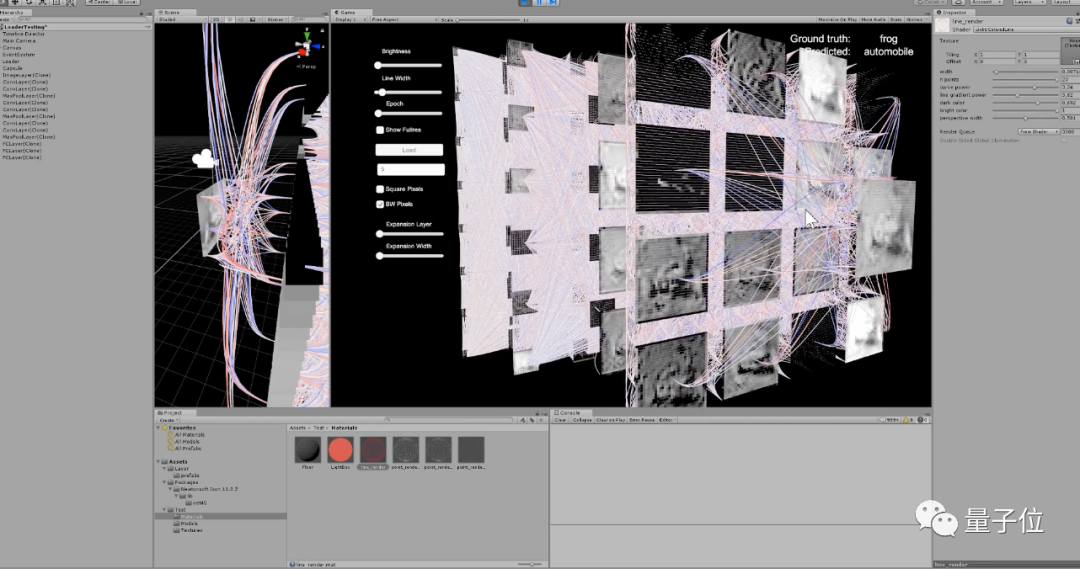
For instance, converting the feature map between linear layout and grid layout.
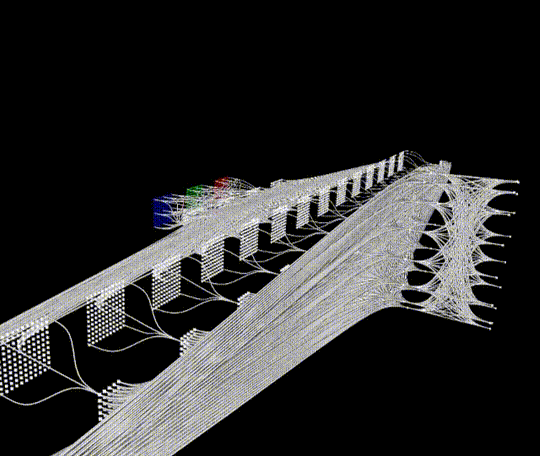
Folding the output of the convolution layer’s feature map.
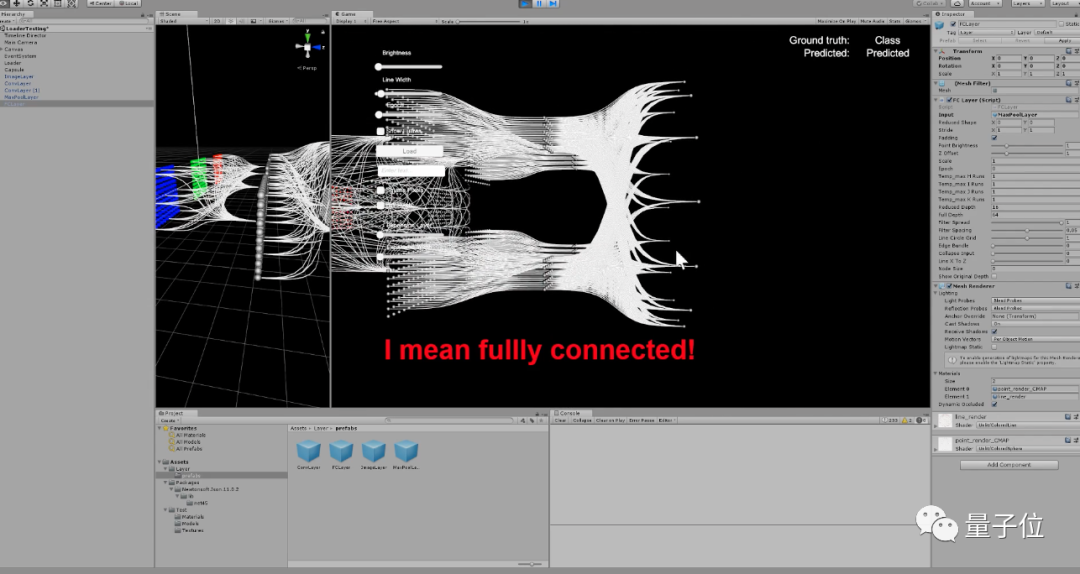
Edge bunding (edge bunding) on the fully connected layer, etc.
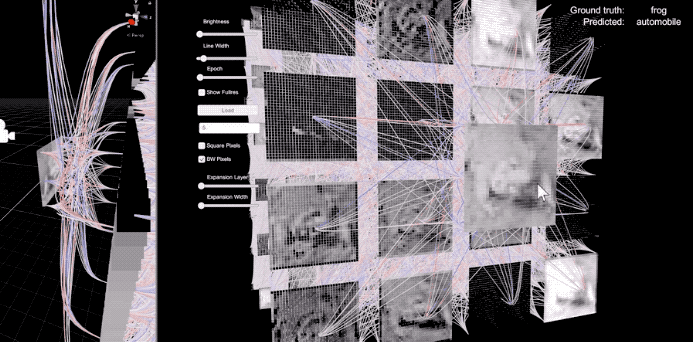
This kind of visualization can be constructed by loading TensorFlow checkpoints.
It can also be designed in the Unity editor.
Doesn’t it feel a bit like a goose girl? Recently, this project has gone viral on social media.
Netizens have expressed:
“If I could see this process during training, I could endure it for a longer time.”
“Please open source it.”

The author of this project is a 3D special effects artist from Vienna.
According to him, the reason for creating such a CNN visualization tool is that when he was a beginner in neural networks, he often found it difficult to understand how the convolution layers were interconnected and how they connected with different types of layers.
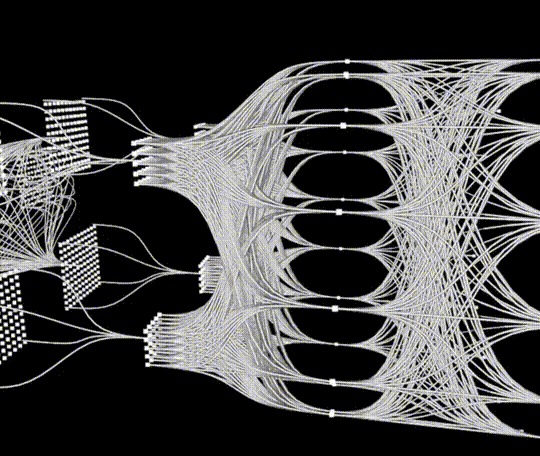
The main functions of this tool include visual representation of convolution, max pooling, and fully connected layers, as well as various simplification mechanisms to achieve clearer visualization.
In short, it aims to help beginners grasp the key points of CNN in the most intuitive way.
How to Create a 3D Network Using Unity
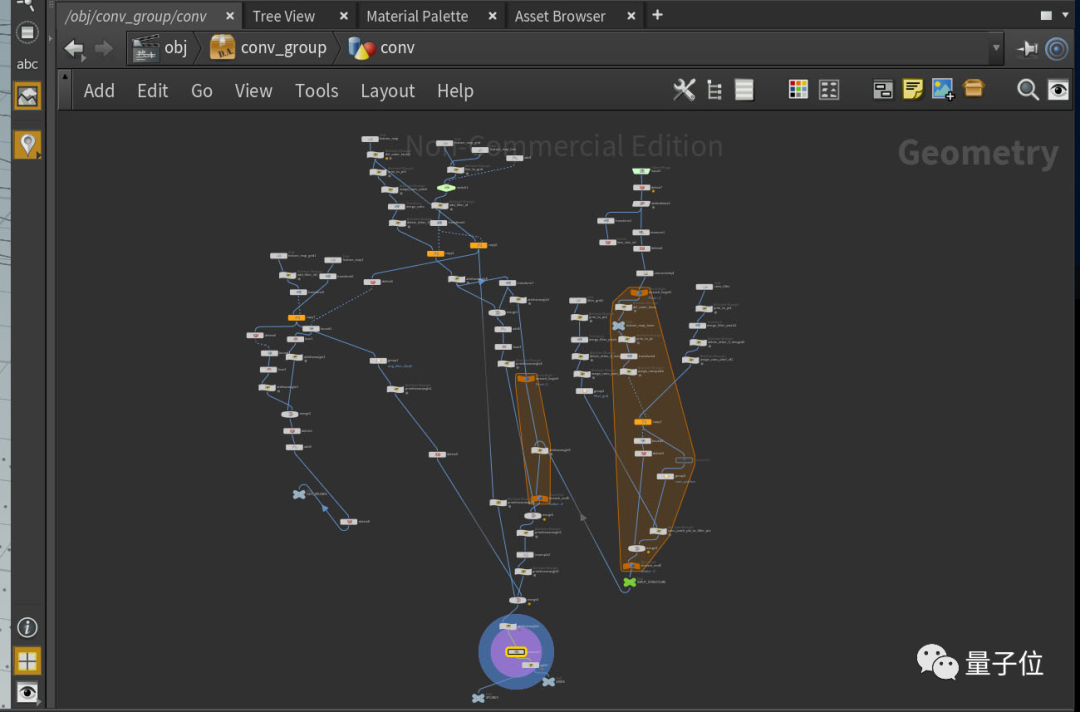
Before officially getting started with Unity, the author first built a visual 3D network prototype in Houdini software.
This means that a construction idea for the Unity version of the 3D network was provided first, preparing to address issues like displaying convolution calculations, the shape of feature maps, and the effect of edge bunding.
Its node editor looks like this:
Then, a 3D neural network can be built in Unity.
First, the “shape” of the neural network needs to be preset.
Since the author had never used Unity before, he first learned about shaders and procedural geometry.
In this process, the author discovered some limitations; he used Shaderlab, a language developed for shader programming in Unity, which does not allow color variation. Only pre-defined variables for semantics can be passed between vertex, geometry, and pixel shaders.
Moreover, it cannot arbitrarily assign vertex attributes, only predefined attributes like position, color, UV, etc. (This may also be one reason why the 3D network cannot change color in real time.)
After researching some concepts related to instancing, the author planned to use geometry shaders to generate the connections of the neural network. The starting and ending points are passed to the vertex shader and directly forwarded to the geometry shader.
These lines can consist of up to 120 vertices, as the scalar float variables that geometry shaders can create in Unity are limited to 1024.
The designed network shape looks something like this:
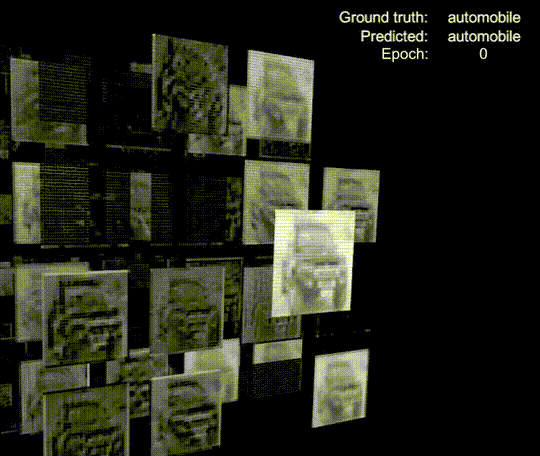
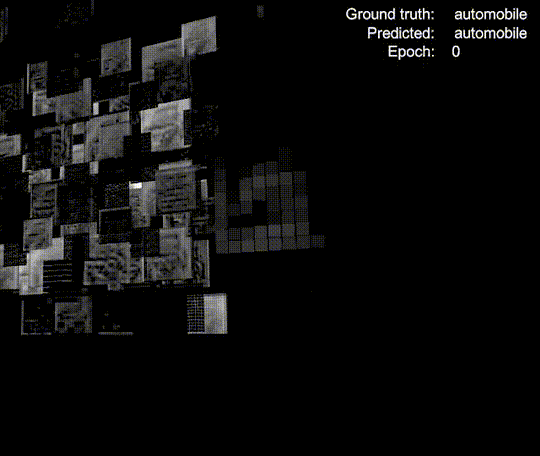
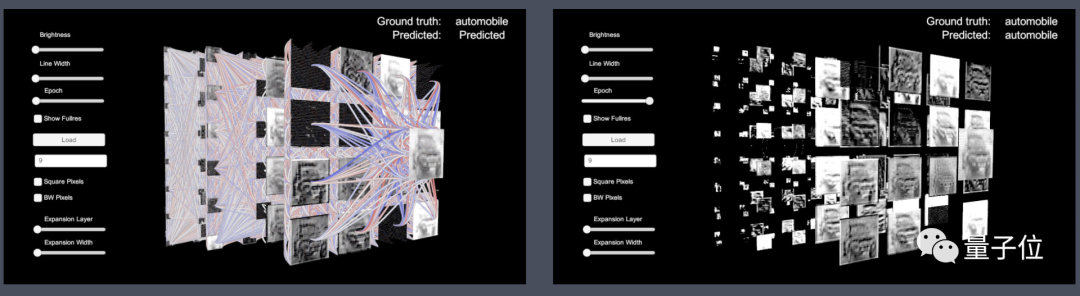
Then, the corresponding 3D neural network image is generated from the TensorFlow model code.
The Tensorflow-native.ckpt format file needs to store the data required to reconstruct the model graph, binary weight reading and activation values, and the names of specific layers.
For example, using the Cifar10-greyscale dataset, a checkpoint file needs to be written, and the weights need to be initialized randomly.
After that, these checkpoint files need to be loaded, a TensorFlow session started, and training examples input to query the activation functions of each layer.
Then, a json file is written to store the shape, name, weights, and activation functions of each layer for easy reading. The weight values are then used to assign color data to the Unity Mesh of each layer.
The final result is quite good:
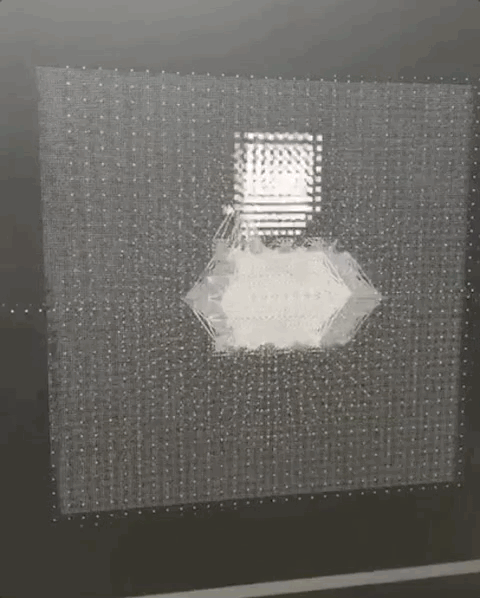
The author also recorded a development video, which can be found at the end of the article.
There Are Many Related Studies
In fact, many scholars have previously conducted research on neural network visualization.
For example, last May, a Chinese PhD visualized convolutional neural networks, displaying the changes in each layer very clearly. By clicking on the corresponding neuron, one can see its “operation”.
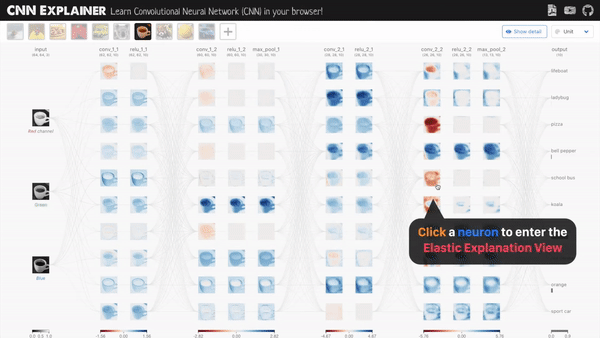
This is a 10-layer pre-trained model loaded using TensorFlow.js, which can run CNN models in the browser and allows real-time interaction to display the changes in neurons.
However, this is still a 2D project.
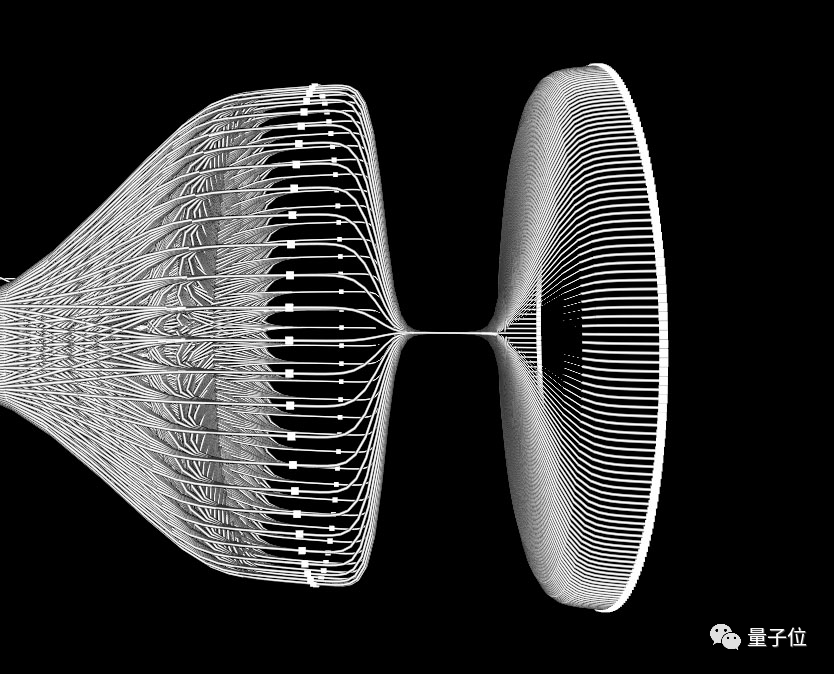
Currently, some have also created 3D visualized neural networks like the above model:
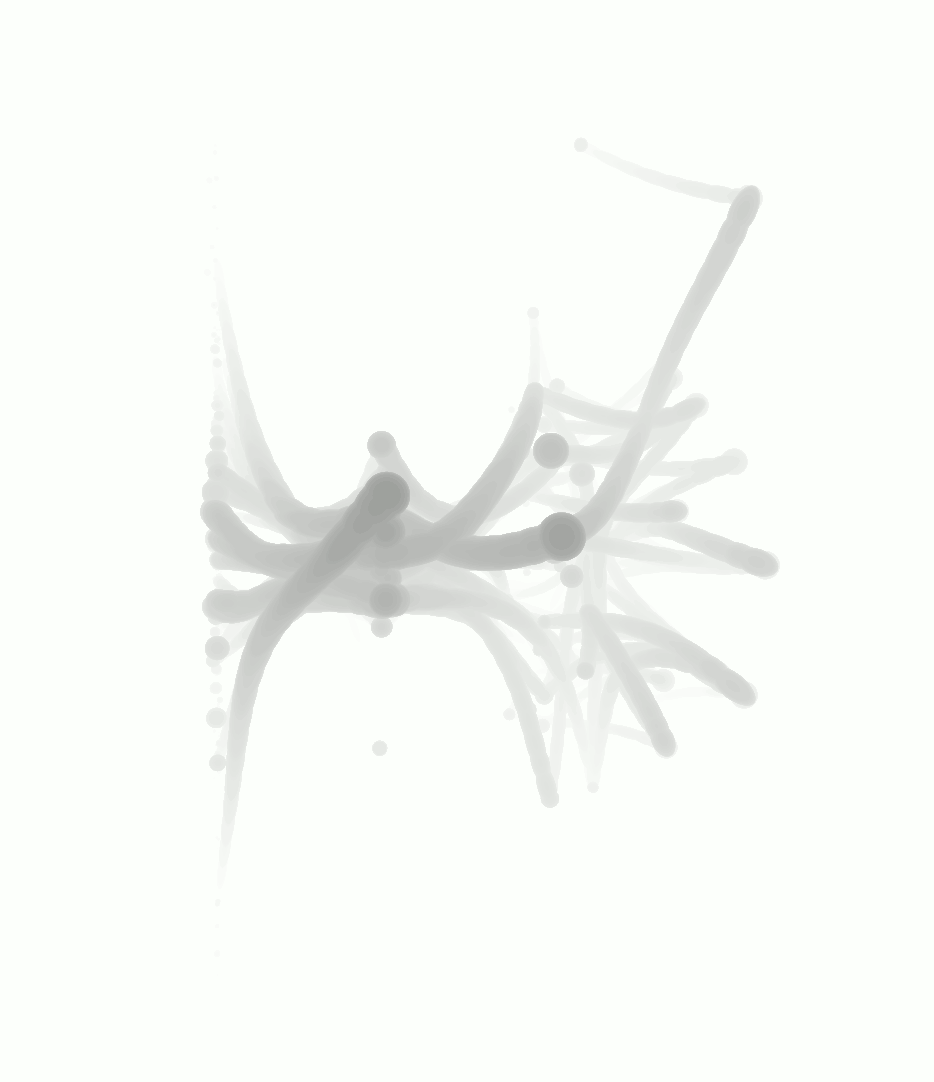
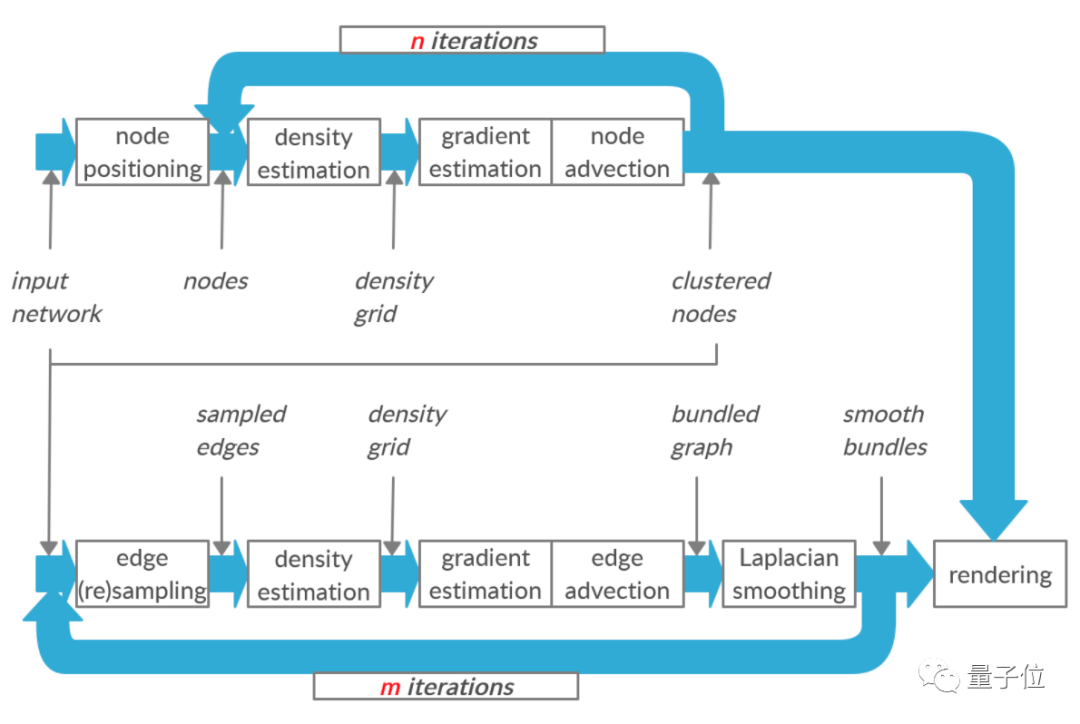
This project also uses edge bunding, ray tracing, and other technologies, combined with feature extraction, fine-tuning, and normalization to visualize neural networks.
This project aims to estimate the importance of different parts of the neural network using these technologies.
To this end, the author uses different colors to represent each part of the neural network, predicting their relationships based on the importance of the nodes in the network.
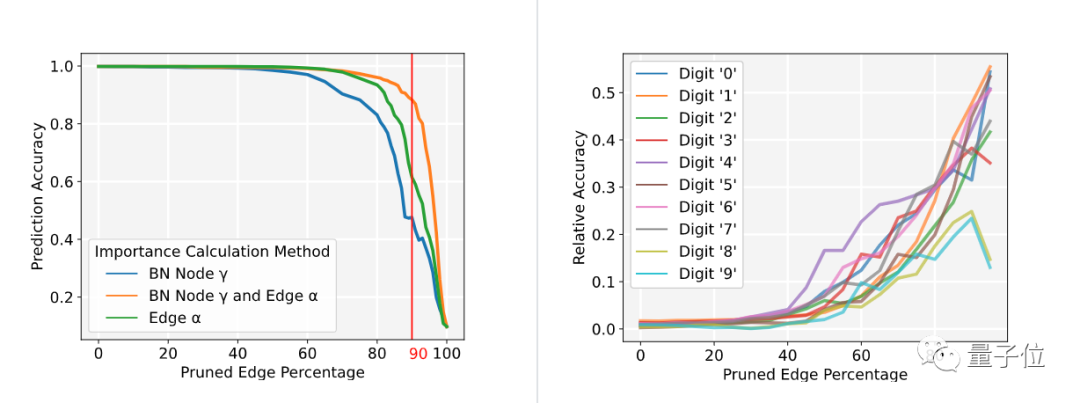
The general processing flow is as follows:
If you are interested in this type of 3D neural network visualization, you can find the corresponding open-source project link at the end of the article.
Author Introduction

Stefan Sietzen, currently living in Vienna, was previously a freelancer in 3D visual effects.
Currently, he is pursuing a master’s degree at the Vienna University of Technology, very interested in visual computing. This 3D neural network is one of the projects he worked on during his master’s program.
Development Process:https://vimeo.com/stefsietz
Open Source 3D Neural Network Project:https://github.com/julrog/nn_vis
Reference Links:https://www.reddit.com/r/MachineLearning/comments/leq2kf/d_convolution_neural_network_visualization_made/https://mp.weixin.qq.com/s/tmx59J75wuRii4RuOT8TTghttps://vimeo.com/stefsietzhttp://portfolio.stefansietzen.at/http://visuality.at/vis2/detail.html
This article is for academic sharing only; if there is any infringement, please contact to delete the article.
Editor / Garvey
Reviewed / Fan Ruiqiang
Rechecked / Garvey
Click below
Follow us