

Introduction
As a branch of mathematics, topology describes the properties and structures of space in a unique way. In recent years, geometry and topology have been widely applied in machine learning, especially topological models, which play a significant role in data representation and feature extraction. Topological Data Analysis (TDA) is rooted in algebraic topology and computational topology, having made great strides in handling structured data and gradually becoming an important aspect of Math for AI.In the Math and Artificial Intelligence Reading Club of the JiZhi Club, Teacher Xia Ke Lin discussed the main ideas and models of Topological Data Analysis (TDA). He first introduced the basic models of topological data representation, especially the construction of simplicial complexes based on data, and the differences from traditional graph models. He then introduced topological deep learning based on simplicial complexes. Topological Data Analysis shows great superiority in characterizing complex high-order interactions, especially its ability to capture the most essential topological information of a system. Topological Data Analysis will further promote our exploration and characterization of the essential information of data, laying a solid mathematical foundation for improving the accuracy, interpretability, and transferability of machine learning models.Research Areas: Complex Systems, Math for AI, Topological Data Analysis, Simplicial Complex, Topological Deep Learning, Graph Neural Networks, Filtering Flow Processes Xia Ke Lin | SpeakerWang Zhi Hong | OrganizerLiang Jin | Editor
Table of Contents
1. Topological Representation of Data2. Features of Topological Data Processing3. Topological Deep Learning4. Graph Neural Networks Based on Simplicial Complexes
1. Topological Representation of Data
This article uses molecular data processing as a starting point to explore the applications and characteristics of Topological Data Analysis (TDA). The two key aspects of AI in data processing—data representation and modeling analysis characteristics—are closely related to Topological Data Analysis. Next, we will elaborate on these two aspects.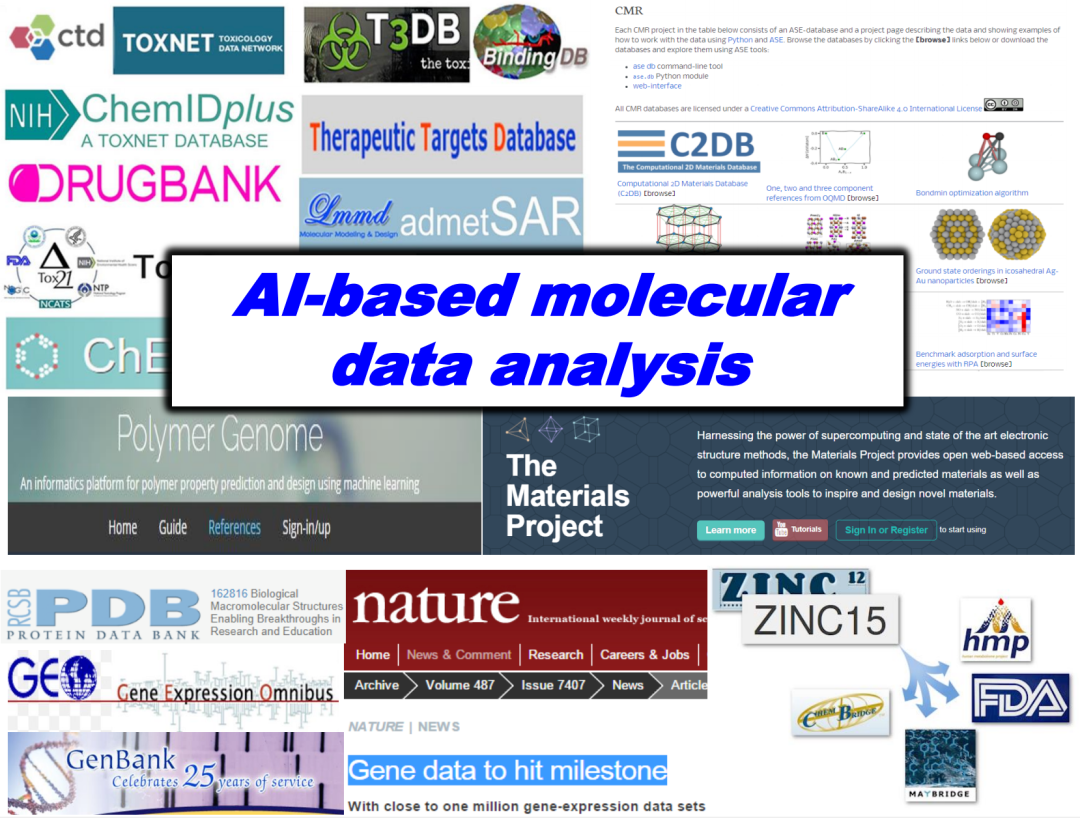 Figure 1. AI-Based Molecular Data Analysis
Tauzin, Guillaume, et al. “giotto-tda: A topological data analysis toolkit for machine learning and data exploration.” The Journal of Machine Learning Research 22.1 (2021): 1834-1839.
This article summarizes the relevant theories of the combination of topological data and machine learning.Chazal, Frédéric, and Bertrand Michel. “An introduction to topological data analysis: fundamental and practical aspects for data scientists.” Frontiers in artificial intelligence 4 (2021): 108.
1.1 Data RepresentationWhen processing image data, we can utilize neural network models to generate corresponding data representations. For example, by extracting specific feature points to construct a mesh model for face recognition. In addition to mesh models, there are other data representation methods such as feature maps and heat maps. Although originating from the same image data, different models can be established from a mathematical perspective: the simplest matrix model, or lattice models, mesh models, and even more complex function models. Once the mathematical model is established, features can be extracted based on the model and linked to subsequent information of interest, such as predictions through a Multi-Layer Perceptron (MLP).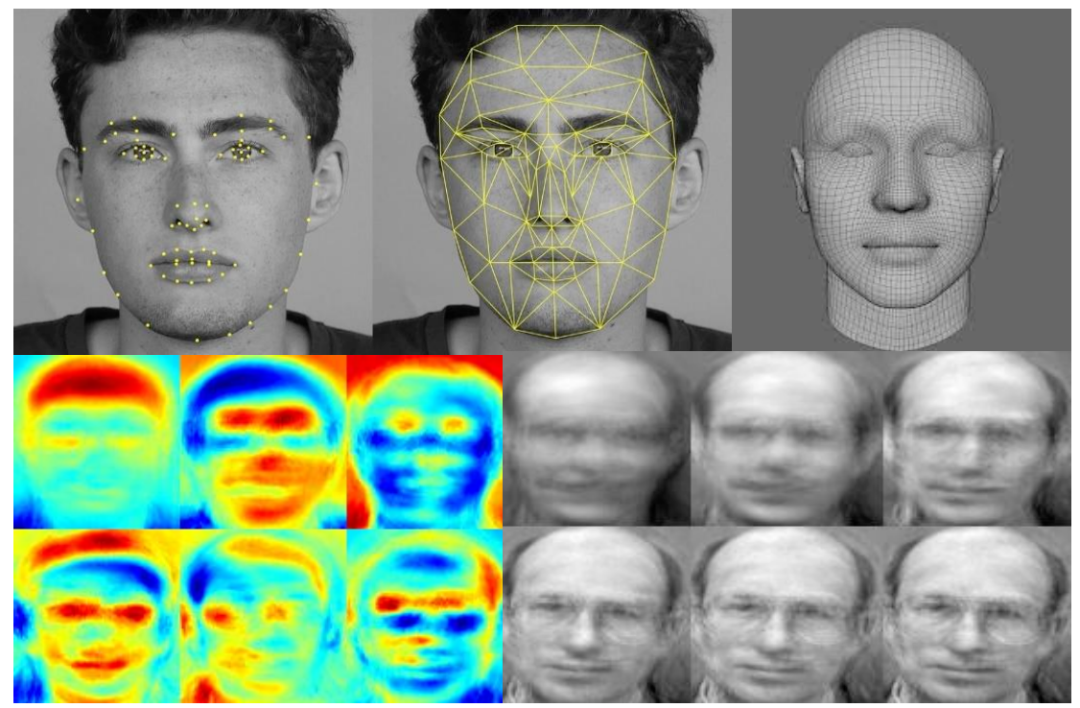 Figure 2. Face Recognition ModelSimilarly, when processing molecular data (such as small molecule data and protein data), there are also various data representation methods. A common approach is based on covalent bonds, where each node represents an atom, and edges represent covalent bonds, forming a graphical representation.
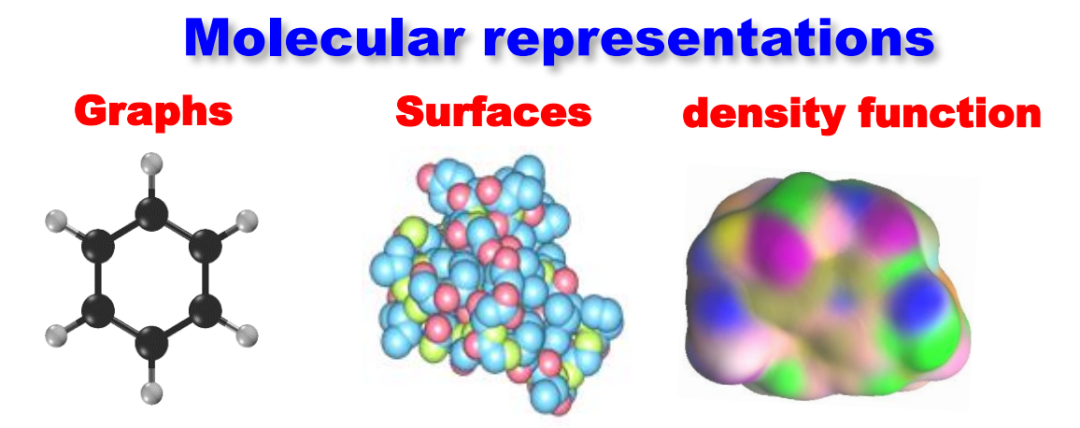 Figure 3. Different Molecular ModelsIn addition, there are geometric methods, such as viewing atoms as spheres with fixed radii, allowing observers to study from outside the sphere collection, i.e., the surface of the molecule, to observe its surface area or concave and convex regions. These concave and convex regions are related to the interaction information between atoms, and this description is more geometric in nature. Furthermore, electronic density or electronic function distribution can be calculated through Density Functional Theory, transforming molecular data into a spatially represented data form. Therefore, despite originating from the same molecular data, we can represent it from multiple perspectives. Once the representation is completed, various features can be extracted based on it, including various fingerprints and descriptors. These properties may relate to the functions we ultimately want to understand, such as solubility, lipophilicity, and toxicity.1.2 Modeling Molecular StructuresIn constructing models of molecular functions, structural data is heavily utilized. This is because there is a strong relationship between the structure of a molecule and its function, known as the Structure-Function Relationship.For example, a notable feature of ion channel proteins is the hole at their center (Figure 4, top left), which is crucial for the function of ion channels as it facilitates the entry of ions from outside the cell membrane into the membrane or the exit of ions from within the membrane to the outside. Another example is protein cages (Figure 4, bottom right), which have a certain structure on the surface but are hollow inside, much like a box used for storage, making this hollow structure conducive to the storage and transport of certain substances. The last example is a molecule with two fixed regions connected by a flexible region. This structure can form a switch state, allowing the molecule to be in an excited or non-excited state, thus affecting its function.
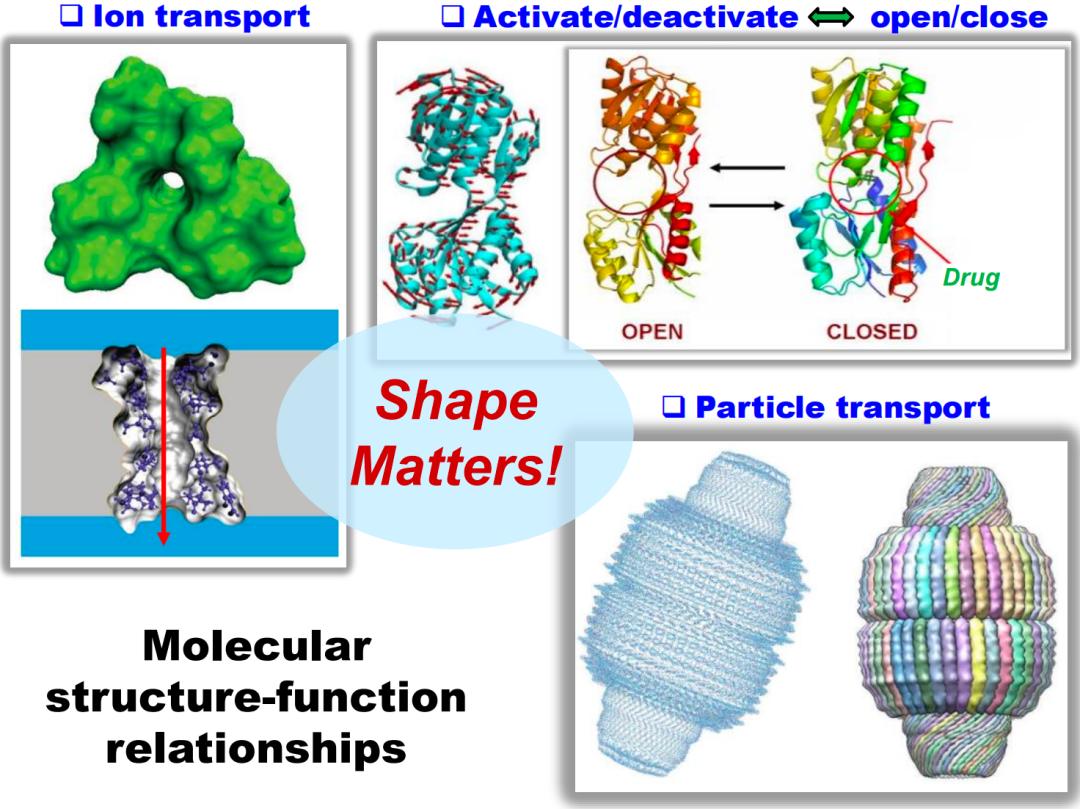 Figure 4. Protein Molecular StructuresWhether connected by covalent bonds or through non-covalent interactions, they all affect the final stable structure, which is closely related to the function of the molecule. Therefore, describing the structure of molecules is of great importance for understanding their function. To better depict the structure of molecules, a large number of descriptors (whether combinatorial quantities, topological quantities, or geometric quantities) have been extracted. Among these descriptors, some focus on topological features, such as vectors on graphs, geometric quantities, etc., while others focus on combinatorial or proximity information fingerprints.
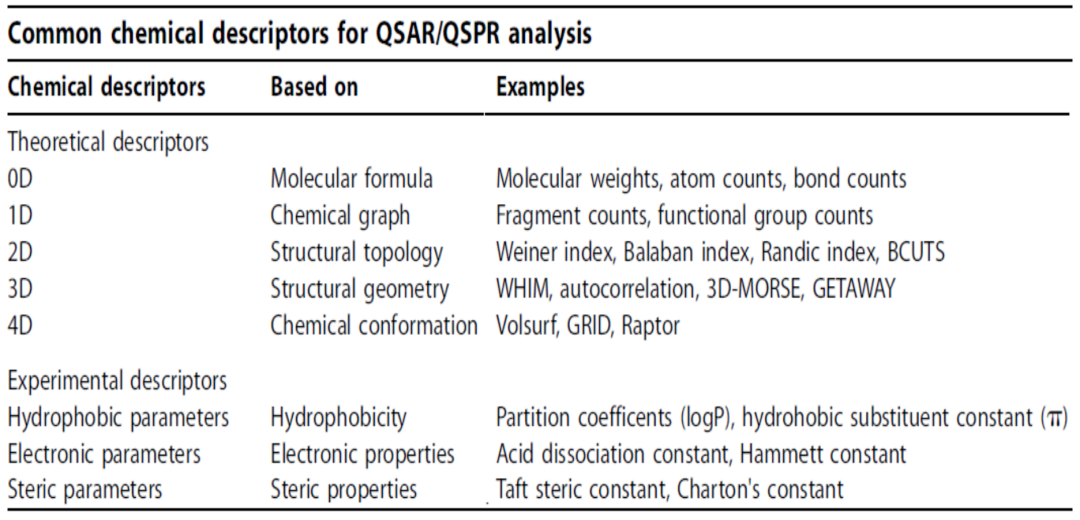 Figure 5. Chemical DescriptorsAmong the numerous descriptors related to structure, there may exist some more essential, more global quantities that can better capture the overall information of the structure, thereby playing a more important role in understanding and depicting the function of molecules. This leads us to the core of topological data processing: describing data through topological invariants.
2. Features of Topological Data Processing
Topological data analysis has three main features compared to traditional tools:
1) Simplicial Complex: Using simplicial complexes as a descriptive method can capture richer topological and geometric information in the data compared to graph representations.
2) Topological Invariants: Topological data analysis uses topological invariants rather than relying solely on statistics or descriptive quantities. These topological invariants can provide a deep understanding of the data, including connectivity, holes, and other complex structures.
3) Filtering Flow Process: Topological data analysis includes a filtering flow process that can be well integrated with multi-scale descriptions within the system. By observing and analyzing data from different scales, we can obtain more comprehensive information.2.1 Simplicial ComplexIn non-mathematical fields such as computer science, engineering, and biology, graphs are often used to express the connections between entities. However, in basic mathematics, the description method called Simplicial Complex is more commonly used. As an advanced topological tool, simplicial complexes can better depict structural information in complex systems.Compared to graphs, simplicial complexes have several important differences:1) Higher Dimensional Representation: In addition to representing nodes and edges (i.e., 0-dimensional and 1-dimensional objects), simplicial complexes can represent higher-dimensional objects. For example, a filled triangle represents a 2-dimensional object, while a filled tetrahedron represents a 3-dimensional object.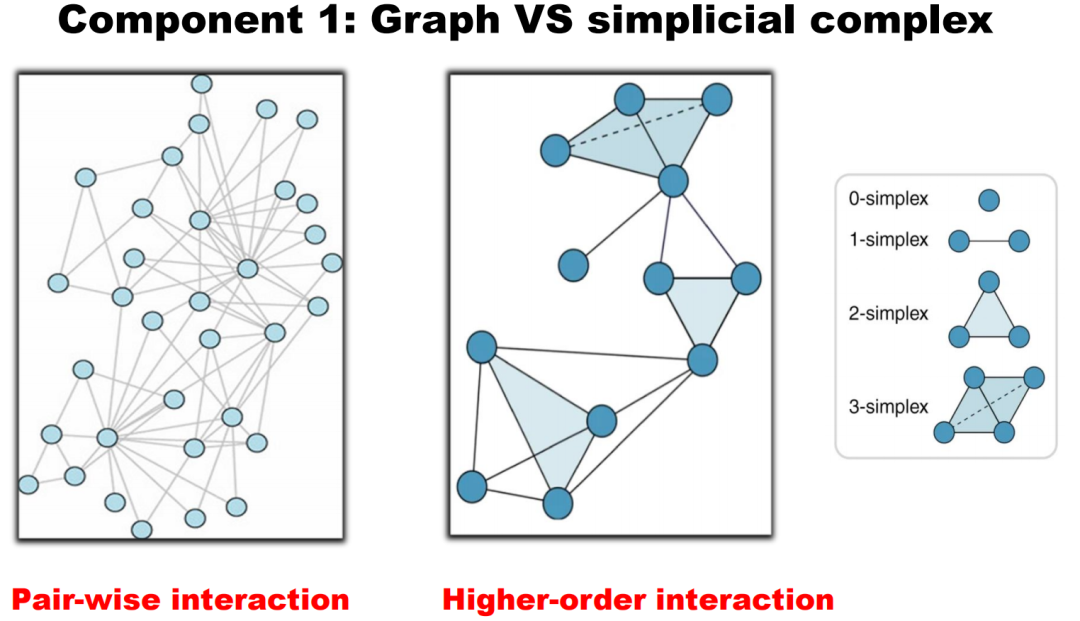 Figure 6. Graph vs. Simplicial Complex2) Higher-Order Interactions: Graphs primarily describe pairwise interactions, while by introducing “higher-dimensional units“, simplicial complexes can express interactions among more than two entities. For example, a filled triangle represents interactions among three entities, while a filled tetrahedron represents interactions among four entities. To illustrate the difference, consider this analogy: a graph can represent the relationships between a father and child, and between a mother and child; while a complex can represent the family unit consisting of the father, mother, and child, depicted as a filled two-dimensional triangle.3) Distance and Volume Descriptions: Graphs typically only describe paths or distances, while simplicial complexes can describe areas (2-dimensional units) or volumes (3-dimensional units). This provides us with higher-order information, allowing us to capture more complex interactions between entities.As a simple example, constructing a complex from a set of points and a fixed distance (Vietoris-Rips complex):
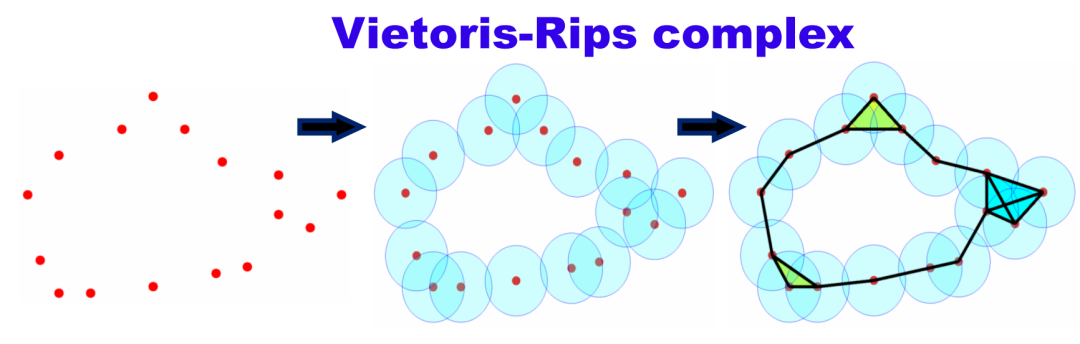 Figure 7. Vietoris-Rips ComplexOr more complexly, in differential topology, segmenting manifolds based on the values of function derivatives being 0 and their positive definiteness (Morse complex):
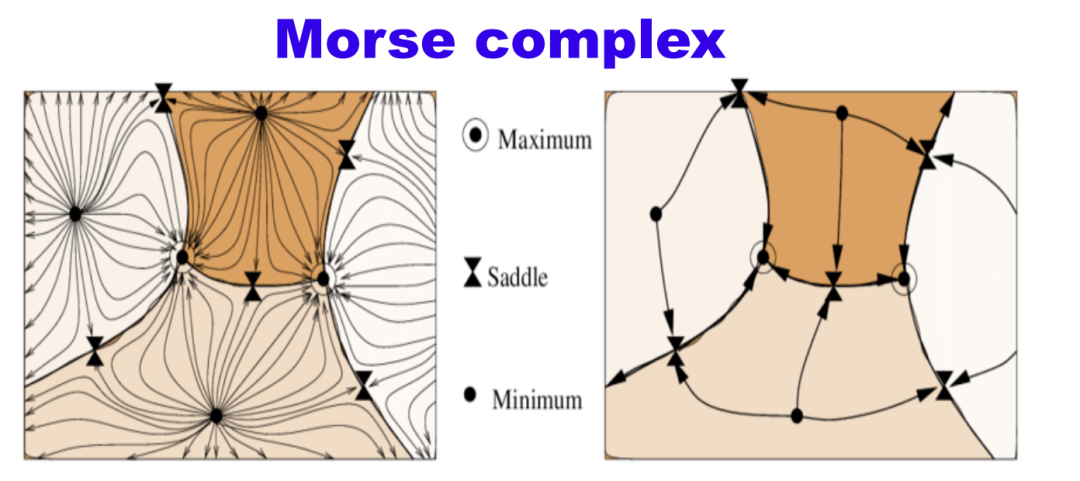 Figure 8. Morse Complex
Magillo, Paola, et al. “A discrete approach to compute terrain morphology.” Computer Vision and Computer Graphics. Theory and Applications: International Conference VISIGRAPP 2007, Barcelona, Spain, March 8-11, 2007. Revised Selected Papers. Springer Berlin Heidelberg, 2008.
Extracting discrete methods for Morse complexes
2.2 Topological InvariantsTopological invariants are a characterization of the properties of topological spaces, providing a global and essential perspective in data analysis. Compared to statistical methods like PCA, it focuses more on overall properties. Here are two classic examples of topological invariants:1) Euler Characteristic: The Euler characteristic is defined as “number of vertices minus number of edges plus number of faces” (V-E+F). For polyhedra that are topologically equivalent to a sphere (such as cubes or octahedra), the Euler characteristic is always 2. This is because, in a topological sense, these shapes can be continuously transformed into a spherical shape.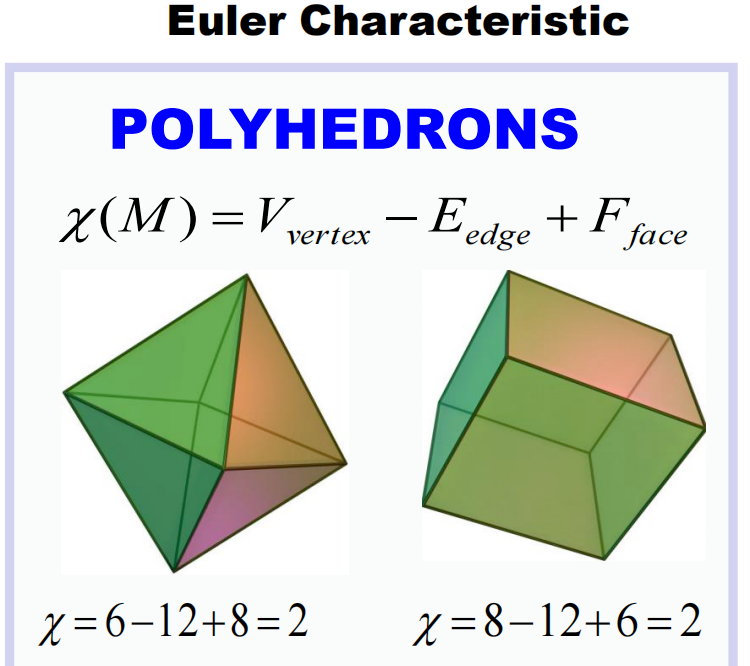 Figure 9. Euler Characteristic of Tetrahedron and Hexahedron2) Betti Numbers: Betti numbers are commonly used topological invariants in Topological Data Analysis (TDA) to describe the complexity of topological spaces. The zeroth Betti number indicates the number of connected components, the first Betti number indicates the number of independent loops, the second Betti number indicates the number of “hollow” spherical surfaces, and so on.
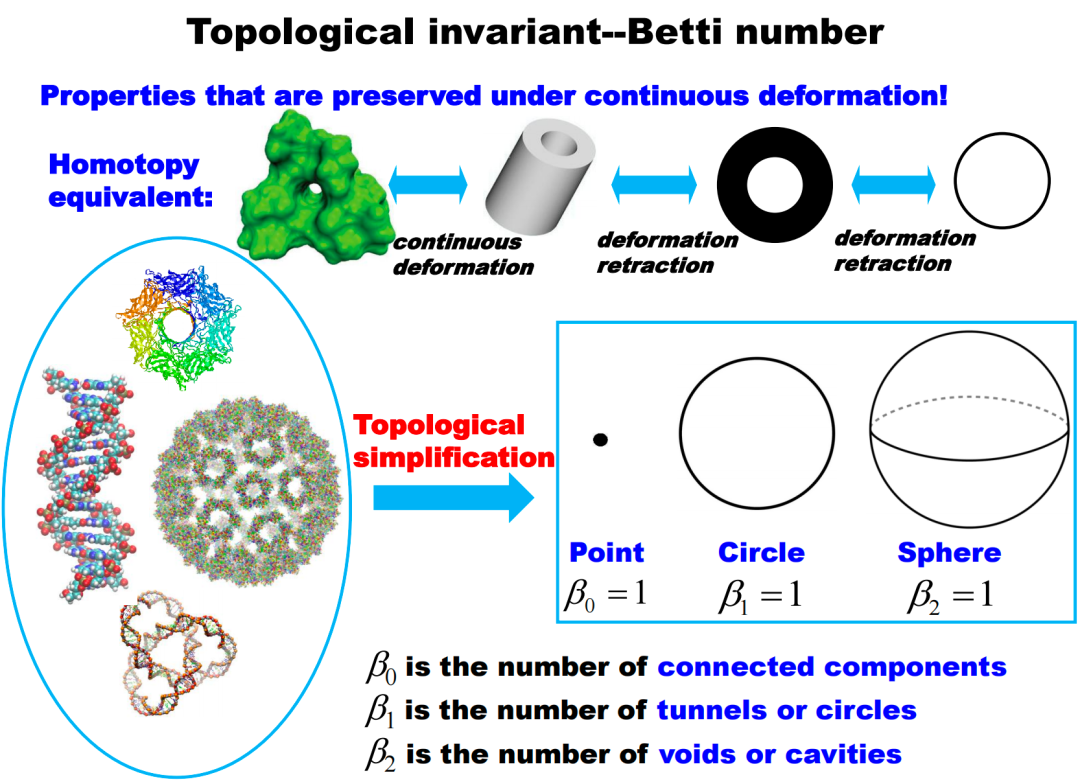 Figure 10. Betti Numbers Describing Molecular Structure2.3 Filtering Flow ProcessThe filtering flow process is a core concept of topological data analysis. This process can be understood as continuously changing scales to observe how complex systems change with scale. The filtering flow process describes simplicial complexes at different scales and generates corresponding barcodes to record topological information at each scale.
Figure 11. Filtering Flow ProcessThe fourteen points on the far left of the figure represent the original data, each point surrounded by a sphere. Over time, the radii of these spheres increase. When two spheres touch, it indicates a connection between two data points, forming an edge, and reducing the number of independent branches by one. In the filtering flow process, as the radius of the spheres increases, the number of independent elements gradually decreases while new topological structures (such as loops and higher-dimensional holes) emerge. From the barcodes in the figure, we can see that initially, there are 14 independent nodes, so Betti0 is 14. As time progresses, the connections between spheres increase, and the number of independent nodes decreases. At the same time, when closed paths appear, loops are formed, which can be observed in the barcode for Betti1.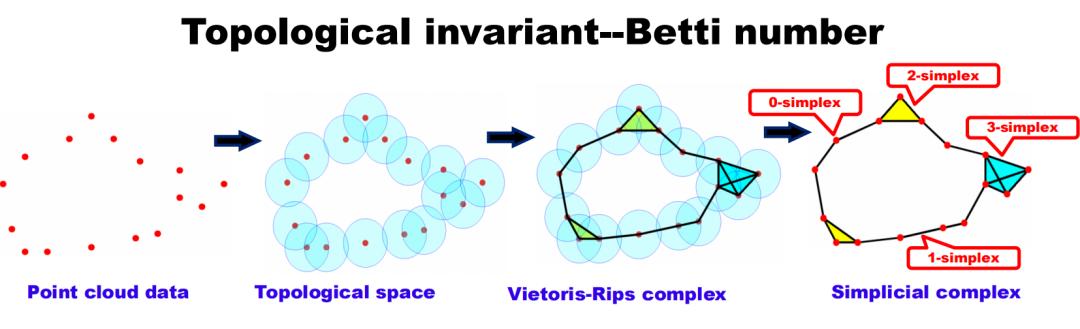 Figure 12. Vietoris-Rips Complex and Simplicial ComplexThrough the filtering flow process and simplicial complexes, we can understand the structure of complex systems from a global and multi-scale perspective and quantify these properties through topological invariants like Betti numbers. This method has important applications in machine learning, transfer learning, and more, providing a deeper understanding of the essential structural characteristics of data compared to traditional statistical tools.
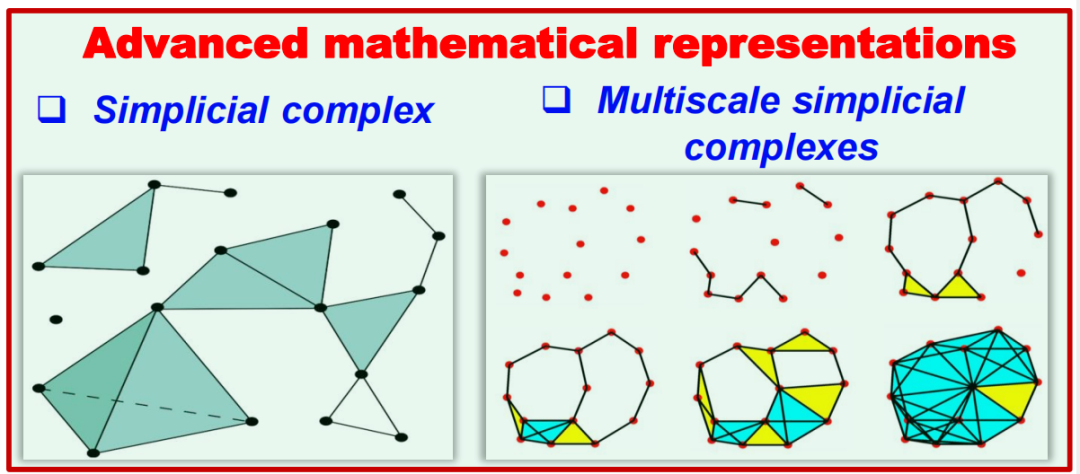 Figure 13. Multi-Scale Simplicial Complex
3. Topological Deep Learning
3.1 Basic Process of Topological Deep LearningEarlier discussions were more mathematical in nature; when addressing real-world problems, how can we apply topological theory to specific scientific issues such as chemical molecules? Taking the C60 molecule as an example, C60 is a molecule composed of 60 carbon atoms, shaped like a soccer ball, containing 12 pentagons and 20 hexagons. As shown in the figure below, we analyze it using topological data analysis, where the X-axis represents the diameter.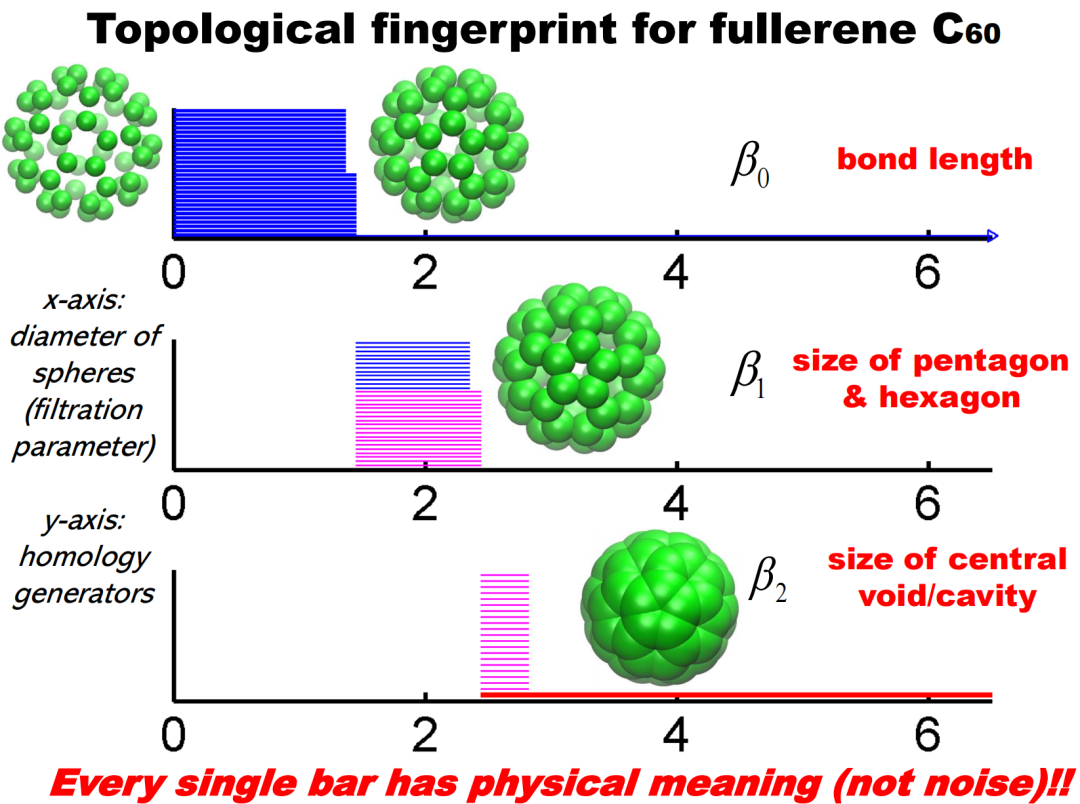 Figure 14. Betti Numbers of C60 Molecule as Diameter Changes • In Betti-0, there are 60 barcodes, with 30 being shorter and 30 being longer. The shorter ones represent carbon-carbon double bonds, as double bonds are stronger and pull the atoms closer; while the longer ones represent carbon-carbon single bonds, which are weaker, thus slightly longer in distance. Thus, Betti-0 describes the information of covalent bonds. • In Betti-1, there are 32 barcodes, with 12 being shorter and 20 being longer. The shorter ones correspond to pentagons, while the longer ones correspond to hexagons. Therefore, Betti-1 describes the information of loops. • In Betti-2, a long barcode can be seen, corresponding to the hollow structure of the C60 molecule. Through these feature information, we combine topological data analysis with machine learning. For example, we construct different types of simplicial complexes on the data, perform the filtering flow process, obtain barcodes, and then extract various features (such as the longest barcode, shortest barcode, total quantity, etc.), and input these features into machine learning models such as Random Forest or Gradient Boosting Tree for functional prediction tasks. This achieves the basic process of topological deep learning.
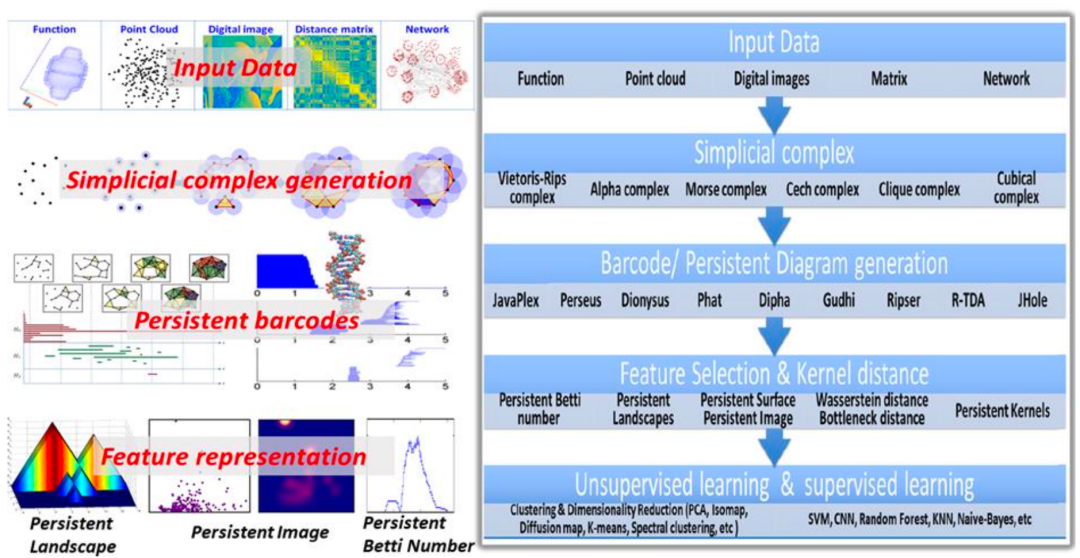 Figure 15. Basic Process of Topological Deep Learning3.2 Domain-Related WorkIn the field of research combining Topological Data Analysis (TDA) and machine learning, Professor Wei Guo Wei and his team have done a lot of innovative work. They extract features from datasets through TDA and use these features for various prediction tasks. In recent years, when graph networks were not widely applied and the amount of data processed was relatively small (usually between three thousand and four thousand), their research results showed that TDA can extract features more effectively than traditional statistical methods or some specific combinations.
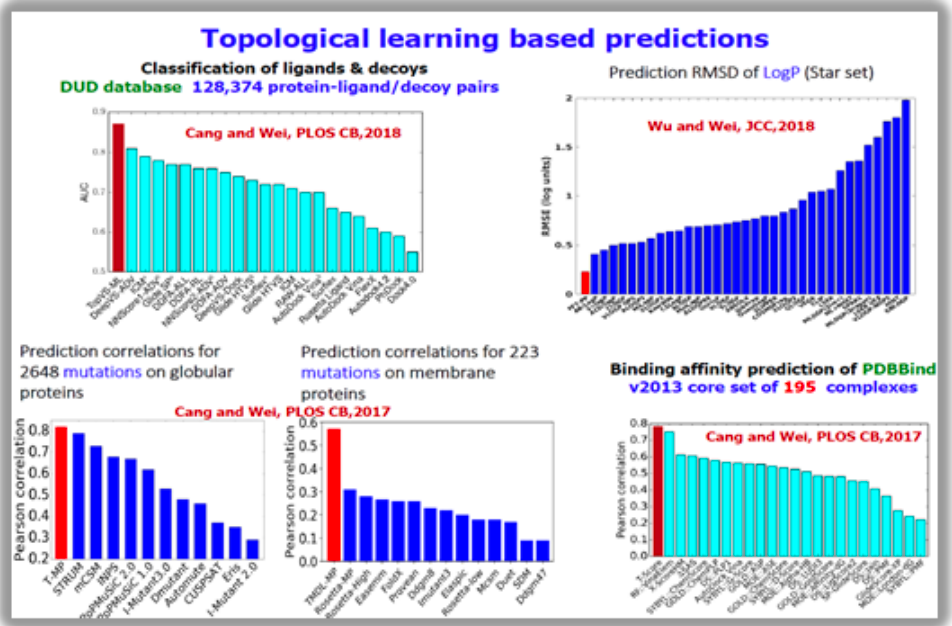 Figure 16. Predictions Based on Topological LearningFrom the results of multiple benchmark datasets, their TDA-based models performed very well. Notably, they achieved significant advantages in the D3R drug design competition by combining TDA and machine learning methods in both the 2017 and 2018 competitions, surpassing many traditional methods. Their early work in the direction of combining TDA and machine learning has laid a solid foundation for this field.
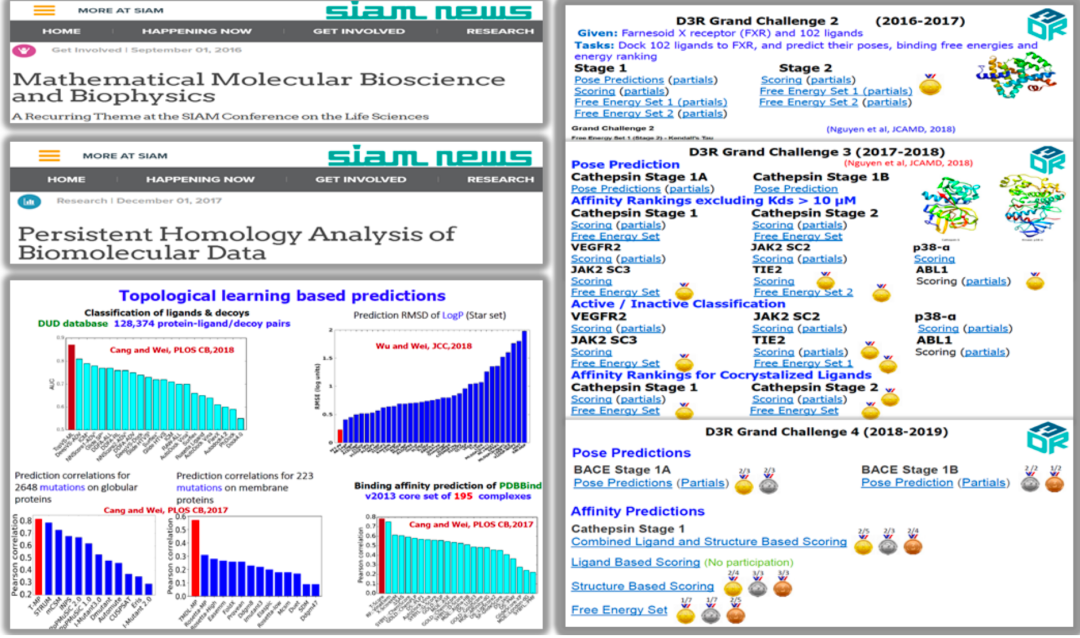 Figure 17. D3R Drug Design Competition
Cang, Zixuan, Lin Mu, and Guo-Wei Wei. “Representability of algebraic topology for biomolecules in machine learning based scoring and virtual screening.” PLoS computational biology 14.1 (2018): e1005929.
The topological machine learning model predicts ligand-protein binding energy.
Nguyen, Duc Duy, et al. “MathDL: mathematical deep learning for D3R Grand Challenge 4.” Journal of computer-aided molecular design 34 (2020): 131-147.
The topological machine learning model is applied to drug design.
3.3 Persistent Spectral: Spectral Graph Method Combined with Filtering Flow ProcessWhen observing and analyzing data, there are mainly two approaches: one is to consider the representation of data, and the other is to utilize the features of data. Previously, we focused on topological characteristics, including various topological invariants that describe the complexity of structures. On the other hand, when we want to retain more refined features of data, we need to consider other mathematical invariants of the data. For example, for graphs or simplicial complexes, we can consider spectral graph methods and their extensions, which are based on discrete Laplacians on graphs, simplicial complexes, or hypergraphs, and use their spectral information for data representation.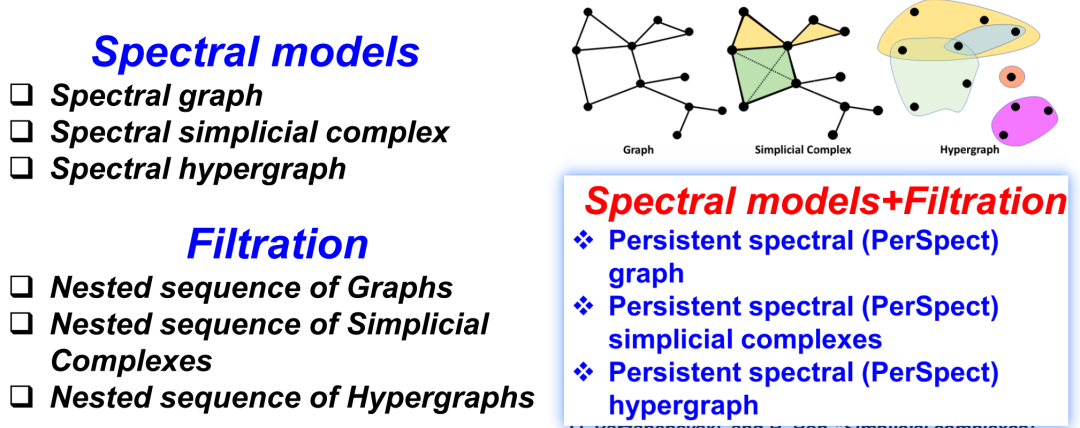 Figure 18. Spectral Graph Method Combined with Filtering Flow ProcessTo combine these two ideas, we propose a new model Persistent Spectral. This model integrates the filtering flow process and spectral graph methods, revealing its inherent topological characteristics while preserving the original form of the data.
Edelsbrunner, Herbert, and John Harer. “Persistent Homology-a Survey.” Contemporary mathematics 453.26 (2008): 257-82.
Persistent homology is the core model of topological data processing (TDA).
Wang, Rui, Duc Duy Nguyen, and Guo‐Wei Wei. “Persistent Spectral Graph.” International journal for numerical methods in biomedical engineering 36.9 (2020): e3376.
A persistent spectral graph method was proposed.
Laplacian Matrix
We will only provide a rough introduction to the concept of the Laplacian matrix. The k-dimensional Laplacian matrix Lk has the following calculation formula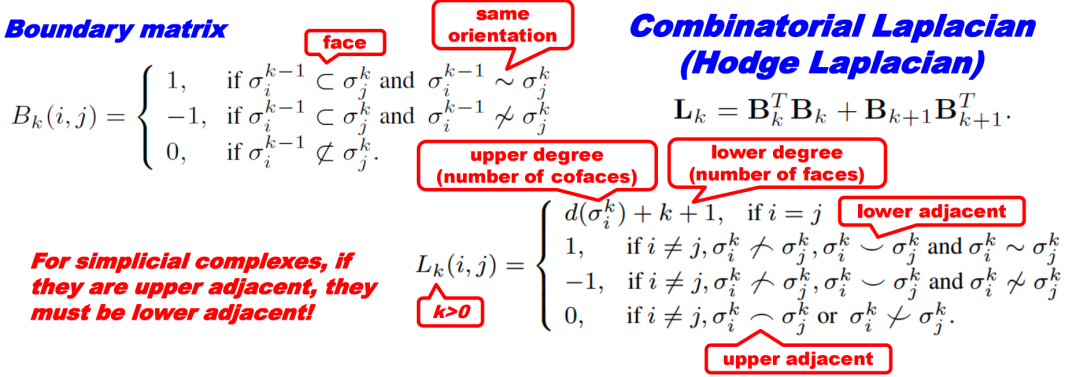 Figure 19. Calculation Formula of Laplacian MatrixFor example, the 0-dimensional Laplacian matrix L0 is based on point units, with diagonal entries being the degree of the points. When points i and j are connected, the (i, j) entry of L0 is set to -1; otherwise, it is set to 0. Similarly, on complexes, edges can be made unit objects, resulting in the 1-dimensional Laplacian matrix L1 based on the relationships of the edges.
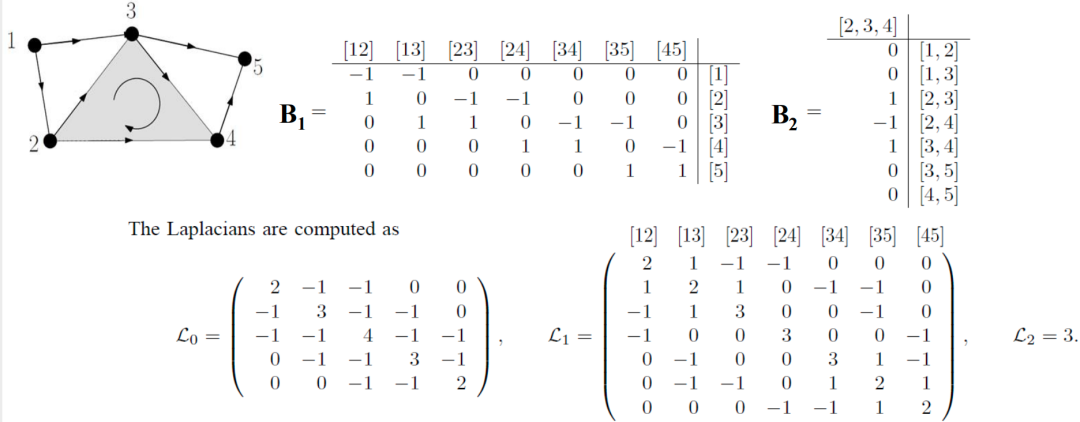 Figure 20. Laplacian Matrices L0, L1, L2The Laplacian matrix can be subjected to eigenvalue decomposition, where the number of zero eigenvalues corresponds to Betti0, reflecting the number of connected components in the graph. The non-zero eigenvalues of the Laplacian matrix also contain rich information. For instance, the smallest non-zero eigenvalue, also known as the Fiedler value, is often used to characterize the connectivity of a graph, demonstrating the relationships between different parts of the simplicial complex.
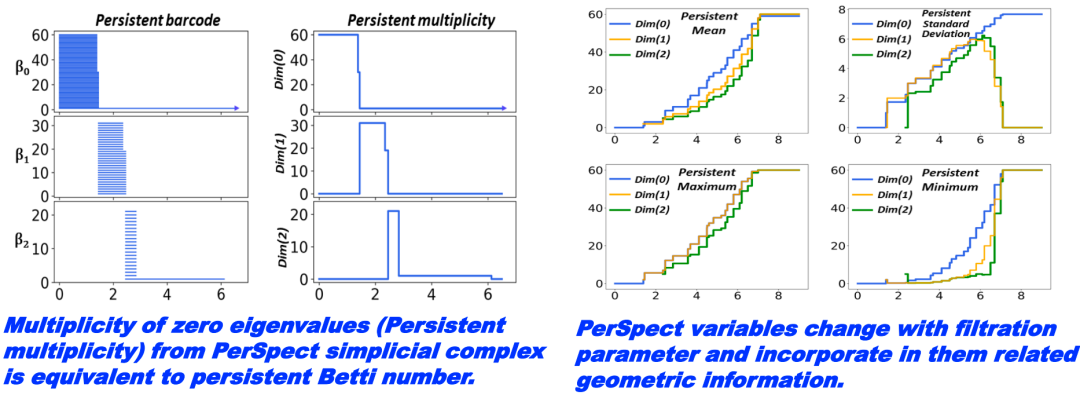 Figure 21. The Number of Zero Eigenvalues and Betti NumbersAnother important invariant is geometric invariants, such as Ricci curvature. Ricci curvature can capture community structures or cluster structures within graphs or networks. For example, when there is a tightly connected community or cluster in a graph, the Ricci curvature in that area is usually a large positive value. In contrast, the bridge part connecting two different communities or clusters may have a negative Ricci curvature. Therefore, many researchers utilize the assignment of Ricci curvature to describe the interconnectivity between different regions in a network.
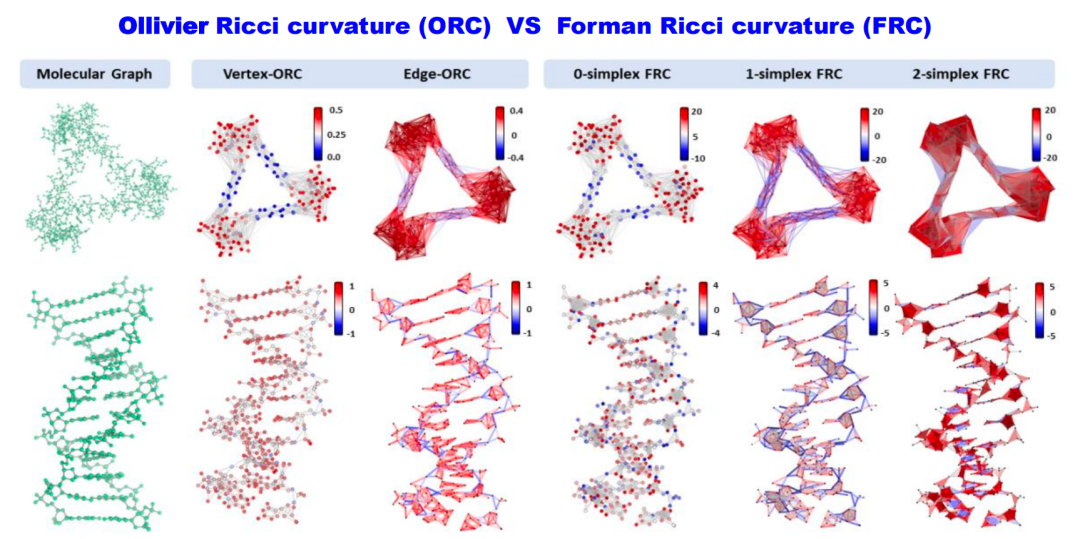 Figure 22. Ricci CurvatureRicci curvature and other various curvatures are important tools for describing overall structure, cluster structure, community structure, and the relationships between connected structures, which can be used to reveal the rich and complex topological and geometric properties within networks or datasets.In fact, the information mentioned can be interrelated. For instance, the Betti numbers in topology (homology information) correspond one-to-one with the zero eigenvalues of the Hodge Laplacian. The discrete form of Ricci curvature (such as Forman Ricci curvature) can also be linked through some combination with the Hodge Laplacian (for instance, via the Bochner-Weitzenböck formula).
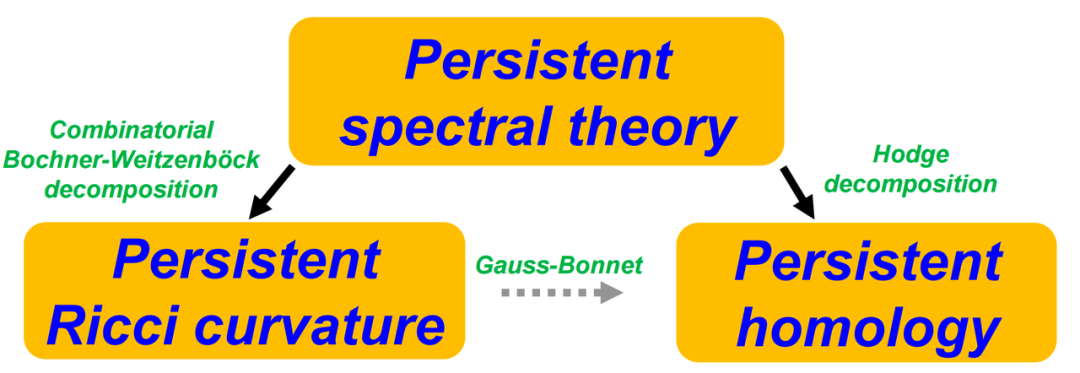
Figure 23. Associations of Geometric Invariants
Using these tools to describe the structure of data from different angles:
• Ricci curvature helps us understand the geometric properties of data;
• Betti numbers or more generally homology information reveal the topological properties of data;
• Spectral methods can capture the global characteristics of networks or datasets.
3.5 Construction of Simplicial Complexes
The above mainly introduced several methods of data feature extraction based on mathematical invariants, including Betti numbers, curvature, and spectral information. Another more essential question is the representation of data. For example, using graphs, simplicial complexes, and hypergraphs to represent data.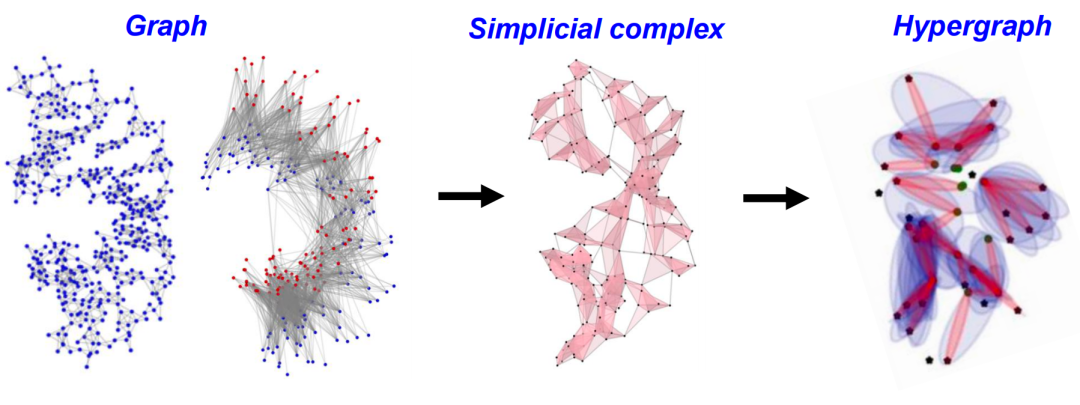 Figure 24. Simplicial Complex and HypergraphConsider the substructures of graphs or simplicial complexes, such as communities, clusters, or modules. These substructures often reveal more refined organizational forms within the data, helping us understand and predict the behavior of systems more accurately. Additionally, a dynamic perspective can be considered, such as temporal evolution networks, which can help us understand the changes and development patterns of systems.There are many methods to construct simplicial complexes; in addition to commonly used methods such as Clique complex, VR complex, Alpha complex, etc., we will introduce three methods that have wide applications in topology. Furthermore, topological information can also be represented through other algebraic models; here we will introduce a special algebraic model, Tor-algebra.
Bodnar, Cristian. “Topological deep learning: graphs, complexes, sheaves.” PhD diss., University of Cambridge, 2022.Topological deep learning.
3.5.1 Neighborhood ComplexThe simplest construction method is the Neighborhood Complex, based on the adjacency relationships in a given graph. As shown in the figure, assume there is a point with three adjacent points. We will form these four points into a quadrilateral (called a 2-simplex). If two points among the adjacent points are also mutually adjacent, an edge (1-simplex) is formed between these two points. If three points are mutually adjacent, these three points form a filled triangle (2-simplex). This way, the graph is transformed into a neighborhood complex.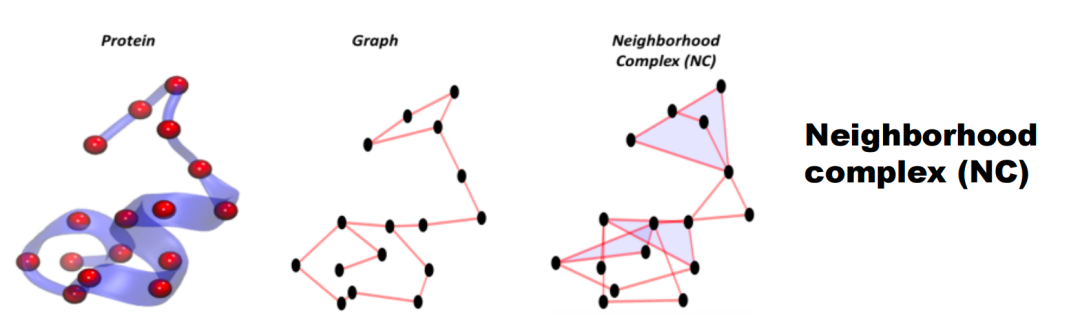 Figure 25. Neighborhood ComplexThe topological information described by this neighborhood complex can significantly differ from that obtained through other methods (such as Clique Complex). Another interesting simplicial complex construction method is the Dowker Complex.3.5.2 Dowker ComplexWhen studying the interactions between two entities, such as the connections between two molecules, we may be more concerned with the global interaction relationships between molecules rather than the internal connections of each. In this case, a bipartite graph is a good tool; we treat small molecules (such as blue points and green points) as graph nodes and add edges based on their interaction relationships.
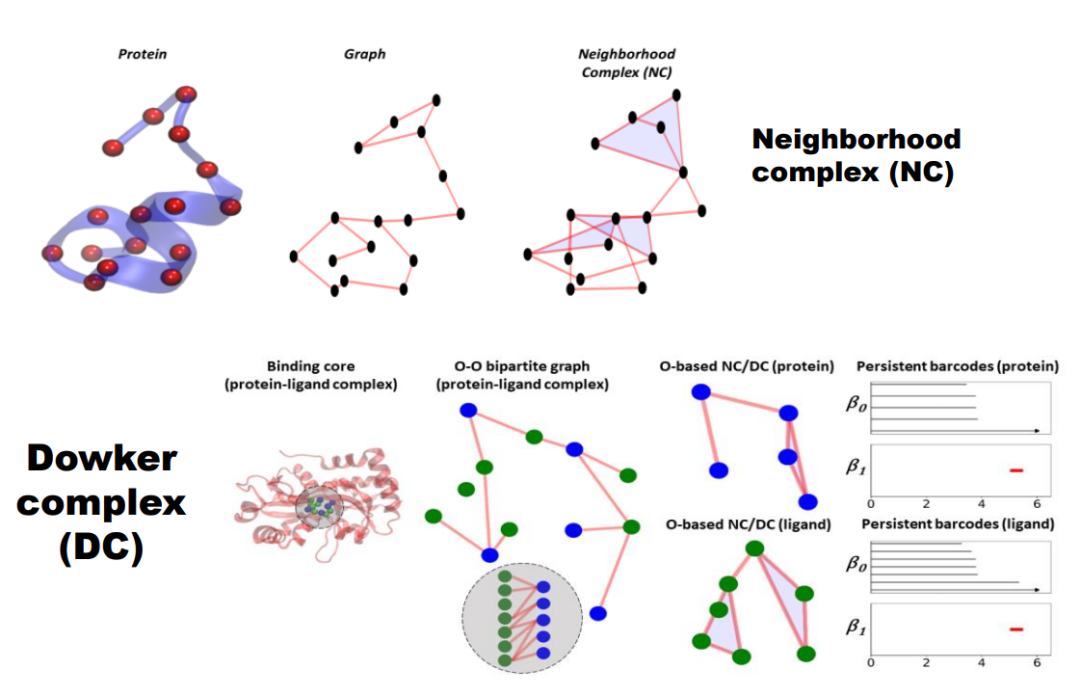 Figure 26. Dowker ComplexBased on this, the neighborhood complex is constructed. Since all adjacent points of the blue points are located within the green point set and vice versa, two simplicial complexes are ultimately obtained, consisting of blue and green points, using the Dowker complex to explore the interaction relationships between entities.3.5.3 Hom Complex
C. H. Dowker, “Homology groups of relations,” Annals of mathematics, pp. 84– 95, 1952. L. Lovász, “Kneser’s conjecture, chromatic number, and homotopy,” Journal of Combinatorial Theory, Series A, vol. 25, no. 3, pp. 319–324, 1978.
A more complex scenario can be constructed using the “Hom Complex” method, which is suitable for studying the interactions between two graphs. The core is to construct a structure called Polyhedral Complex, where the elements are multihomomorphisms. For example, suppose there are two graphs K2 and K3, and we choose a mapping strategy to map K2 to K3. This mapping only needs to ensure that edges existing in the original graph also correspond to edges in the new graph. For instance, mapping point K1 of K2 to point a in K3, and mapping point x2 to point b. However, if we attempt to map both points K1 and x2 to point a, it would create a problem because there exists an edge between points x1 and x2 in the original graph, but point a cannot form a self-loop in the new graph.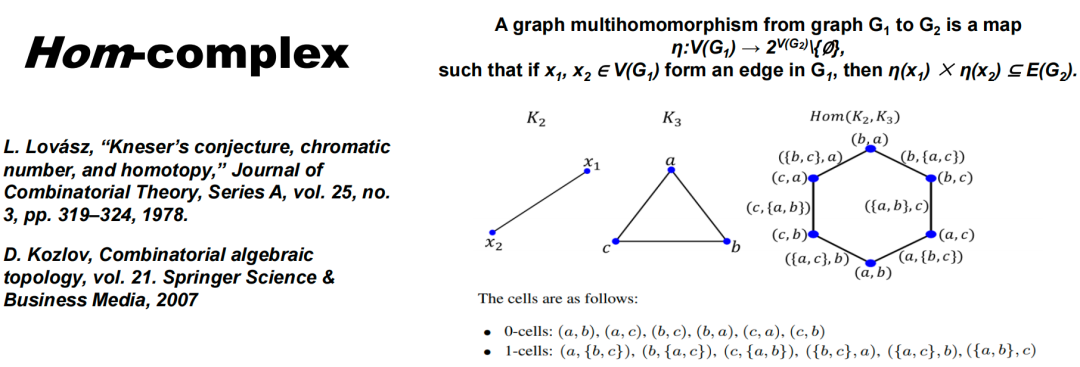 Figure 27. Hom ComplexAs shown in the figure, mapping x2 and x2 to the single-point set forms a zero simplex (0-cell), while mapping one of the points to a two-point set forms a one simplex (1-cell). All these mappings η form the complex Hom(K2, K3). When considering more complex connection relationships, such as using higher-order or convolution kernel-style relationships for mapping, this method can help generate new simplicial complexes, further reflecting the deep connections of the graphs under this specific kernel.
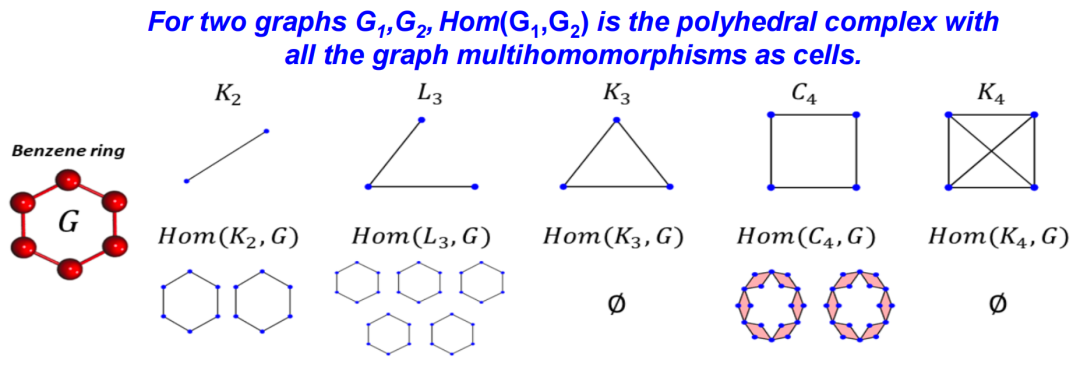 Figure 28. Example of Hom Complex3.5.4 Tor-algebraWe can also elevate the structure of simplicial complexes to consider more complex algebraic structures. For example, given a simplicial complex, define a set of polynomials and establish specific relationships between these polynomials (for example, Stanley-Reisner theory), thus obtaining an ideal structure and studying its properties, such as its Tor functor. In this way, the topological information of the graph is transformed into algebraic quantities, elevating simplicial complexes to an algebraic level for study.
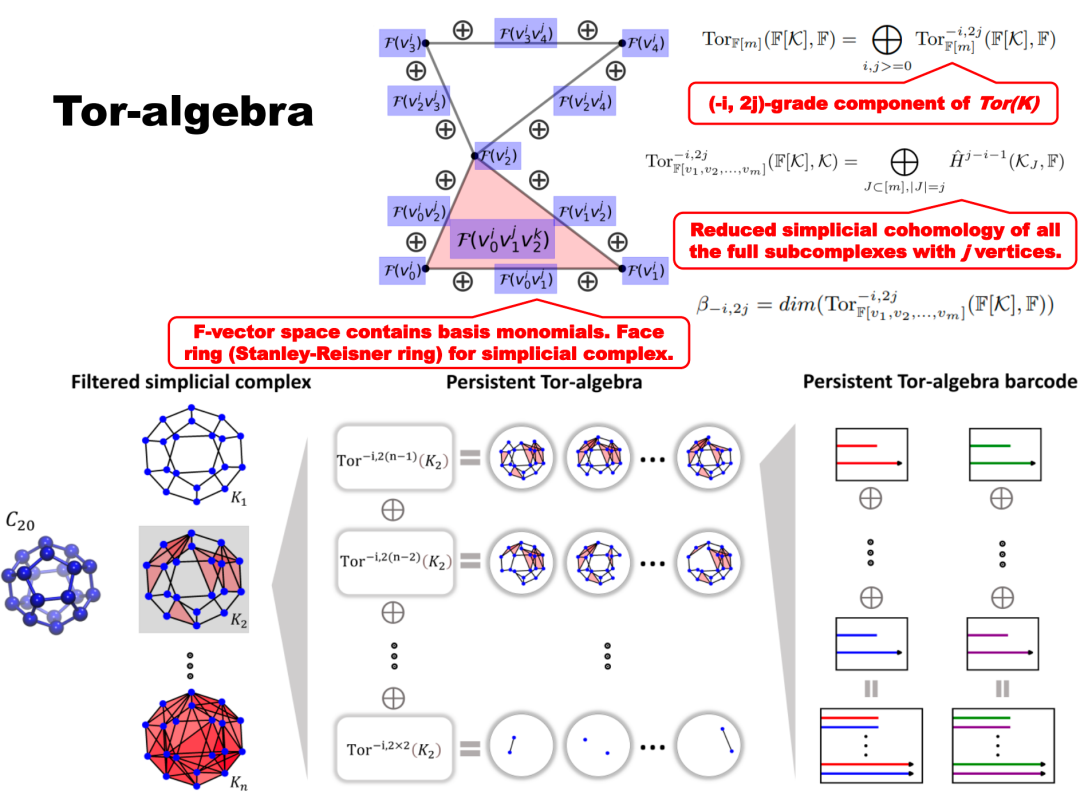 Figure 29. Tor Algebra
Xiang, L. I. U., and Kelin Xia. “Persistent Tor-algebra based stacking ensemble learning (PTA-SEL) for protein-protein binding affinity prediction.” ICLR 2022 Workshop on Geometrical and Topological Representation Learning. 2022.Persistent Tor-algebra (PTA) provides a powerful and effective new tool for biological research.
4. Graph Neural Networks Based on Simplicial Complexes
In the last part, Teacher Xia Ke Lin introduced graph neural networks based on simplicial complexes, which can be understood as an extension of graph neural networks. In graph neural networks, the core idea is to aggregate information from the neighbors surrounding a node through a message passing mechanism and pass it to the target node, iterating this process to achieve learning of the entire graph structure.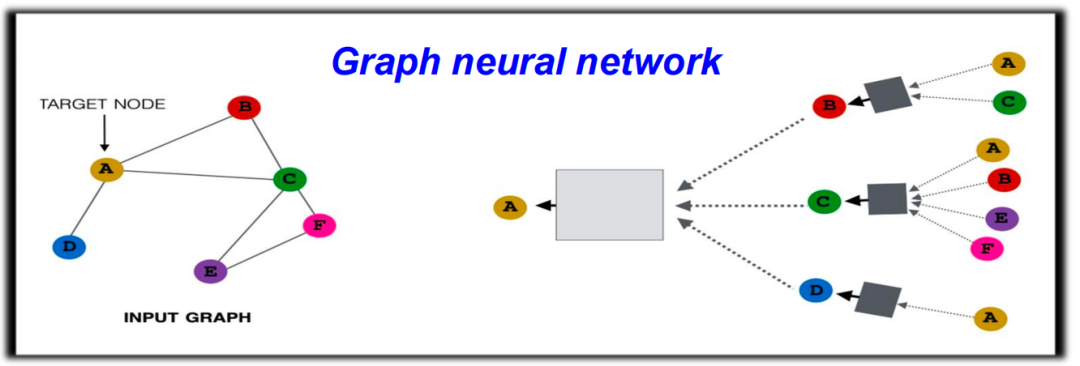 Figure 30. Graph Neural NetworkIn topological data processing, we no longer operate solely based on graphs; instead, we perform operations on higher-dimensional simplicial complexes or other complex structures (such as Stellar complexes). For example, in addition to performing information transmission at the point level, we can also operate similarly on edges, faces, or higher-dimensional simplices.
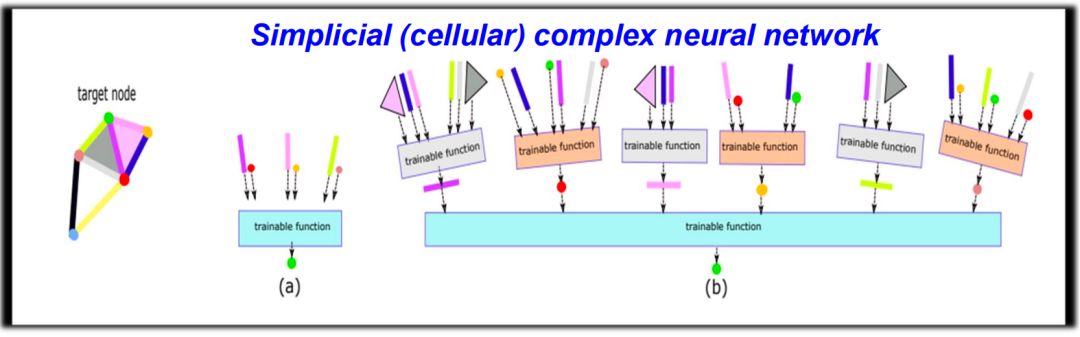 Figure 31. Information Transmission on Simplicial ComplexesIn conducting this complex topological data analysis, two very core concepts are: boundary operations and coboundary operations. In simple terms, boundary operations refer to finding all lower-dimensional faces from a given simplex. For instance, starting from an edge (1-simplex), we can find its two endpoints (0-simplex). Coboundary operations, on the other hand, are the reverse operation, meaning finding higher-dimensional simplices from lower-dimensional simplices.
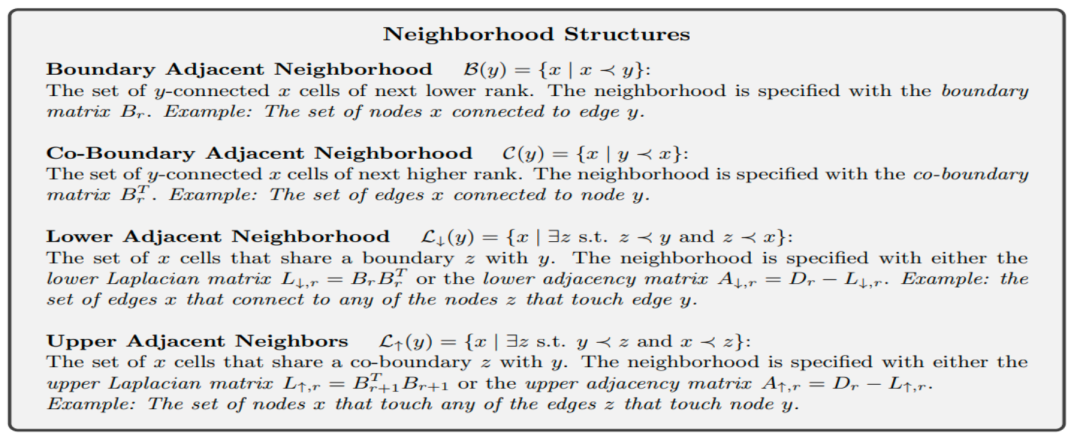 Figure 32. Boundary Operations and Adjacency RelationshipsIn addition, there are two important relationships: Lower Adjacency and Upper Adjacency. Both relationships describe adjacency in graphs but in different ways. Lower Adjacency refers to two edges being adjacent when they share a common vertex. In contrast, Upper Adjacency is stricter, stating that two edges are considered adjacent only when they share a higher-dimensional simplex (such as a triangle).By considering different connection methods, we can further depict different paths of information transmission in the data and construct a complex topological neural network by coupling information from different dimensions.
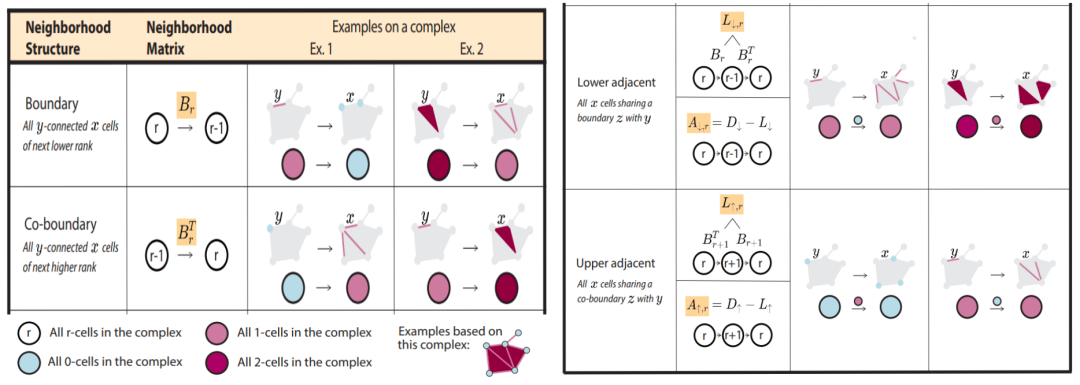 Figure 33. Topological Neural NetworkThis research area, combining topology and deep learning, is still relatively new but has attracted the attention of many scholars, with an increasing number of research works beginning to explore the use of topological data analysis to enhance the performance of deep learning models.
Hajij, Mustafa, Kyle Istvan, and Ghada Zamzmi. “Cell complex neural networks.” arXiv preprint arXiv:2010.00743 (2020).Topological neural networks
Reflections and Extensions
In Topological Data Analysis (TDA), we use simplicial complexes to express and understand complex data structures. However, researchers from other specialized fields may find such a description method confusing. To them, atoms (points) and covalent bonds (edges) have clear physical meanings, while the triangles in simplicial complexes seem to lack intuitive physical significance? In fact, in TDA, triangles capture the relationships among three elements. In the field of chemistry, this can be used to represent the angle information between two covalent bonds formed by three atoms (bond angle). Moreover, this angle information plays an extremely important role in molecular dynamics simulations. However, how to better define simplicial complexes and use them to describe higher-order interactions in systems remains a major issue in TDA modeling.Another challenge facing TDA is how to closely connect abstract mathematical invariants with practical problems. To address this issue, we need to understand the practical significance represented by these topological features. For instance, does the circular structure in the data reflect its physical, chemical, biological, or other practical information? Although TDA conceptually differs from traditional graph methods, it shows great superiority in characterizing complex high-order interactions, especially its ability to capture the most essential topological information of the system.In practical applications, we need to construct appropriate simplicial complexes to describe higher-order information and find suitable practical meanings for topological invariants, so that the true value of TDA models can be realized, and the interpretability and performance of the models can be enhanced. This requires us to deeply understand the problem context, tightly integrate mathematical tools with practical problems, and find a suitable application scenario to demonstrate the advantages of this method. Only in this way can TDA demonstrate its value and attract more people to try this new approach.Furthermore, in addition to topological data analysis, other mathematical invariants, including geometric invariants, algebraic invariants, and combinatorial invariants, can also be used for data representation and feature extraction. These models will further promote our exploration and characterization of the essential information of data, laying a solid mathematical foundation for improving the accuracy, interpretability, and transferability of machine learning models.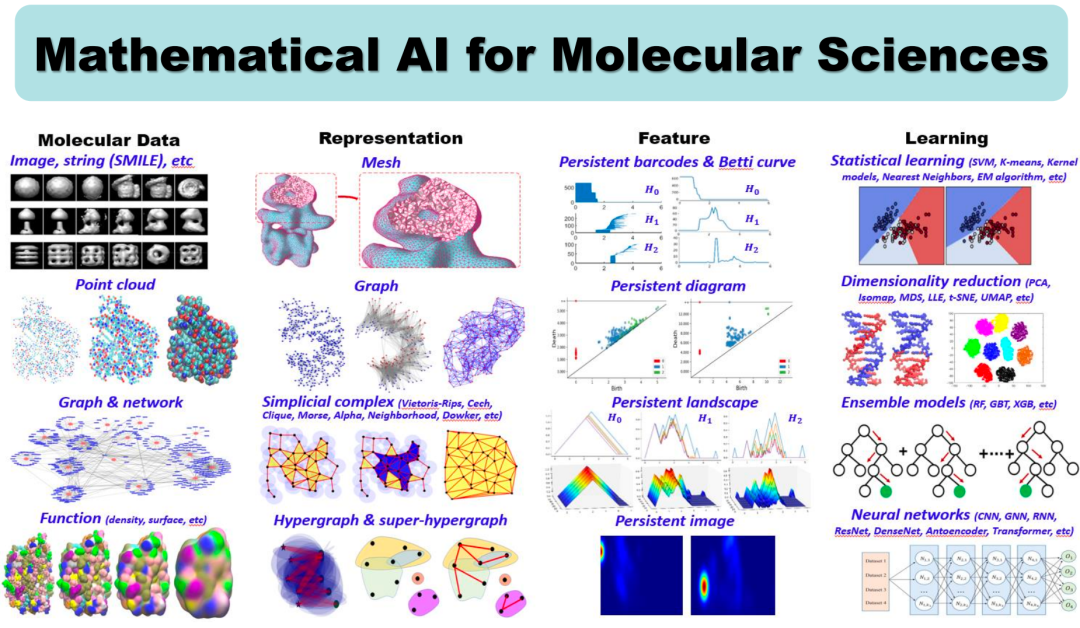 Figure 34. Molecular Data, Mathematical Representation, Data Characteristics, and Deep Learning
Reprinted content only represents the author’s views
It does not represent the position of the Institute of Physics, Chinese Academy of Sciences
If reprinting is needed, please contact the original public account
Source: JiZhi Club
Editor: Ting Yun
Recent Popular Articles Top10
↓ Click on the title to view ↓
1.Triangles Have Stability, So Why Do We Almost Never See Three-Legged Animals? | No.378
2.ఠ_ఠ Do You Treat Other People’s Letters as Emojis? Foreigners Haven’t Let Chinese Characters Off Either!
3.Is Boiling Water for Bowls and Chopsticks a Pre-Dinner Ritual That Can Kill Bacteria?
4.That Nobel Prize Certificate is So Beautiful, I Was Moved When I Saw Mo Yan’s!
5.Is Taking a Pulse Reasonable? The Physics Knowledge Behind Traditional Chinese Medicine Turns Out to Be Like This!6.Is There a Small Hole in Front of Your Ear? This is a Remnant Left by Your Fish Ancestors!7.The 2023 Nobel Prize in Physics Was Judged This Way!8.Are People with Messy Desks Creative Geniuses? What? You Can’t Even Find Where You Put the Documents…9.Why Doesn’t Rainfall Kill People?10.Don’t Understand the Nobel Prize in Physics?! No Fear! The Ig Nobel Prize Will Step In! Click here to view all past popular articles