Follow our official account to discover the beauty of CV technology
As an important source of information, charts can intuitively display data relationships and are widely used in information dissemination, business forecasting, and academic research [1]. With the explosive growth of internet data, automated chart understanding has gained widespread attention. Recently, general-purpose closed-source multimodal large models like GPT-4V, QwenVL-Max, and Gemini-Ultra have demonstrated certain capabilities in chart understanding. Open-source models such as Chartllama [2] and ChartAst [3] have also achieved strong performance in tasks such as chart question answering, chart summarization, and chart conversion. However, current open-source chart understanding models have the following three limitations:
-
The model parameter scale is enormous, making it difficult to deploy in applications. For example, Chartllama contains 13B parameters and cannot be directly deployed on consumer-grade graphics cards with less than 26 GB of memory [4]. -
The model is prone to numerical errors, especially when answering questions involving numerical calculations [3]. -
The model cannot efficiently process high-definition images, and many key pieces of information (such as OCR text) are often only clearly visible at higher resolutions. Moreover, considering that standard visual Transformers produce long sequences of visual features, directly increasing the input resolution leads to computational efficiency issues.
To address the above three issues, Renmin University of China and Alibaba Tongyi Lab mPLUG team have launched the multimodal chart understanding model TinyChart, which achieves SOTA levels in multimodal chart question answering with only 3B parameters (ChartQA: 83.6 > Gemini-Ultra 80.8 > GPT4V 78.5), demonstrating advantages in inference speed and capabilities in chart summarization, chart conversion, and chart redrawing. The relevant code has been open-sourced.
-
Paper link: https://arxiv.org/abs/2404.16635 -
Open-source link: https://github.com/X-PLUG/mPLUG-DocOwl -
Demo: https://huggingface.co/spaces/mPLUG/TinyChart-3B
To tackle numerical calculation issues, TinyChart employs programmatic chain reasoning, which can generate Python programs for calculations, significantly reducing computational errors. For high-definition image processing issues, considering that charts often contain large color blocks and blank areas, TinyChart introduces a visual feature fusion module to merge similar regions, effectively reducing the length of the visual feature sequence.
TinyChart Structure
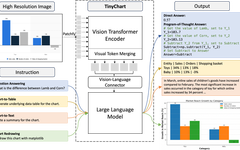
As shown in Figure 2, TinyChart adopts a common multimodal large model (MLLM) structure, consisting of a ViT-based visual encoder, an MLP-based text-image connection module, and a large language model. Unlike others, to efficiently encode high-definition images, TinyChart inserts a visual feature fusion module (Visual Token Merging) into each layer of the visual encoder [5].
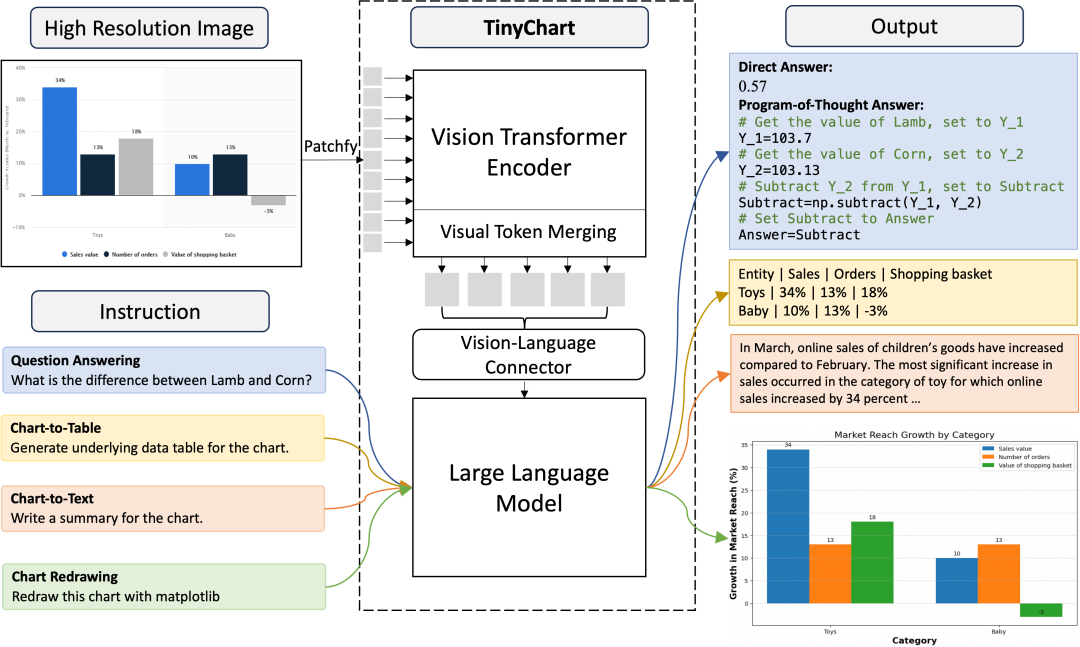
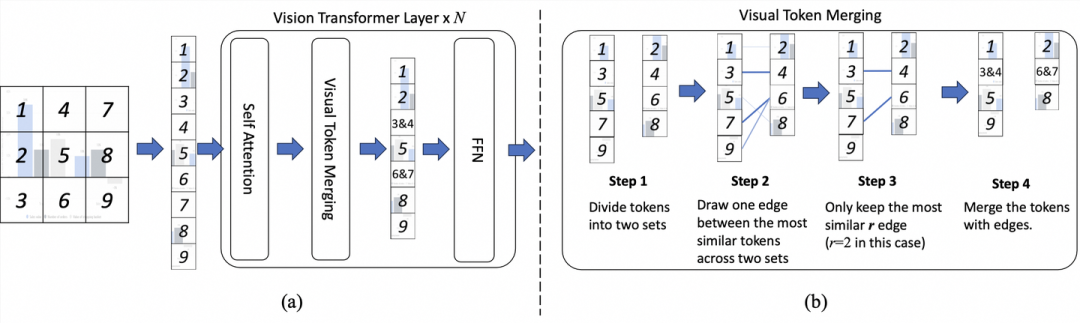
Figure 3 details the visual feature fusion module. It is located between the self-attention and FFN of each layer of the transformer, reducing the sequence length of high-resolution image features by merging similar visual features. Figure 3(b) illustrates the fusion process.
First, the visual feature corresponding tokens are divided into two non-overlapping sets. For each token in one set, the most similar token from the other set is found and connected. Then, the top 𝑟 edges with the highest similarity are retained.
Finally, the visual features connected by edges are averaged. This process can quickly identify similar visual tokens and perform feature fusion [5]. Through visual feature fusion, the length of the visual sequence is reduced by 𝑟 after each layer of processing, leading to a final sequence length reduction of 𝑁 × 𝑟, where 𝑁 is the number of ViT layers.
Programmatic Chain Reasoning
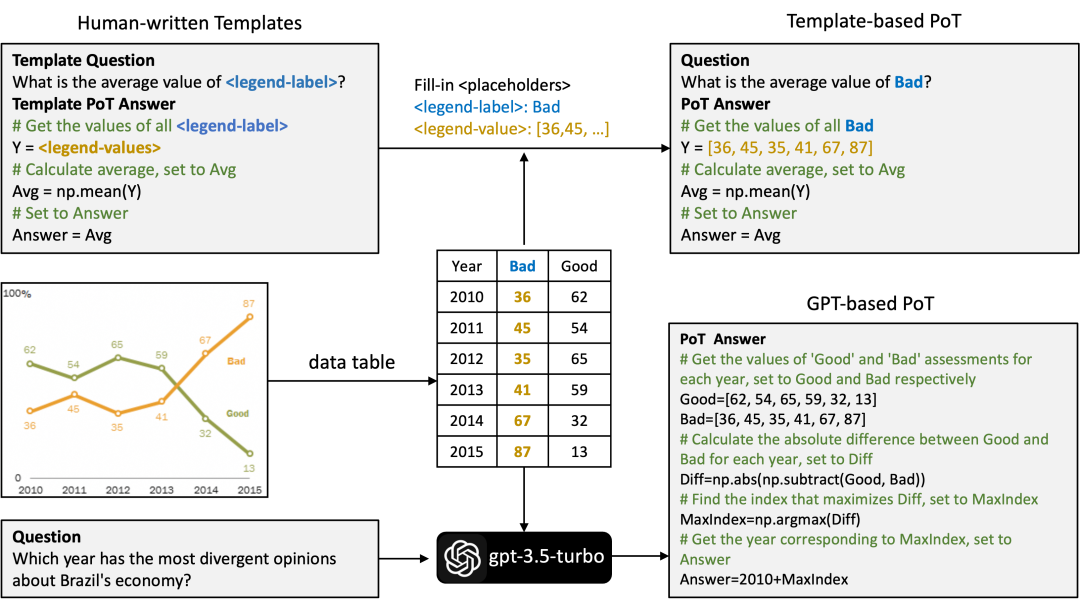
TinyChart incorporates programmatic chain reasoning during training. When inferring, for computational problems, it first generates a Python program, which is then executed by the Python interpreter to yield the final answer. Training this capability requires data support in the form of image-question-Python program pairs. To this end, we constructed the ChartQA-PoT dataset. As shown in Figure 4, this dataset is based on chart images from ChartQA [6], and the question-Python program pairs are constructed in two ways:
(1) Template-based approach: Constructing program templates with placeholders for questions, filling in the placeholders with specific chart data.
(2) GPT-based approach: Using gpt-3.5-turbo to generate Python answers for manually annotated questions in ChartQA, verifying the correctness of the answers by running the Python interpreter (comparing with standard answers). We provide the table data corresponding to the chart to gpt-3.5-turbo and give relevant in-context examples to prompt the LLM to generate similarly styled Python programs.
Experimental Results
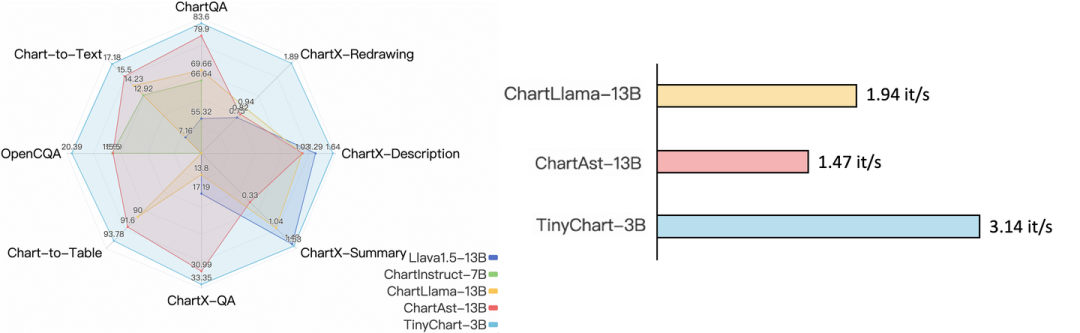
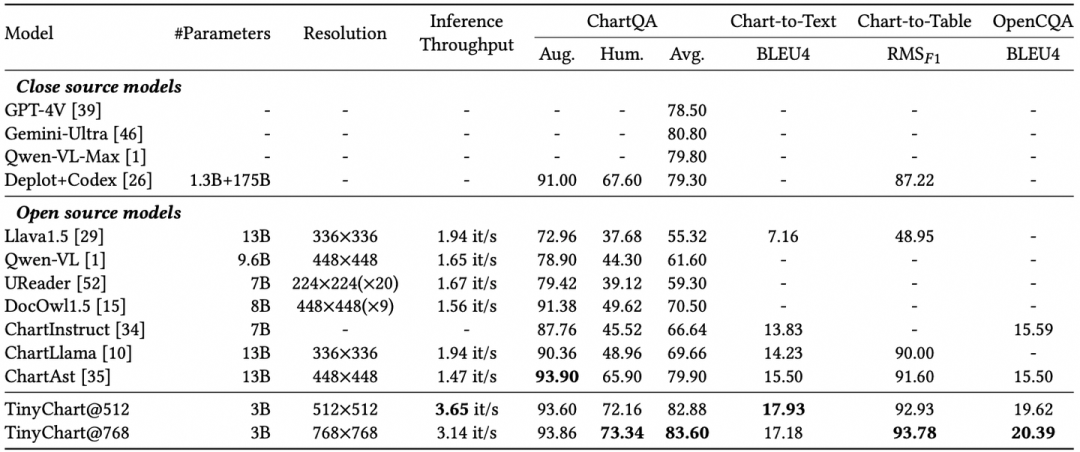
Table 1 shows TinyChart’s performance across multiple evaluation benchmarks, including chart question answering, summarization, and chart conversion. With only 3B parameters, TinyChart achieved the best performance on these benchmarks, even surpassing several closed-source multimodal large models like GPT-4V, Gemini-Ultra, and Qwen-VL-Max, thanks to its efficient programmatic chain reasoning and high-resolution visual image processing methods. Due to its smaller model size, TinyChart’s throughput during inference is also significantly higher than that of larger open-source models like ChartLlama and ChartAst.
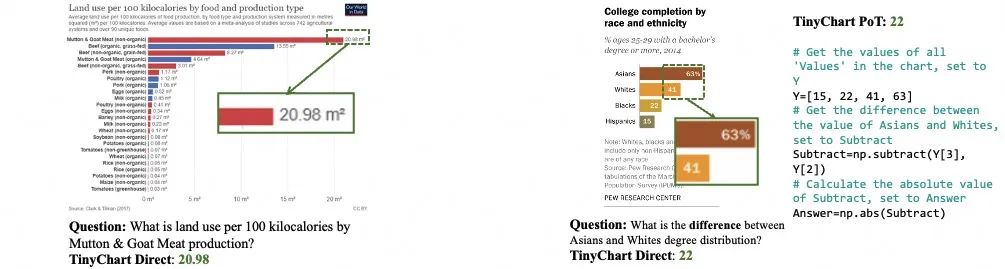
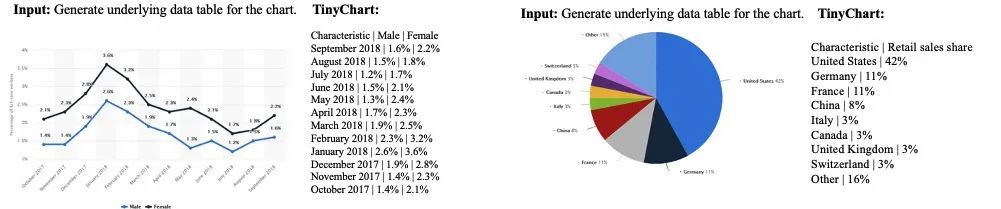
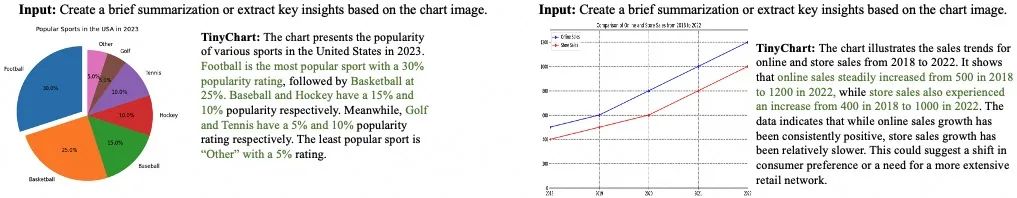
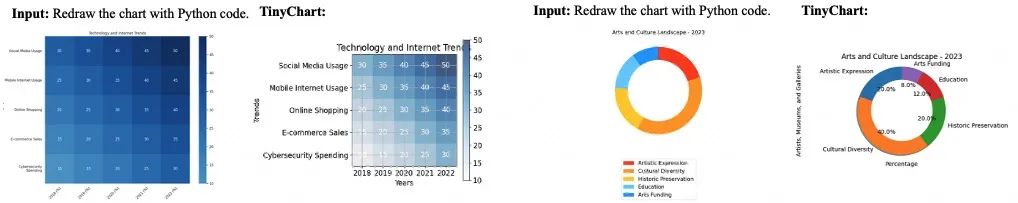
From the examples, it is evident that TinyChart can correctly understand chart content and perform tasks such as question answering, chart summarization, chart conversion, and chart redrawing.
Conclusion
TinyChart is a multimodal chart understanding large model with 3B parameters. Through programmatic chain reasoning and a visual feature fusion module, it achieves the best performance in various chart understanding tasks such as chart question answering, chart summarization generation, chart conversion, and chart redrawing, with significant advantages in inference speed and the ability to solve computational problems by generating Python programs. However, we have found that TinyChart still experiences hallucination issues during generation and currently does not support understanding Chinese charts. The team will continue to optimize TinyChart, and we welcome everyone to keep following and engage in friendly discussions!
References
[1] Kung-Hsiang Huang, Hou Pong Chan, Yi R. Fung, Haoyi Qiu, Mingyang Zhou, Shafiq Joty, Shih-Fu Chang, and Heng Ji. 2024. From Pixels to Insights: A Survey on Automatic Chart Understanding in the Era of Large Foundation Models. arXiv preprint. arXiv:2403.12027.[2] Yucheng Han, Chi Zhang, Xin Chen, Xu Yang, Zhibin Wang, Gang Yu, Bin Fu, and Hanwang Zhang. 2023. Chartllama: A multimodal llm for chart understanding and generation. arXiv preprint. arXiv:2311.16483(2023).[3] Fanqing Meng, Wenqi Shao, Quanfeng Lu, Peng Gao, Kaipeng Zhang, Yu Qiao, and Ping Luo. 2024. ChartAssisstant: A Universal Chart Multimodal Language Model via Chart-to-Table Pre-training and Multitask Instruction Tuning. arXiv preprint arXiv:2401.02384(2024).[4] https://www.zhihu.com/question/612046818/answer/3438795176[5] Daniel Bolya, Cheng-Yang Fu, Xiaoliang Dai, Peizhao Zhang, Christoph Feichtenhofer, and Judy Hoffman. 2023.Token Merging: Your ViT But Faster. In The Eleventh International Conference on Learning Representations.[6] Ahmed Masry, Xuan Long Do, Jia Qing Tan, Shafiq Joty, and Enamul Hoque. 2022. ChartQA: A Benchmark for Question Answering about Charts with Visual and Logical Reasoning. In Findings of the Association for Computational Linguistics: ACL 2022. 2263–2279.

END
Welcome to join the “Multimodal” group discussion 👇 Please note:Multimodal