
Weishi Ophthalmology has exclusively launched the “Angio-OCT Interpretation White Paper” series, which has successfully published multiple topics and received wide acclaim from ophthalmologists. In response to public anticipation, we continue to deliver new content. This issue’s special guest is Professor Yu Suqin from the First Affiliated Hospital of Shanghai Jiao Tong University, who will explain the unique uses of Angio-OCT in Multifocal Choroiditis (MFC).

Professor Yu Suqin, First Affiliated Hospital of Shanghai Jiao Tong University

Currently, MFC (Multifocal Choroiditis) is believed to include a group of diseases such as MCP and PIC.
MCP (Multifocal Choroiditis and Panuveitis) generally occurs in women aged 30-40 with myopia, mostly affecting both eyes, with inflammation in the anterior segment and vitreous. Lesions are often located in the peripheral retina, and the condition tends to recur, with more than 1/3 of patients developing CNV.
PIC (Punctate Inner Choroidopathy) predominantly affects women in their 20s-30s with myopia, mostly affecting both eyes, with no inflammation in the anterior segment and vitreous. Lesions are commonly found in the posterior pole of the retina, and the progression of multiple lesions can be inconsistent, with rare recurrences and over 1/2 of patients developing CNV.

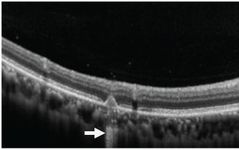
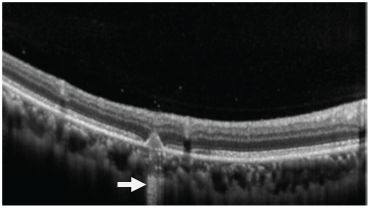
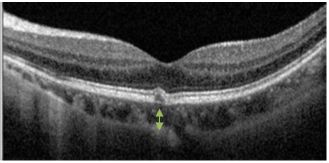
OCT tomographic images: Both MCP and PIC patients can be seen with small elevated lesions with high reflectivity in the outer retinal layers. Due to changes in the course of the disease, some lesions in MCP and PIC can show a high reflectivity “tail” on OCT. If the image is magnified, it will be found that the RPE above these high reflectivity “tail” areas is discontinuous, which leads to increased transparency during scanning, presenting a “tail” shape. Experiments have found that these lesions with “tails” are mostly infectious lesions, and the “tails” appear similar in OCT scans during the early and developing stages of the disease.
OCT: A band-like high signal appears beneath the elevated lesion (arrow)

OCT: A band-like high signal appears beneath the elevated lesion (arrow)
OCT enhanced scanning (deep enhancement mode): MCP and PIC show local thickening of the choroid at early active lesions, and after treatment with steroids and other therapies, as the lesions regress, the choroid also undergoes thinning and atrophy.
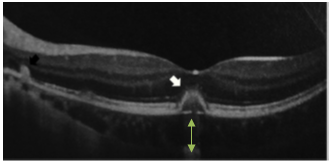
OCT: Overall thinning of the choroidal thickness after treatment
OCT: Low reflectivity signal in the choroidal layer, with lumen dilation
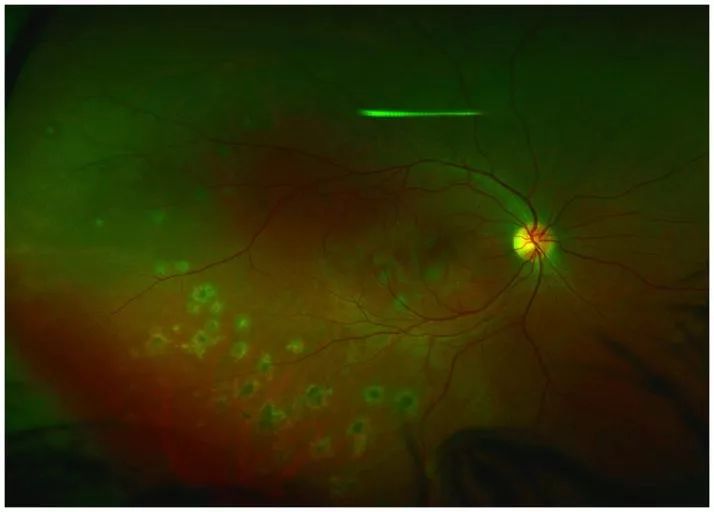
Spontaneous fluorescence: In both MCP and PIC, regardless of the size and location of the lesions, during the active phase, low spontaneous fluorescence points are often surrounded by high spontaneous fluorescence, which turns into low spontaneous fluorescence during the chronic phase. In near-infrared spontaneous fluorescence, the spontaneous fluorescence color of active lesions deepens, and the contours become clearer.
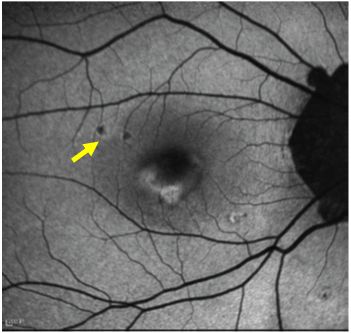
Short-wavelength fundus spontaneous fluorescence: low fluorescence lesions surrounded by high fluorescence (yellow arrow)
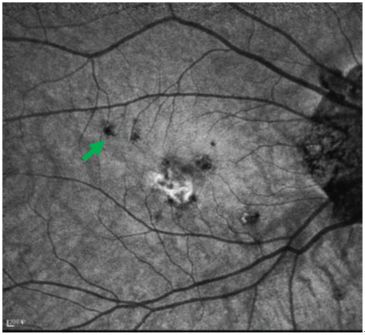
Near-infrared spontaneous fluorescence: the lesion has a deep color and clear outline (green arrow)
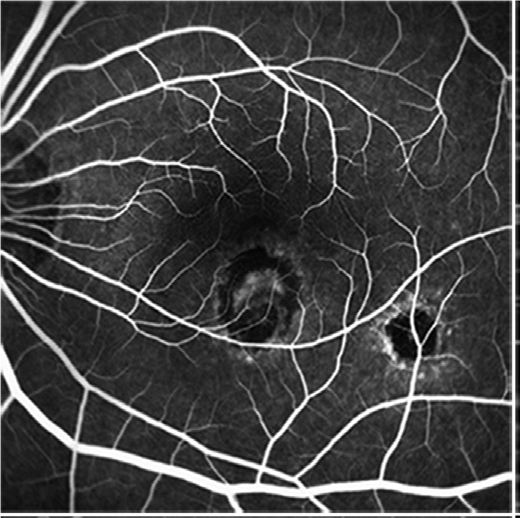
Early imaging: lesions in the macular area show weak fluorescence
Late imaging: lesions in the macular area show high fluorescence, surrounded by low fluorescence formed by subretinal fluid
MCP patients have inflammatory cells in the vitreous, while PIC patients do not, which is considered one of the significant differences between the two diseases. Research by Richard F. Spaide and others suggests that both MCP and PIC involve the outer retinal layers and the sub-RPE area, and their clinical manifestations, imaging morphology, and drug treatment responses are quite similar. Therefore, the necessity to differentiate between these two diseases has diminished. MCP and PIC are more like different clinical stages of the same disease rather than completely isolated conditions. Hence, the term MFC is now commonly used internationally to replace the previous MCP and PIC.

In the natural course of MFC, the most challenging and perplexing issue for clinicians is the differentiation between CNV and infectious lesions. The judgment of the nature of the lesions determines the treatment plan and the prognosis for the patient. Yet, these two types of lesions can occur separately or simultaneously. In the past, we used angiography combined with OCT for diagnosis, which could determine the location, number, and activity of the lesions, but there remained a problem: on OCT, some CNV and infectious lesions both present as high reflectivity signals in the outer retinal layers and RPE, and both show fluorescein leakage in late angiography, which complicates disease diagnosis.
Now with Angio-OCT, we can perform layer-by-layer scanning of the retinal plane using En-face images to determine the morphology and layer of the lesions, and by overlaying blood flow signals, we can observe whether there is blood flow present, thus resolving the issue of whether it is CNV or infectious lesions.
Additionally, the quantitative features of Angio-OCT can calculate blood flow density, lesion size, etc., allowing tracking of the progression of the lesions and the effects of drug treatment. Utilizing Angio-OCT to clarify the nature of the lesions, their progression, and treatment effects can more accurately guide the formulation of clinical treatment plans.

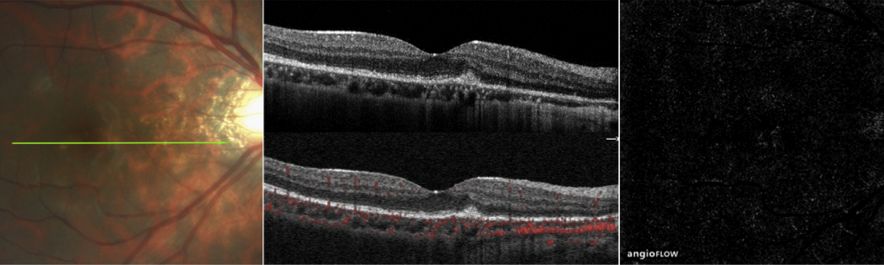
Case 1.
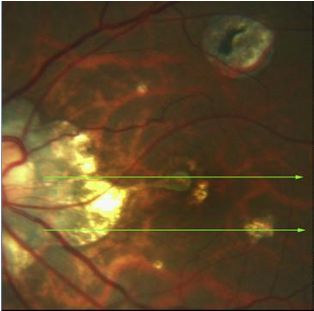
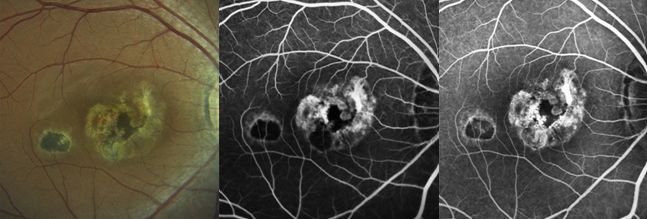
Fundus color photograph of the left eye of an MFC patient, indicating the presence of CNV in the macular area, with a yellow lesion in the temporal inferior region of the macula
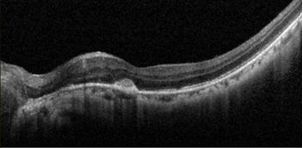
OCT image shows a high reflectivity lesion beneath the macular area
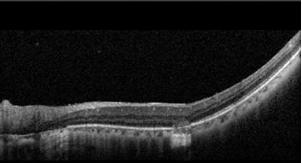
OCT image shows a moderately reflective lesion in the temporal inferior outer retinal layer
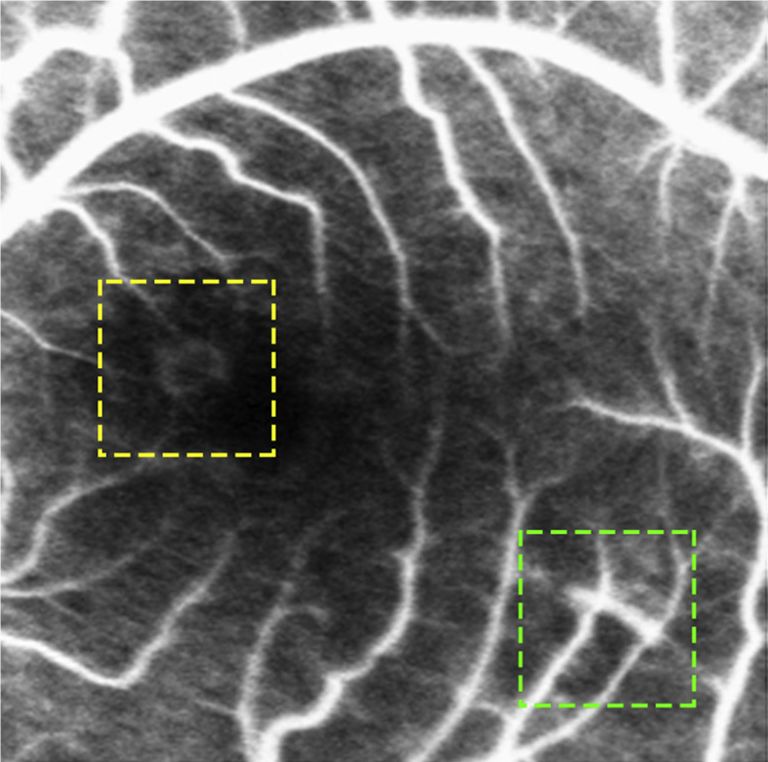
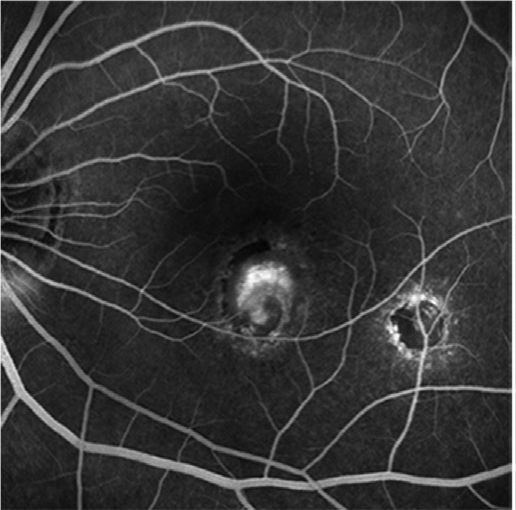
The yellow box corresponds to the lesion at the macula, and the green box corresponds to the temporal inferior lesion. In early imaging, both lesions are almost simultaneously highlighted
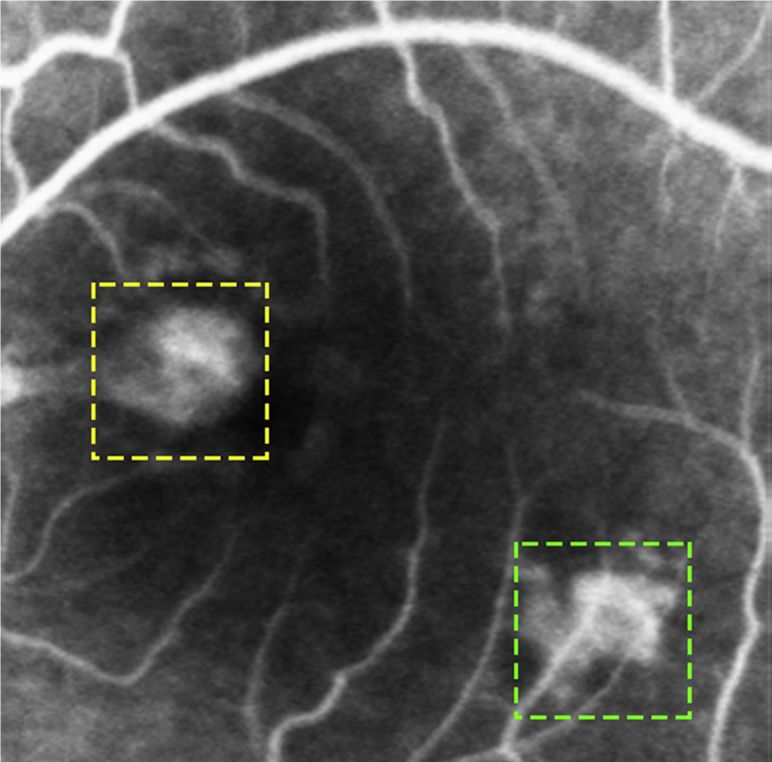
In late imaging, both lesions show fluorescein leakage
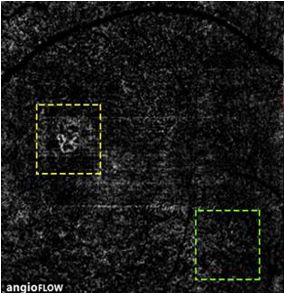
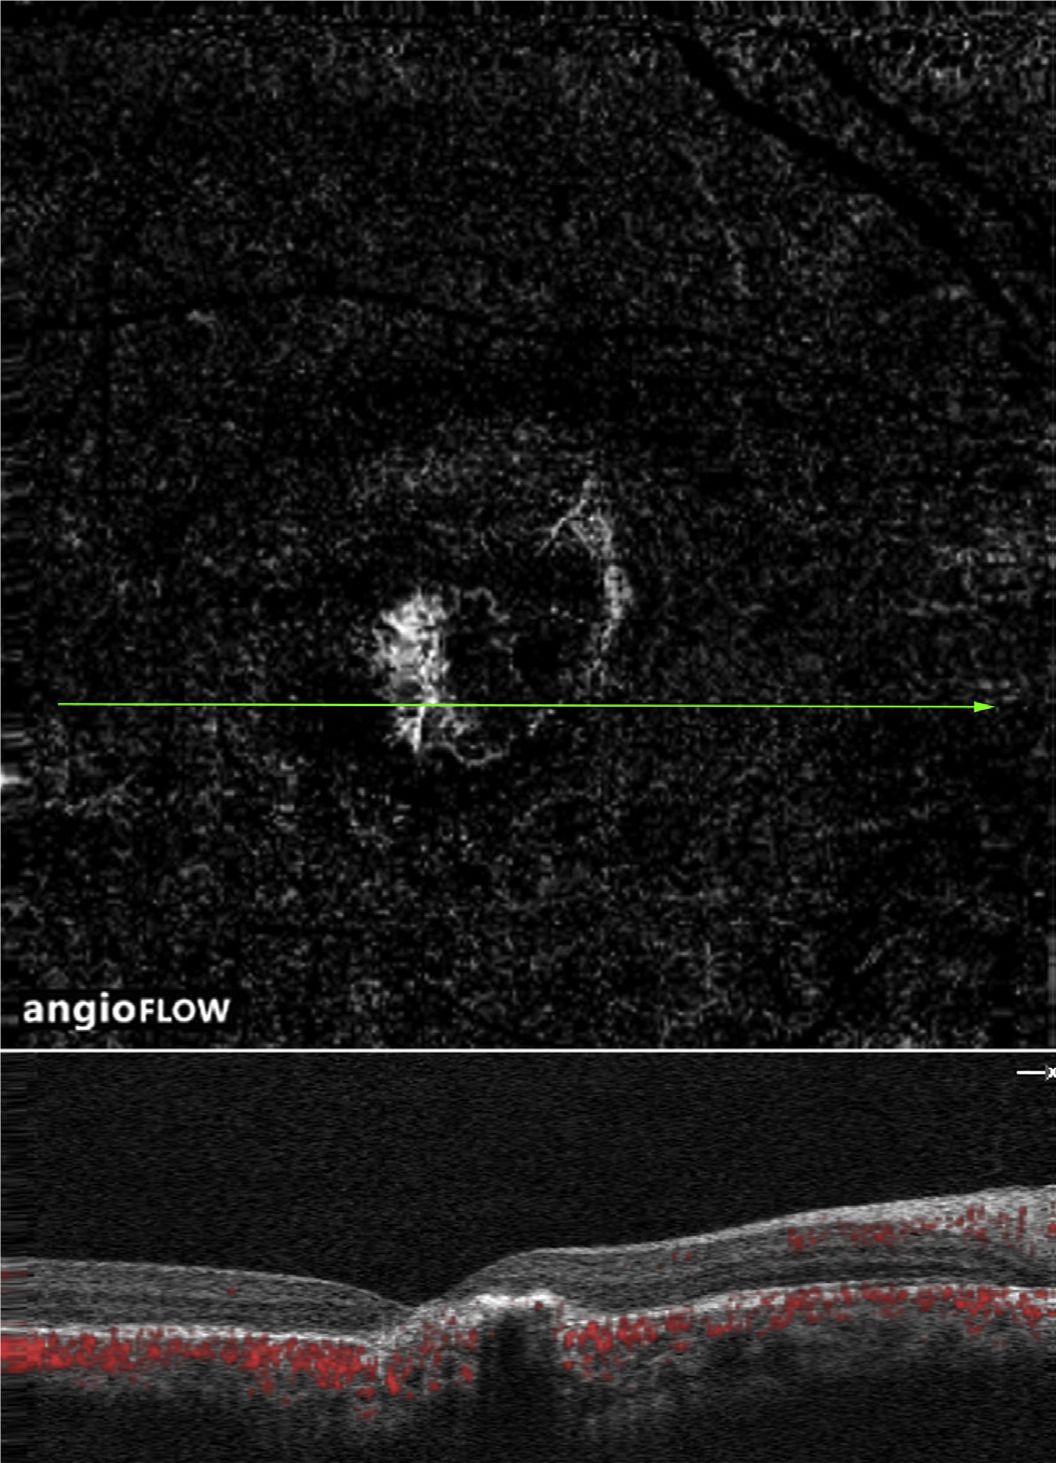
Optovue OCTA’s En face scan: CNV from the choroid in the macular area, with no CNV seen in the temporal inferior lesion
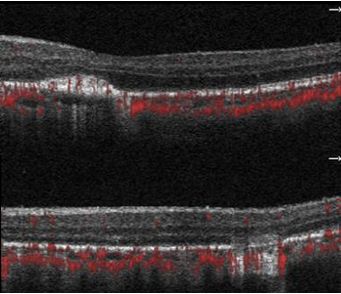
Optovue OCTA blood flow tomographic image.
Top image: Blood flow signal in the macular area lesion
Bottom image: No blood flow signal in the temporal inferior lesion
Case 2.
Left: Fundus color photograph of the right eye of an MFC patient at the initial onset of the disease.
Middle: OCT shows a moderately high reflectivity lesion beneath the retina, with discontinuity in the ellipsoid zone, and no blood flow signal at the elevated area.
Right: Optovue OCTA En face image shows no significant abnormal blood flow signal, indicating an infectious lesion without CNV growth at this time.
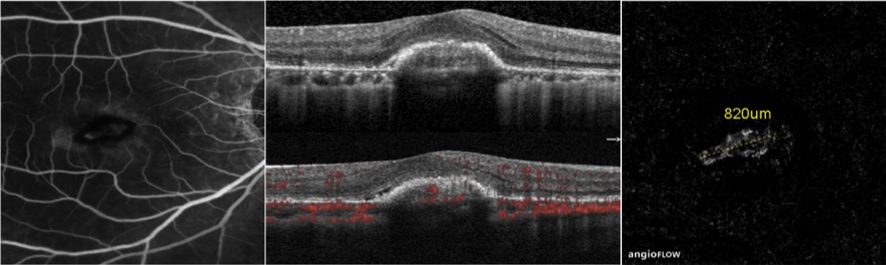
Left: The patient returned for a follow-up two months later, with angiography revealing a high fluorescein leakage lesion in the macular area.
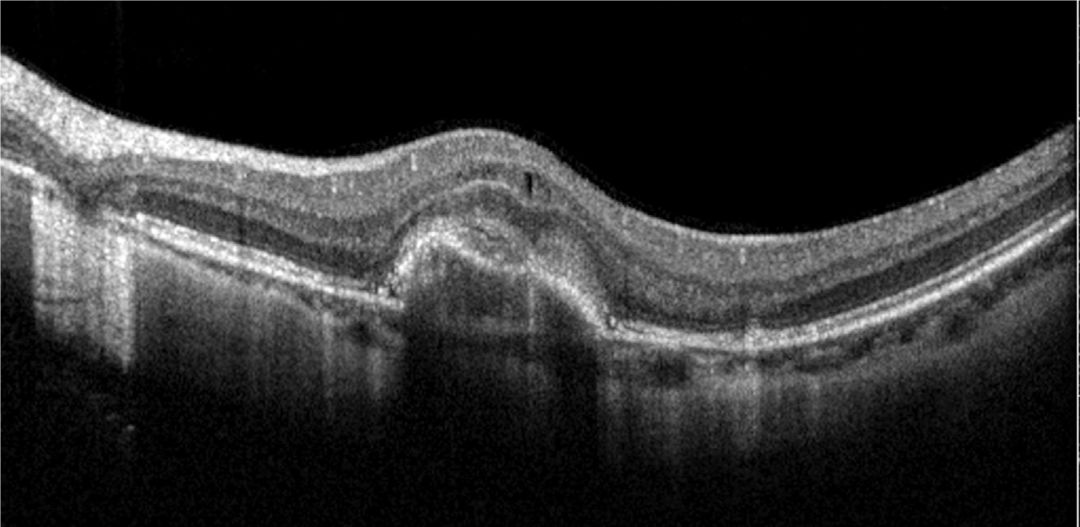
Middle: Optovue OCTA shows a high reflectivity lesion beneath the retina, with blood flow signals within the lesion.
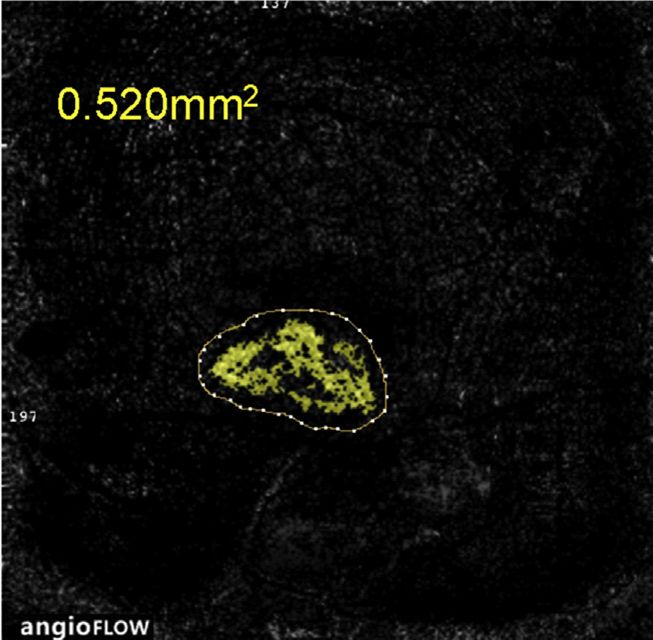
Right: Optovue OCTA En face image scan shows a clearly defined choroidal neovascularization (CNV) with a diameter of 820um measured using built-in AngioAnalytics, indicating the emergence of secondary CNV.
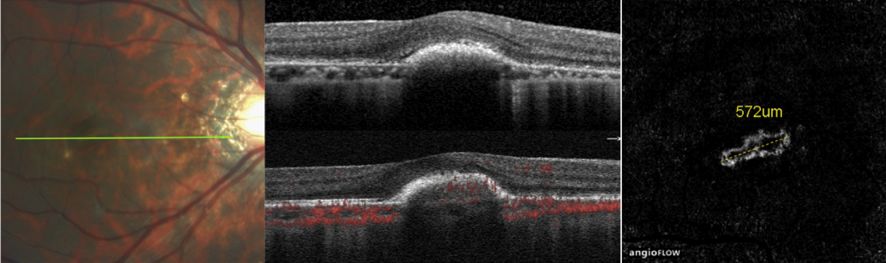
Left: Fundus color photograph of the patient three months after anti-VEGF treatment.
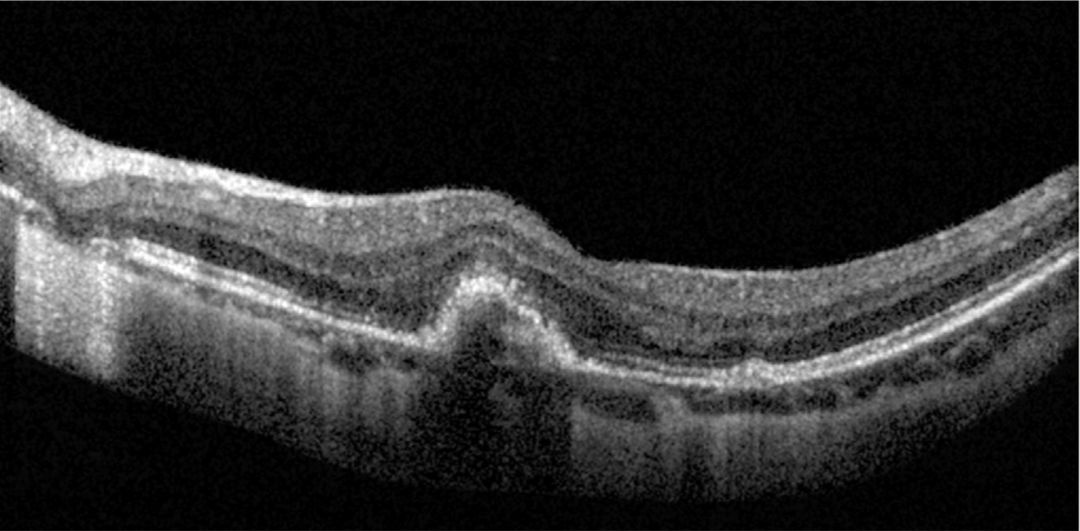
Middle: OCT shows absorption of subretinal fluid and reduction of the lesion elevation.
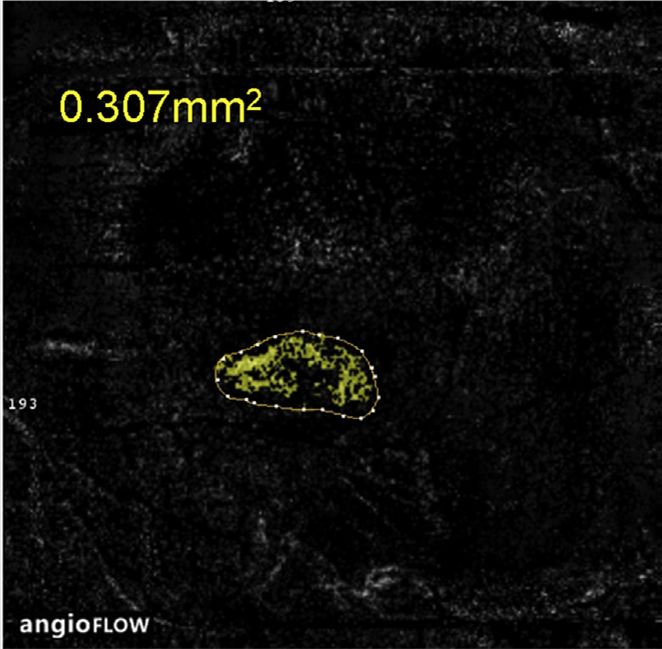
Right: Optovue OCTA En face image shows a decrease in CNV diameter compared to before treatment (measured value 572um using built-in AngioAnalytics).
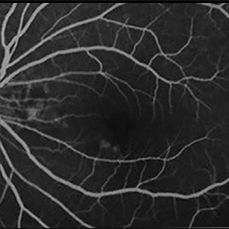
Case 3.
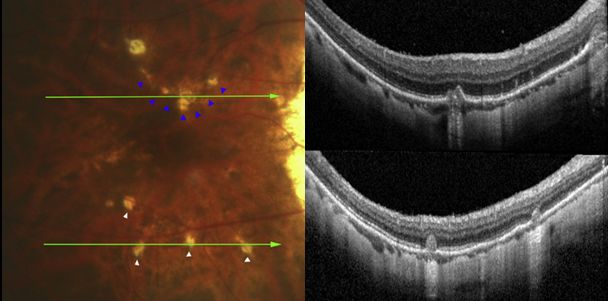
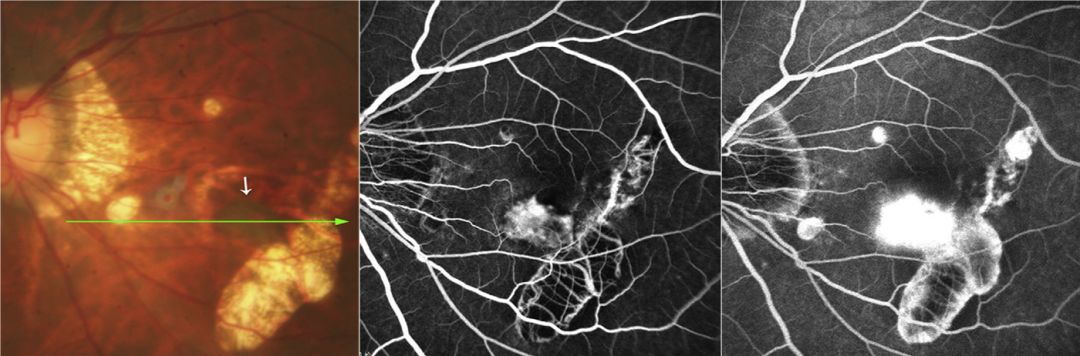
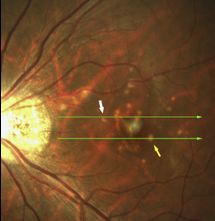
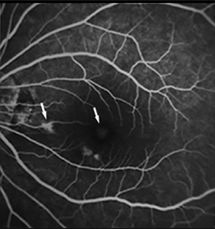
Fundus color photograph of the right eye of an MFC patient: Blue arrow indicates the lesion above the macula, multiple white arrows indicate lesions below.
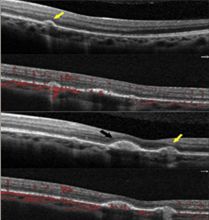
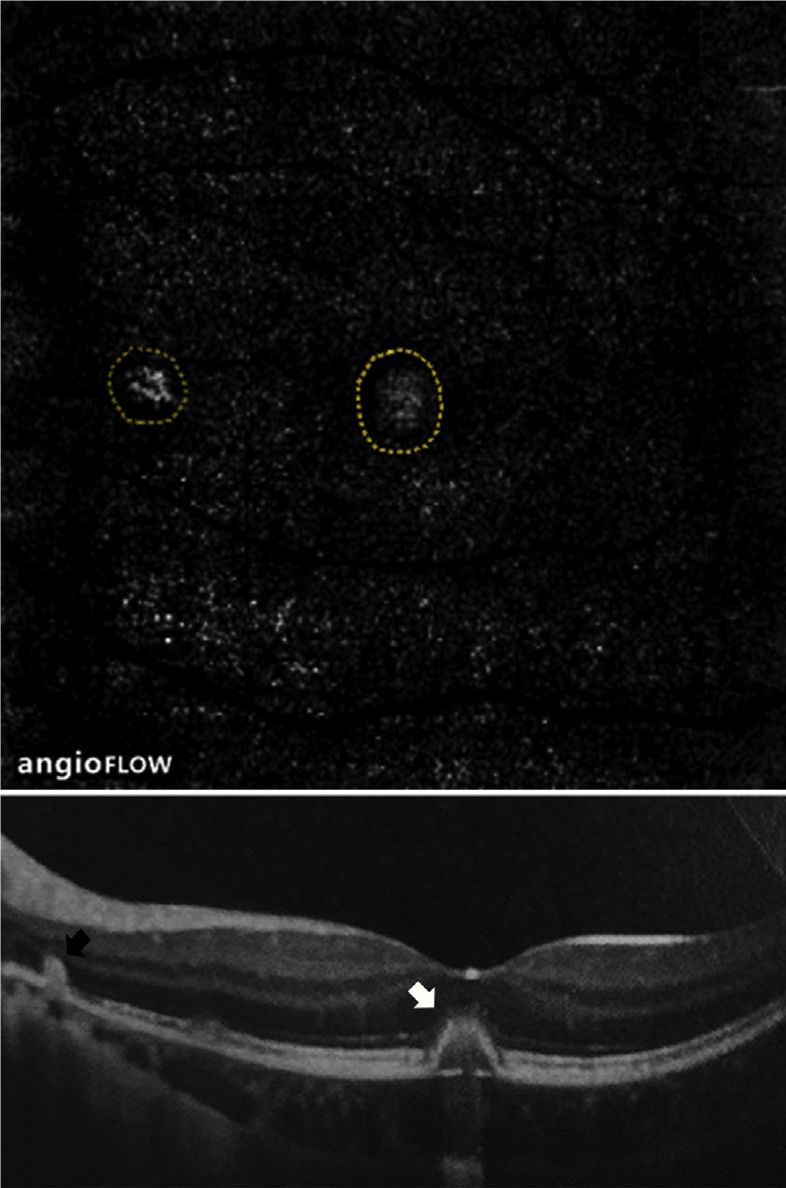
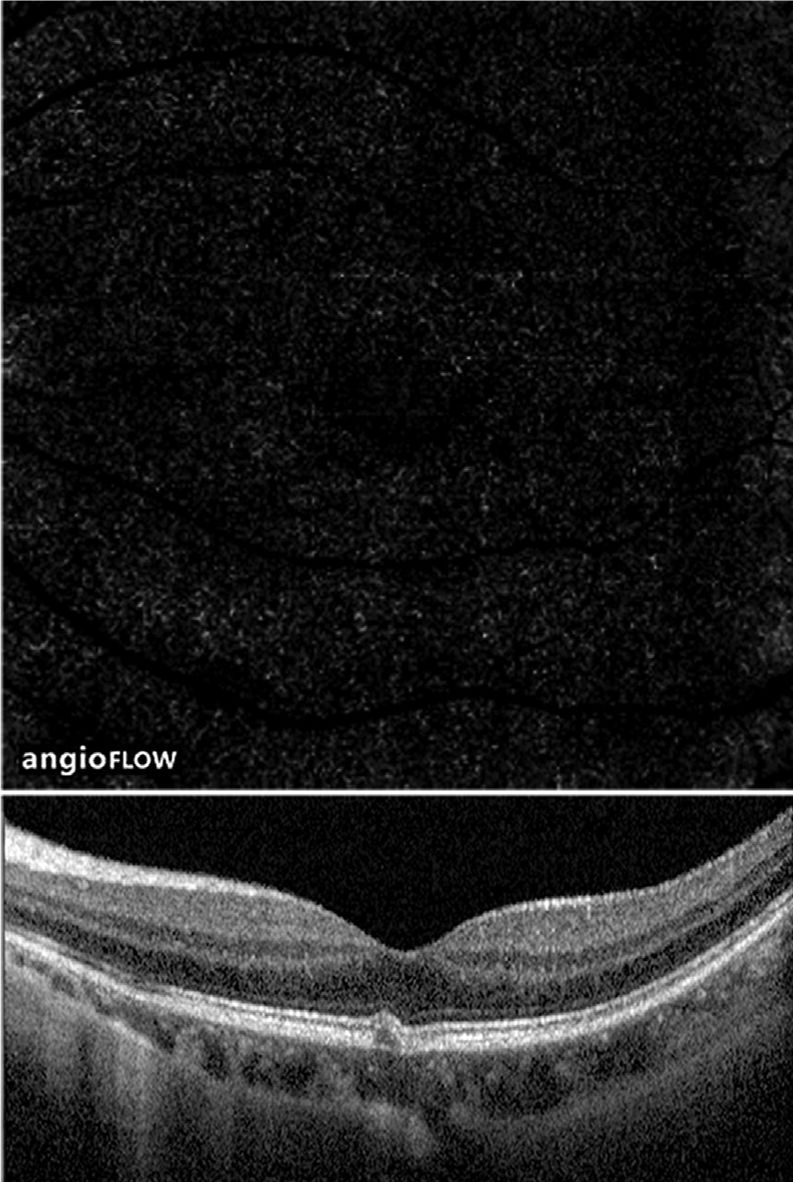
Top image OCT: Scanning at the position indicated by the blue arrow in the color photograph: localized elevation beneath the RPE.
Bottom image OCT: Scanning at the position indicated by the white arrows in the color photograph shows multiple moderately reflective elevated lesions affecting the outer retina, with RPE discontinuity.
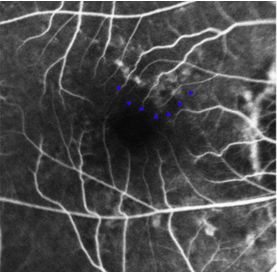
Early imaging: High fluorescence is visible at the location corresponding to the blue arrow in the color photograph
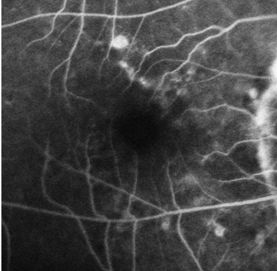
Late imaging: No significant leakage observed
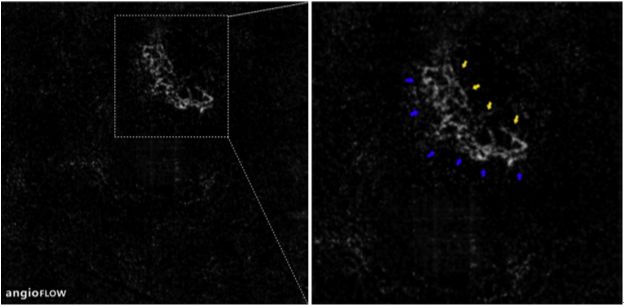
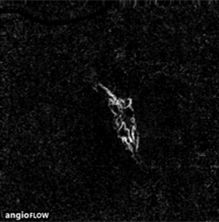
Optovue OCTA En face image shows: A fan-shaped neovascularization at the position indicated by the blue and yellow arrows in the color photograph, indicating that this CNV is quiescent.
Case 4.
Left: Fundus color photograph shows a grayish-blue neovascular lesion (white arrow) adjacent to the band-like atrophy area in the temporal inferior region of the macula.
Middle: Early imaging shows strong fluorescence at the position indicated by the white arrow.
Right: Late imaging shows significant fluorescein leakage.
OCT scan in the direction of the green arrow in the top image: High reflectivity signal penetrates the elevated RPE into the outer retina, with low reflectivity in the choroid below.
Optovue OCTA En face image: and the area of new blood vessels measured using built-in AngioAnalytics.
One week after anti-VEGF treatment OCT: The elevation of the lesion decreases, and the subretinal fluid is absorbed.
Optovue OCTA En face image: Significant reduction in the area of new blood vessels after treatment.
Case 5.
Left fundus color photograph: Multiple yellow dot-like lesions around the macula
Top two OCT images: The green line in the upper left image scans the RPE elevation without blood flow signals
The bottom two OCT images: The green line in the lower left image scans two RPE elevated lesions, one with blood flow signal (black arrow) and the other without blood flow signal (yellow arrow)
Optovue OCTA En face image: Clearly defined CNV lesion in the macular area.
Case 6.
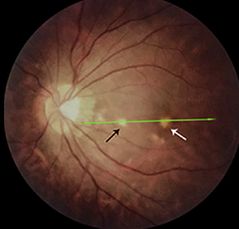
Fundus color photograph: Two dot-like lesions in the posterior pole (black and white arrows)
Early imaging: No significant high fluorescence observed
Late imaging: High fluorescence at the position indicated by the white arrow
Pre-treatment Optovue OCTA En face image: Visible new blood vessels at the position indicated by the black and white arrows
OCT image: Two elevated lesions
Post-treatment OCTA En face image: Regression of new blood vessels
OCT image: Elevated lesions flatten
Case 7.
Left: Fundus color photograph of a long-term MFC patient showing old atrophic scar lesions in the posterior pole.
Middle: Early imaging shows fluorescence at the pigment loss area, with fluorescence masking at the pigment proliferation area.
Right: Late imaging shows no expansion of fluorescein leakage, with partial fluorescence staining of the lesions.
Optovue OCTA En face image: Blood flow signal seen in the scar atrophic lesion area
OCTA blood flow tomographic image: No fluid accumulation in the retinal layers and beneath the retina, with blood flow signals in the atrophic area being quiescent CNV and visible choroidal vessels.

-
Using Angio-OCT allows for convenient observation of the natural course of MFC, leading to a deeper understanding of its pathophysiological changes.
MFC has two pathological changes: CNV and infectious lesions.
CNV often secondary to infectious lesions.
CNV can be exudative active or non-exudative quiescent.
-
Angio-OCT distinguishes between CNV and infectious lesions through blood flow signals.
Determining the shape, location, classification, and quantifying the area of CNV.
Plays an important role in guiding treatment plan formulation and efficacy evaluation.

Although Angio-OCT examinations are fast and non-invasive, sometimes image artifacts may occur, requiring the reader to accumulate certain experience to discern the truth from the false. With the advancement of technology, the scanning speed of Angio-OCT will become faster, the range larger, and artifacts fewer, not only measuring blood flow density but also blood flow velocity, bringing more convenience to disease diagnosis, observation of disease progression, and follow-up evaluations.
Popular Articles

Click the image to read
Professor Sun Xinghuai: Angio OCT, Detecting Glaucoma Earlier

Click the image to read
Professor Xu Xun: Interpretation of Pathological Myopia Angio OCT

Click the image to read
Professor Bruno Lumbroso: How to Write Clinical OCTA Reports

Click the image to read
Professor Liu Wu: The Edge of Interface Angio OCT

Click the image to read
Professor Peng Xiaoyan: Can Angio OCT Replace FFA?

Click the image to read
Professor Dai Hong: New Normal in Diagnosis and Treatment of Macular Degeneration

Click the image to read
Professor Wei Wenbin: Clinical Applications of Angio OCT

Click the image to read
Professor Wei Wenbin: Basics of Angio OCT

