[Brief Q&A]
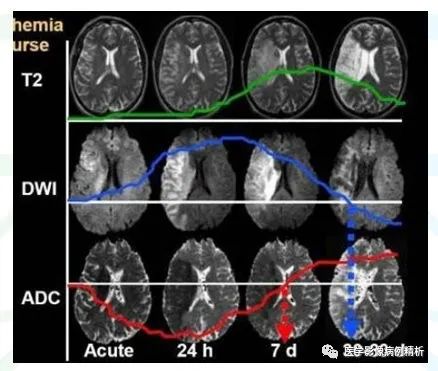
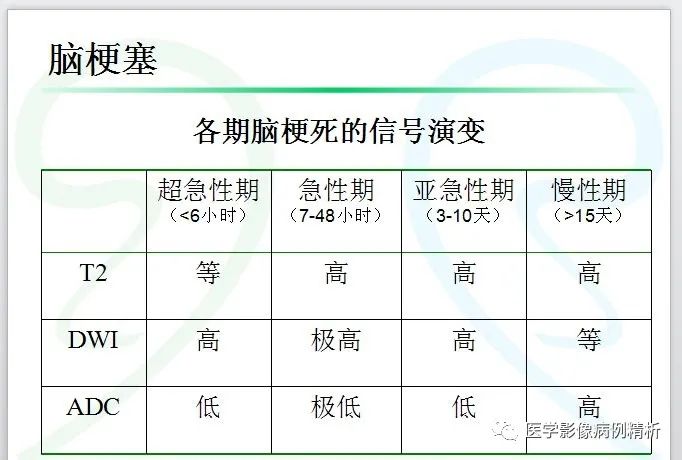
Some literature suggests that there is a difference in area between the irreversible brain infarction region indicated by high signals in DWI and the low perfusion area indicated by PWI, termed the penumbra, which is a temporarily ischemic area that can be salvaged within the treatment window.
The value of DWI lies in displaying the location and size of ischemic lesions before permanent damage occurs.The difference between ADC values at the center and periphery of the lesions is significant; in the acute phase, DWI shows larger lesion areas than T2WI, indicating the ischemic penumbra.
FLAIR sequence, known as Fluid Attenuated Inversion Recovery, reduces the signal from free water or ionic water and bound water. Ionic water is mainly found in cerebrospinal fluid in the ventricles and subarachnoid space, and pure liquid cysts. Due to its simple composition, water molecules can move freely and rapidly; bound water is formed when free water molecules bind to hydrophilic macromolecules such as proteins, creating a layer of bound water that cannot move freely. In conventional T2WI, both ionic and bound water are high signals. Taking brain tissue as an example, cerebrospinal fluid, arachnoid cysts, and softened lesions after cerebral embolism are ionic water, while protein-containing cysts, hemorrhagic cysts, epidermoid cysts, vasogenic edema, interstitial edema, and solid tumors are all bound water. T2FLAIR can reduce the signal from ionic water, displaying the nature of lesions containing ionic water or the lesions at the edges of ionic water, while correspondingly increasing the signal contrast of bound water, making it present a very high signal, facilitating the discovery of lesions.
Question 2: Is there diagnostic significance in T1FLAIR and T2FLAIR?
IR refers to Inversion Recovery sequence, mainly applying a 180° inversion pulse, characterized by TI time (Time Inversion). It has two features: T1 has the best contrast, significantly higher than SE T1WI; only one echo is collected at a time, with a very long TR time. The acquisition time for FLAIR sequence is significantly shorter. T1FLAIR and T2FLAIR have different diagnostic significance in clinical applications. T1FLAIR has excellent anatomical contrast, significantly increasing the T1 contrast between gray and white matter in the brain, making it highly valuable for studying myelination in children and showing good diagnostic performance for brain tumors and other lesions. T2FLAIR mainly reduces the signal from ionic water, such as cerebrospinal fluid, clearly displaying lesions adjacent to cerebrospinal fluid or judging whether lesions contain ionic water, increasing the signal contrast between bound water and normal tissue, such as clearly showing cystic changes, necrosis, and extensive edema signals surrounding tumors.
Question 3: Are FLAIR and Dark-Fluid the same in clinical use?
FLAIR and Dark-Fluid (black water sequence) are the same sequence but are referred to by different names by different companies. Siemens calls it Dark-Fluid. Both are mainly used for diagnosing the central nervous system. They are used to display components containing ionic and bound water. It is noted that there is a consensus that FLAIR should directly apply FS fat suppression or STIR fat suppression, which makes lesion visibility more apparent, but does not provide more diagnostic assistance.
2020.12.30
[Imaging Thinking] 057 Elderly Female with Sacral Invasion and Rich Blood Supply Lesion in the Sacral Canal? Pathological Result: Cavernous Hemangioma
[Imaging Quiz] Elderly Patient with T1 High Signal Bilateral Basal Ganglia, Your Diagnosis? Discharge Diagnosis: Hepatic Encephalopathy Manganese Deposition
The following images are derived from “Easy Learning of MRI 100 Questions” by Jin Erhu and Niu Mingzhe.
Question 1: What are diamagnetism, paramagnetism, superparamagnetism (ferromagnetism), and ferromagnetism? What substances and tissues do they include?
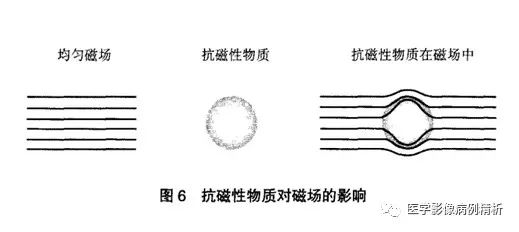
Magnetic susceptibility, also known as magnetic permeability, is the degree or capacity of a substance to be magnetized under an external magnetic field. It is represented by the symbol X. The magnetism of a substance is classified from weak to strong as diamagnetism (X<0), paramagnetism (X>0), superparamagnetism (ferromagnetism), and ferromagnetism (X>>0). Diamagnetism indicates that a substance’s own magnetic moment is opposite to the direction of the external magnetic field, weakening the effect of the magnetic field. This is mainly due to the paired electrons in the constituent atoms, which do not form a net magnetic moment.
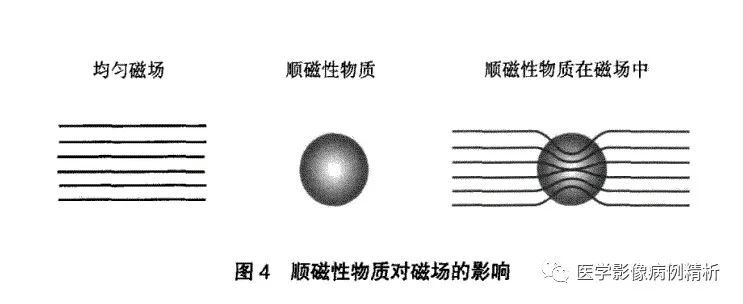
Paramagnetism indicates that a substance’s own magnetic moment is aligned with the direction of the external magnetic field, slightly enhancing the magnetic field’s effect. This is mainly due to the unpaired electrons in the constituent atoms, forming a disordered net magnetic moment.
Ferromagnetism indicates that metals (such as iron, nickel, cobalt) in solid or crystalline form have their own magnetic moment aligned with the external magnetic field, displaying significant magnetic moment capability and a very obvious effect on the magnetic field, even producing very large artifacts. It itself exhibits hysteresis or magnetic memory phenomena and retains magnetism after leaving the magnetic field.
Superparamagnetism (which should be termed ferromagnetism) is composed of smaller metallic particles (such as Fe3O4), exhibiting moderate magnetic sensitivity, greater than paramagnetism but less than ferromagnetism, without hysteresis or magnetic memory effects, serving as the physical basis for MRI enhancement. (Draft article: What is the physical basis for MR enhancement? How is MR enhancement different from CT enhancement?)
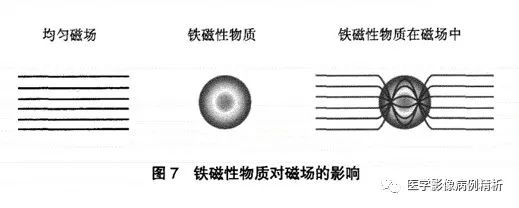
Various magnetic substances are shown in the figure. It is important to note that although the following substances possess certain magnetism, their magnetism may change when the chemical structure changes. For example, large molecular iron exhibits obvious ferromagnetism, such as some artificial prostheses and bone screws, which can produce strong magnetic sensitivity artifacts; small molecular iron exhibits superparamagnetism and can serve as a contrast agent for enhancement in the human body, shortening the T1 time of substances, presenting high signals, while containing iron in hemoglobin also shortens the T2 time much more than the T1 time, resulting in significantly low signals in T2WI; iron molecules in oxygenated and deoxygenated hemoglobin exhibit diamagnetism and weak paramagnetism, showing equal or low signals in T1, which will be elaborated on in future articles. (Draft article: The characteristics of MR hematoma signals and their clinical diagnostic significance?)

Question 2: What is the clinical diagnostic significance of high T1 signals (short T1)?
The high T1 signals mentioned in this article specifically refer to certain substances or tissues, not specific diseases. High T1 signal substances or tissues have very short T1 times. The most common include subacute hematomas, fat, calcium, manganese
, melanin, macromolecular mucoproteins, and the posterior pituitary. It is particularly important to clarify that subacute hematomas refer to deoxyhemoglobin, where the iron molecules can shorten the T1 time, exhibiting the strongest effect and the highest signal, presenting as high T1 signals (draft article: The characteristics of MR hematoma signals and their clinical diagnostic significance?). Normal calcified lesions contain no hydrogen protons, resulting in no signal acquisition, thus appearing as low signals. It is important to note that the signal from calcium molecules depends on the crystalline structure of the bound calcium; if the surface of the crystalline structure is rough enough to accommodate other components, it may easily shorten the T1 time, presenting as high signals (draft article: The characteristics of calcified lesion signals and their clinical diagnostic significance?). Manganese has the effect of shortening T1 time; if liver diseases affect manganese metabolism, it can lead to manganese deposition in the basal ganglia of the brain, resulting in high T1 signals. Typical melanin shows high signals in T1 and low signals in T2, but pure melanin is very rare in diseases, and rarely presents typical signal characteristics. Macromolecular mucoproteins mainly show high signals in mucinous cysts, Rathke’s cysts, and gelatinous cysts. It is especially noted that the posterior pituitary, due to the secretion of antidiuretic hormone, has the effect of shortening T1 time, presenting high signals, and is listed as a special tissue commonly encountered.
Question 3: What is the clinical diagnostic significance of high T2 signals (long T2)?
High T2 signal substances mainly include water, fat, and hematomas. Water can be free water or ionic water, and bound water. Water contains a large number of hydrogen protons, thus exhibiting very high T2 signals. Bound water, due to its different binding methods with tissues, produces medium to high T2 signals. Fat has a very long T2 time, thus producing high signals, but the signals produced by SE sequences (spin echo sequences) are biased towards moderate to high T2 signals, while FSE (fast spin echo sequences) significantly increases the T2 time of fat, presenting very high signals. High T2 signals in hematomas mainly include hyperacute hematomas and subacute late hematomas, where hyperacute hematomas are oxygenated hemoglobin, with Fe2+ showing slightly high signals in T2; subacute late hematomas are extracellular deoxyhemoglobin, where Fe3+ has a strong effect of shortening T2 time, but a large number of water molecules are released, significantly extending the T2 time, balancing the two, and since the water molecule content is much higher than the iron molecule content, it presents as very high T2 signals.
Question 4: What is the diagnostic significance of T1 and T2 high signals (short T1 and long T2) and low signals (long T1 and short T2)?
T1 and T2 high signals are very rare, mainly consisting of fat and subacute late hematomas.
T1 and T2 low signals are very rare, mainly consisting of gases and calcium, as they do not produce signals due to the absence of hydrogen protons. It is important to note that in certain special cases, calcium molecules may present as high T1 signals, increasing the difficulty of MR diagnosis.
2020.12.16
[Imaging Thinking] 055 Young Male with Multiple Vertebral Canal Occupations, How to Qualify? Pathological Result: Neurofibromas, Hemangiomas, Lipomas
The following images are derived from “MRI Technology Guide” by Yang Zhenghan, Feng Feng, Wang Xiaoying.
Question 1: How are atomic nuclei T1 and T2 signals collected by MR?
First, let’s explain two basic concepts, which are reviewed:
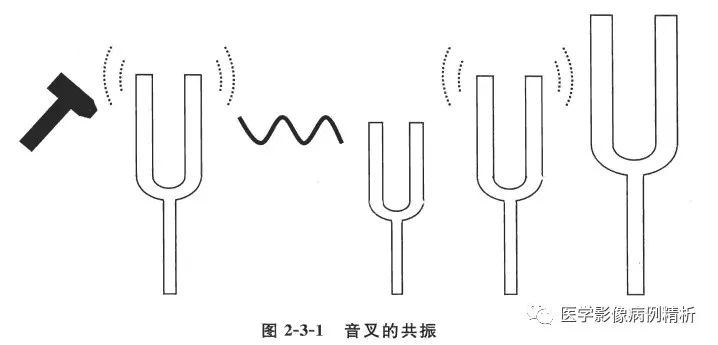
1. Resonance phenomenon, as illustrated, is a way of transferring energy, the principle of emitting radiofrequency pulses.
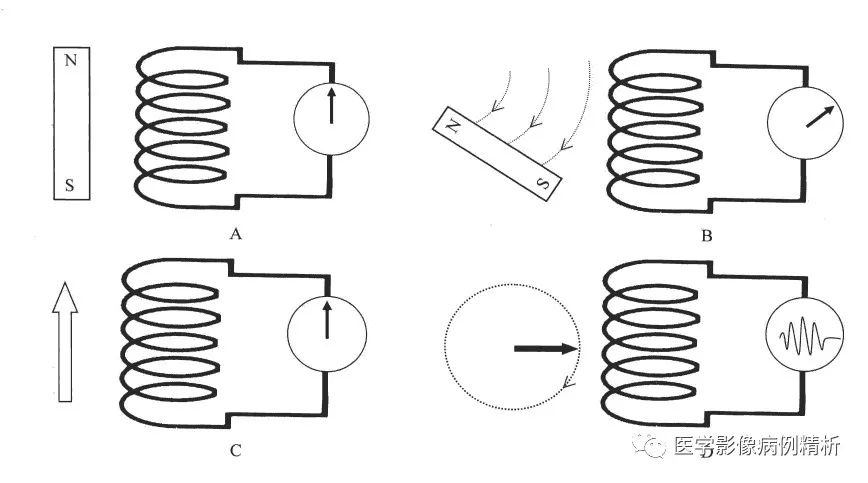
2. Electromagnetic induction, as illustrated, requires explanation. A magnetic body parallel to the coil does not cut the magnetic field lines, thus generating no current. B, when the magnetic body moves perpendicular to the coil, it cuts the magnetic field lines, thus generating current. Similarly, C, when the magnetic moment is parallel to the coil, it does not cut the magnetic field lines, generating no current. D, when the magnetic moment is perpendicular to the coil, it cuts the magnetic field lines, generating current that produces signals. This is the principle of collecting MR signals.
3. The world is divided into three axes: XYZ, with the strong magnetic field direction along the Z-axis, parallel to the receiving coil. When atomic nuclei are placed in a strong magnetic field, the scattered magnetic moments are immediately aligned into a Z-axis beam, and the receiving coil cannot receive any signals. When an external radiofrequency pulse is applied, this pulse acts as a resonance, transferring energy to a portion of the nuclear protons, causing the Z-axis magnetic moment to rotate into the X-axis direction, cutting the receiving coil perpendicularly and generating a weak current; the receiving coil receives this current and converts it into image signals. To maximize image signal strength, a 90° radiofrequency pulse is chosen as it is completely perpendicular to the coil. After a set time, the radiofrequency pulse is turned off, and the X-axis magnetic moment begins to revert to the Z-axis direction under the influence of the external strong magnetic field. After a while, another 90° radiofrequency pulse is applied, generating another signal. Each measurement of different tissues produces different image signals. This angle can be adjusted as needed to produce different signals. This is the fundamental method of collecting MR signals to generate images.
Question 2: Why is short T1 a high signal and long T1 a low signal?
Some explanations can be found in the previous article of this column. [Imaging Thinking] 054 Multiple Vertebral Destruction due to Tuberculosis or Brucellosis? Discharge Diagnosis: Brucellosis of the Lumbar Spine
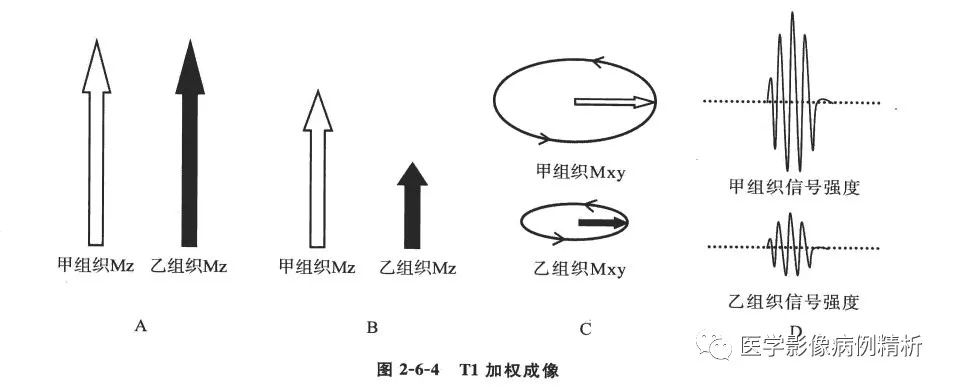
T1 is the longitudinal relaxation time, which refers to the time taken for T1 to increase from 0 to 67% of its maximum value. For ease of explanation, let’s assign two special values to tissues A and B. Assume tissue A has a T1 of 60 seconds, and tissue B has 600 seconds. Let’s assume the acquisition time is 40 seconds; after 40 seconds, we read the signal strength of the receiving coil. For tissue A, it is 40/60, which is exactly 67%, yielding the strongest signal. For tissue B, it is 40/600, which is 6.7%, yielding a weak signal. At this point, the acquired image displays that tissue A (with a short T1 value) has a significantly higher signal than tissue B (with a long T1 value). Some may ask, what if the acquisition time is set to 600 seconds? In reality, this is not the case; when calculating the longitudinal relaxation time of a substance, once it reaches 67% of its maximum value, it will not be collected anymore. In reality, the T1 values of various tissues are fixed, and to enrich the image display, optimal acquisition times are designed, so there will not be excessively short or long acquisition times. Of course, for diagnostic needs, longer or shorter acquisition times can be designed.
Question 3: Why does short T2 yield low signals and long T2 yield high signals?
Some explanations can be found in the previous article of this column. [Imaging Thinking] 054 Multiple Vertebral Destruction due to Tuberculosis or Brucellosis? Discharge Diagnosis: Brucellosis of the Lumbar Spine
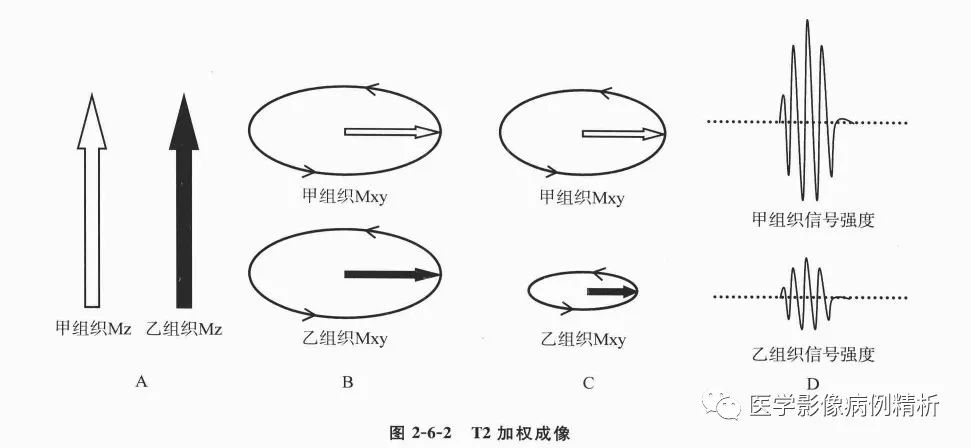
T2 is the transverse relaxation time, which refers to the time taken for T2 to decrease from its maximum value to 37%. For ease of explanation, let’s assign two special values to tissues A and B. Tissue B has a T2 time of 60 seconds, while tissue A has 600 seconds. Assuming the acquisition time is 50 seconds, the signal strength for tissue B is (60-50)/60, which is 16.7%, yielding a very low signal, while tissue A (600-50)/600 equals 91.7%, far exceeding the 37% standard time, yielding the strongest signal. In the acquired image, the signal for tissue B (with a short T2 time) is significantly lower than that of tissue A (with a long T2 time).
Ultimately, the reason for the opposite signals of T1 and T2 is due to the different methods of calculation; T1 calculates the increasing ratio, while T2 calculates the remaining ratio after reduction. The key is that T1 and T2 are both time measurements, which is why there are short and long T1 and T2 terms. They represent the recovery time of hydrogen nuclei in tissue components within the magnetic field. This recovery or relaxation time is due to the original scattered magnetic moments of hydrogen nuclei aligning to become consistent in the magnetic field, and when a 90° radiofrequency pulse is applied, the magnetic moments are rotated by 90°, and the nuclei must return to their original scattered state, hence the term recovery or relaxation time. T1 and T2 represent what time? If the world is divided into three axes: XYZ, where Z represents the direction of the external magnetic field, T1 represents the longitudinal relaxation of all vectors, and T2 represents the transverse relaxation of all vectors. When atomic nuclei enter the magnetic field, the energy of the magnetic field is strong, and the energy of the atomic nuclei is weak, naturally aligning into a Z-axis longitudinal beam, with T1 longitudinal relaxation at maximum and T2 transverse relaxation at 0. When a 90° radiofrequency pulse is applied, the magnetic moments rotate by 90°, resulting in T1 longitudinal relaxation being 0 and T2 transverse relaxation being at maximum. Under the influence of the external magnetic field, the relaxation starts, and when T1 increases to 67% of its original maximum value, it becomes the T1 value of that tissue; when T2 decreases to 37% of its original value, it becomes the T2 value of that tissue. The maximum values of both are fixed (the same field strength is fixed; different field strengths vary, with T1 values increasing at high field strengths while T2 values remain relatively stable), so T1 and T2 times are also fixed. All tissues have T1 values that are much longer than T2 values, with T1 ranging from hundreds to thousands of milliseconds, whereas T2 ranges from tens to hundreds of milliseconds.
2020.12.9
[Imaging Thinking] 054 Multiple Vertebral Destruction due to Tuberculosis or Brucellosis? Discharge Diagnosis: Brucellosis of the Lumbar Spine
Question 1: What is the biggest difference between MR and CT?
1. The imaging mechanisms are different. CT is based on the ability to penetrate materials using X-ray, with low-density materials being penetrated easily and appearing black, while high-density materials are poorly penetrated and appear white. MRI displays images based on the changes in atomic magnetic moments in a magnetic field environment.
2. The meanings of the images differ. Both CT and MRI images are black and white, where black indicates low and white indicates high. CT uses HouseField units, with gas being the lowest (black) indicating complete penetration by X-rays, and metals being the highest (white) indicating complete absorption and blockage of X-rays. MRI images have different meanings based on the weighted sequences used. For T1WI and T2WI, black is low signal and white is high signal, but they represent completely different meanings; in T1WI, black indicates low signal representing long T1 time, while white indicates high signal representing short T1 time; in T2WI, black indicates low signal representing short T2 time, while white indicates high signal representing long T2 time. This is further explained in question three.
3. Acquisition times differ; CT is very fast, taking about 3 minutes for a routine scan of one area, while MRI is much slower. Even for high-field machines, a routine head scan takes about 5-10 minutes.
4. Costs and expenses vary; CT is very common and inexpensive, while MRI is costly, with high maintenance costs and difficult to promote in grassroots settings, leading to a steep learning curve.
Question 2: Why is MR difficult to learn? What are its advantages and disadvantages?
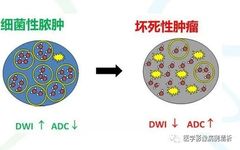
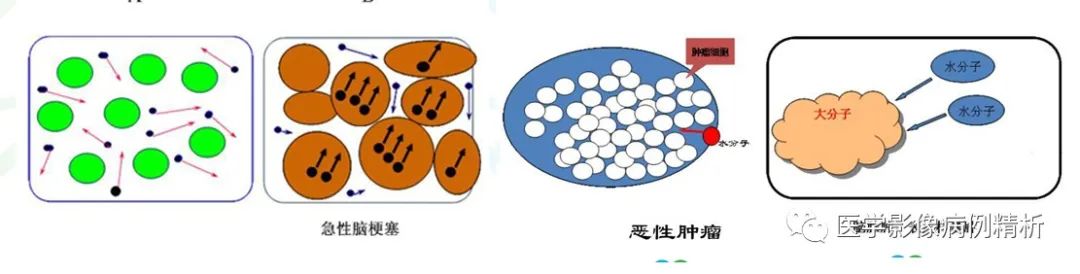
Learning MRI is challenging, akin to mathematics compared to CT. CT is like a single sequence from 1 to 100, fully explained. MRI is more like combinations, first arranging from 1 to 100 in rows, then arranging each row from 1 to 100 in columns, making it very complex. For example, CT high density indicates metals or calcium, with CT values around 100-1000 Hu; fat CT values are around -40 to -120 Hu, and water is 0 Hu, which is straightforward. MRI has multiple sequence images, each with high and low signals representing different meanings. For instance, high signals in T1WI can indicate fat, hematomas, melanin, or manganese; high signals in T2WI can indicate water, hematomas, or fat; high signals in DWI can indicate cytotoxic edema, macromolecular mucoproteins, or dense round cells. Therefore, only by combining multiple sequence images and analyzing them can one determine the significance of high and low signals; a single image has no meaning. This complexity is why MR can analyze more diseases like a detective.
Advantages: High soft tissue resolution and excellent diagnostic value for the nervous system. Imaging technology is improving and applications are expanding. Special imaging techniques like MRS, fMRI, and DTI have more significance for differential diagnosis of specific diseases.
Disadvantages: High costs, slow speeds, inability to perform scans on patients with metal implants, high maintenance costs, and difficulty in promoting in grassroots settings, leading to a steep learning curve.
Question 3: What do T1 and T2 represent?
This question could fill an entire article. Here’s my personal understanding:
T1 = T1 value = T1 time = T1 recovery time = T1 relaxation time = spin-lattice relaxation time
T2 = T2 value = T2 time = T2 recovery time = T2 relaxation time = spin-spin relaxation time
First, let’s answer this by reversing the question.
The key point is that both T1 and T2 are times, which is why we refer to short and long T1 and T2. They represent the recovery times of hydrogen atomic nuclei in tissue components within a magnetic field. Why is it called recovery or relaxation time? Because the original scattered magnetic moments of hydrogen nuclei align in the magnetic field, and when a 90° radiofrequency pulse is applied, the magnetic moments rotate by 90°, and the nuclei must return to their original scattered state, which is why it is called recovery or relaxation time. What do T1 and T2 represent? If the world is divided into three axes: XYZ, where Z represents the direction of the external magnetic field, T1 represents the longitudinal relaxation of all vectors, and T2 represents the transverse relaxation of all vectors. When atomic nuclei enter the magnetic field, the energy of the magnetic field is strong, and the energy of the atomic nuclei is weak, naturally aligning into a Z-axis longitudinal beam, with T1 longitudinal relaxation at maximum and T2 transverse relaxation at 0. When a 90° radiofrequency pulse is applied, the magnetic moments rotate by 90°, resulting in T1 longitudinal relaxation being 0 and T2 transverse relaxation being at maximum. Under the influence of the external magnetic field, relaxation starts, and when T1 increases to 67% of its original maximum value, it becomes the T1 value of that tissue; when T2 decreases to 37% of its original value, it becomes the T2 value of that tissue. The maximum values of both are fixed (the same field strength is fixed; different field strengths vary, with T1 values increasing at high field strengths while T2 values remain relatively stable), so T1 and T2 times are also fixed. All tissues have T1 values that are much longer than T2 values, with T1 ranging from hundreds to thousands of milliseconds, while T2 ranges from tens to hundreds of milliseconds.