
As a Python developer, have you ever struggled to create web applications for data visualization? Streamlit is your savior! This amazing library allows you to create stunning interactive applications with just a few lines of code.
What is Streamlit?
Streamlit is an open-source Python library designed specifically for data scientists and developers. Its core goal is very simple: to make web application development as easy as writing Python scripts. Imagine no longer needing to learn complex front-end technologies, allowing you to focus solely on data and logic.
Why Choose Streamlit?
Traditional web development often requires mastering multiple technologies like HTML, CSS, and JavaScript. But Streamlit is different; it’s a “plain language” version of a web development tool:
-
🚀 Rapid Development: Create interactive applications in minutes
-
🐍 Pure Python: No extra front-end knowledge required
-
🔧 Rich Components: Built-in numerous interactive controls
-
📊 Data Visualization: Easily integrate various chart libraries
Getting Started with Streamlit
Simple Installation

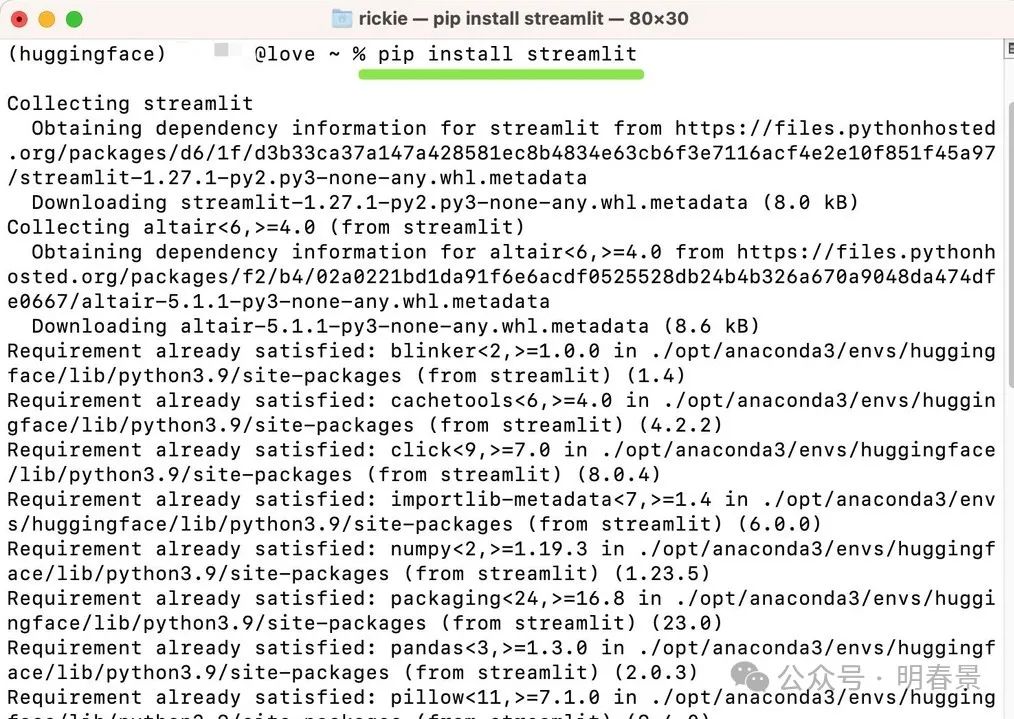
Open your terminal and run a single command:
pip install streamlit
Your First Streamlit Application
import streamlit as st
# Add a title
st.title('My First Data Application')
# Create a slider
age = st.slider('Select your age', 0, 100, 25)
# Display the result
st.write(f'Your selected age is: {age}')
This code is just a few lines long and can create an interactive page with a slider!
The Unique Charm of Streamlit
Real-time Preview
The coolest feature of Streamlit is real-time reloading. Every time you save the code, the application updates immediately, making it as smooth as writing programs!
Rich Components

Streamlit offers various components:
-
Text input box
-
Dropdown menu
-
Checkbox
-
Charts
-
File upload
Data Display
import pandas as pd
import streamlit as st
# Load data
df = pd.read_csv('data.csv')
# Display table
st.dataframe(df)
# Draw chart
st.line_chart(df)
Real-world Application Scenarios
Machine Learning Model Showcase
Imagine a scenario: you’ve trained an image recognition model and want everyone to experience it online? Streamlit makes it easy!
import streamlit as st
from tensorflow import keras
# Load model
model = keras.models.load_model('my_model.h5')
# File upload
uploaded_file = st.file_uploader("Select an image", type=['jpg', 'png'])
if uploaded_file is not None:
    # Process the image and predict
    prediction = model.predict(uploaded_file)
    st.write('Recognition result:', prediction)
Friendly Reminder
🔔 Note: Although Streamlit is easy to use, it’s important to follow Python best practices. Code logic and structure are equally important!
Deployment Tips
Streamlit provides a free cloud deployment service called Streamlit Share, and with just a few clicks, your application can be shared with the world!
Conclusion
Streamlit is not just a library, but a development philosophy. It makes data visualization accessible, allowing every Python programmer to effortlessly create stunning web applications.
Give it a try, and I believe you will fall in love with Streamlit!