
Writing Python code for data analysis is quite enjoyable, but how do you present it to others?
Creating a web interface requires learning a bunch of front-end knowledge, which is overwhelming!
But now you don’t have to worry, there’s a Python library called Streamlit that can help us easily accomplish this.
It allows us to create beautiful data presentation interfaces just by writing Python code, which is simply a blessing for data practitioners.
1.
Installation and Getting Started
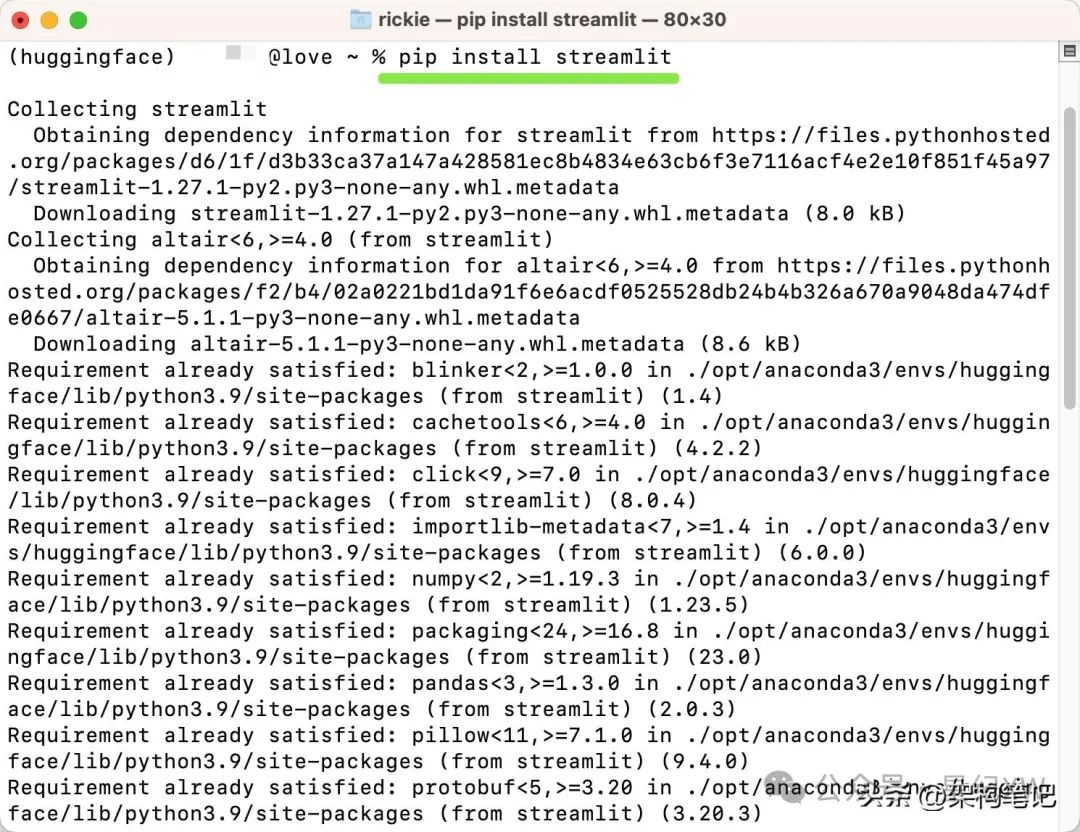
Installation is super simple, just one command:
pip install streamlit
Let’s try the most basic example:
import streamlit as st
st.title('My First Streamlit App')<br/>st.write('Hello World!')
Save this code as app.py, then run it in the command line:
streamlit run app.py

Look, the browser automatically opened a webpage displaying our content, it’s that simple!
2.
Common Components
Streamlit provides a lot of ready-made components, basically any functionality you want is available:
Text Input Box
user_input = st.text_input('Please enter your name')
Slider
age = st.slider('Your Age', 0, 100, 25)
Button
if st.button('Click to Greet'):<br/>st.write(f'Hello, {user_input}!')
Checkbox
if st.checkbox('Show More Information'):<br/>st.write('This is more information...')
Friendly reminder: The return values of components will automatically update during user interaction, no need to manually refresh the page.

3.
Data Display
Data analysis is inseparable from charts, and Streamlit supports various data visualization libraries quite well:
import pandas as pd<br/>import numpy as np
Display Data Table
df = pd.DataFrame(<br/>np.random.randn(10, 2),<br/>columns=['Data1', 'Data2'])<br/>st.dataframe(df)
Draw Chart
st.line_chart(df)
Once the code is saved, the page updates immediately, isn’t that great?
4.
File Upload and Download
Want users to upload files? It’s a piece of cake:
uploaded_file = st.file_uploader('Choose a CSV file', type=['csv'])<br/>if uploaded_file:<br/>df = pd.read_csv(uploaded_file)<br/>st.write('File content:', df)
Downloading files is also very simple:
data = pd.DataFrame({'Column1': [1, 2, 3], 'Column2': [4, 5, 6]})<br/>st.download_button(<br/>label='Download Data',<br/>data=data.to_csv(),<br/>file_name='data.csv')
5.
Layout Optimization
Want your page to look more professional? Try these:
Sidebar
with st.sidebar:<br/>st.write('This is the sidebar')<br/>option = st.selectbox('Select an option', ['A', 'B', 'C'])
Column Display
col1, col2 = st.columns(2)<br/>with col1:<br/>st.write('Left Side')<br/>with col2:<br/>st.write('Right Side')

Friendly reminder: It’s best to place layout code before other content to avoid display order confusion.
How to deploy a well-written Streamlit application? The simplest method is to use Streamlit’s own cloud platform, which is completely free and can directly connect to GitHub repositories; the application updates automatically when the code is updated, how convenient!
To be honest, developing with Streamlit is really addictive, you can see the effects immediately after writing the code, and it’s also very convenient to make changes.
Now whenever I need to do data presentation, the first thing that comes to mind is it.
By the way, if you encounter anything unclear, the official documentation of Streamlit is very detailed, and the interface is user-friendly, worth a look.
Life is short, I use Streamlit!