Click on 'Xiaobai Learns Vision' above, select 'Star' or 'Top' to receive important content first.Author | yishun@Zhihu
Source丨https://zhuanlan.zhihu.com/p/53683453
Editor | Jishi Platform
Introduction
Visual analysis of neural networks is significant for both learning and practical applications. Based on this, this article introduces three visualization methods for CNNs: visualizing intermediate feature maps, visualizing convolutional kernels, and visualizing class activation heatmaps. Each method includes detailed code explanations.
Note: All materials in this article are derived from the major work of Francois Chollet, the father of Keras and a Google AI researcher: ‘Deep Learning with Python’. It is recommended to read the original text directly; this is just a note based on the author’s understanding.
Introduction
Some students believe that deep learning and neural networks are just black boxes, and there is no need to analyze their internal workings. I personally think this statement is completely misguided.
Firstly, from the perspective of automatic feature extraction or representation learning, deep learning is quite understandable, as it extracts features progressively from simple to complex through a hierarchical structure, obtaining high-level abstract representations that are easier to process. Secondly, there are already many methods to analyze neural networks, especially some visualization methods that can intuitively demonstrate the feature extraction process of deep models.
Visual analysis of neural networks is significant for both learning and practical applications. Based on this, this article will introduce the following three visualization methods for CNNs:
-
Visualizing intermediate feature maps. -
Visualizing convolutional kernels. -
Visualizing class activation heatmaps in images.
Visualizing Intermediate Feature Maps
This method is quite simple; it visualizes the output feature maps of a certain layer in the network by channel, as shown in the following code:
import matplotlib.pyplot as plt
#get feature map of layer_activation
plt.matshow(layer_activation[0, :, :, 4], cmap='viridis')
Stacking multiple feature maps visually can yield an image similar to the one below.
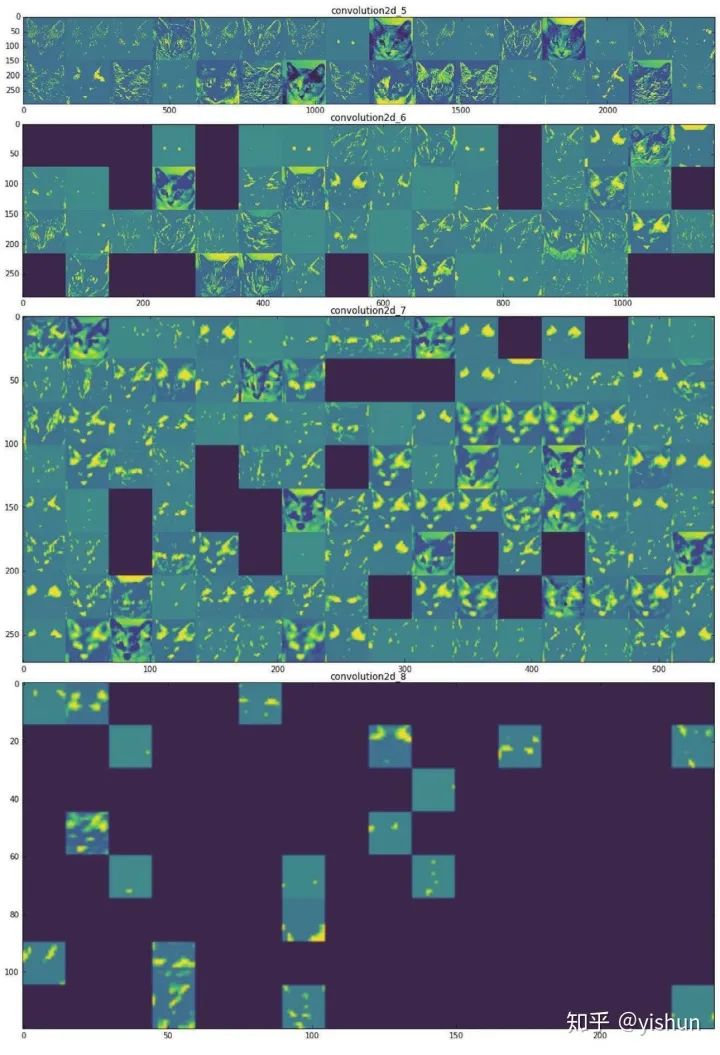
The above image shows the visualization results of feature maps of a certain cat from the output of layers 5-8 of a CNN (one convolutional kernel corresponds to one small image). It can be observed that the lower the layer, the more low-level pixel information is captured, and the outline of the cat in the feature map becomes clearer. As we go higher, the image becomes more abstract and sparser. This aligns with the feature extraction concept we have always emphasized.
Visualizing Convolutional Kernels
To observe the filters learned by convolutional neural networks, a simple method is to obtain the visual patterns that respond to each filter. We can view this as an optimization problem, starting from a blank input image and applying gradient ascent to the input image of the convolutional neural network to maximize the response of a certain filter. The final image obtained is one where the selected filter has a large response.
The core code is as follows (using the Keras framework):
def generate_pattern(layer_name, filter_index, size=150):
layer_output = model.get_layer(layer_name).output
loss = K.mean(layer_output[:, :, :, filter_index])
grads = K.gradients(loss, model.input)[0]
grads /= (K.sqrt(K.mean(K.square(grads))) + 1e-5)
iterate = K.function([model.input], [loss, grads])
input_img_data = np.random.random((1, size, size, 3)) * 20 + 128.
step = 1.
for i in range(40):
loss_value, grads_value = iterate([input_img_data])
input_img_data += grads_value * step
img = input_img_data[0]
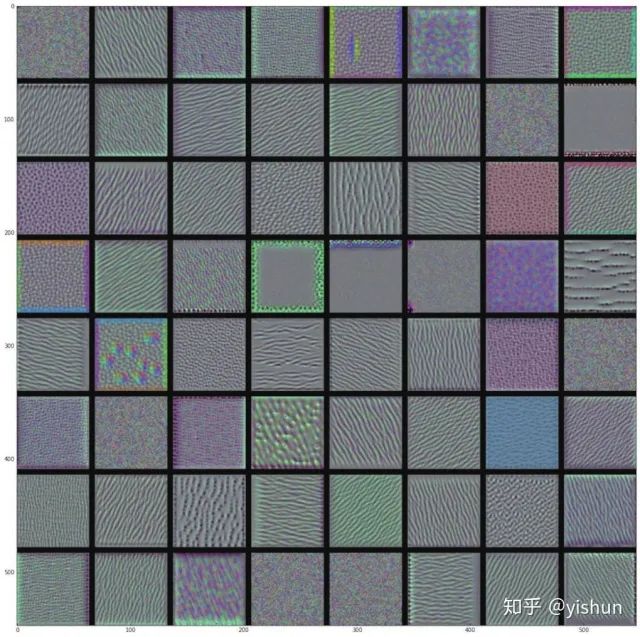
return deprocess_image(img)After converting the input image tensor back to an image for visualization, one can obtain an image similar to the one below:
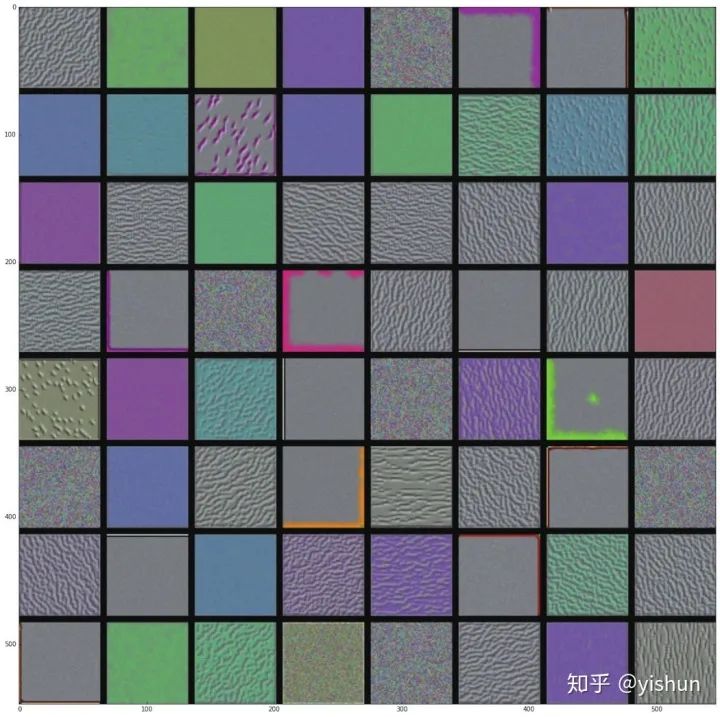
Filter patterns of the block1_conv1 layer
Filter patterns of the block2_conv1 layer
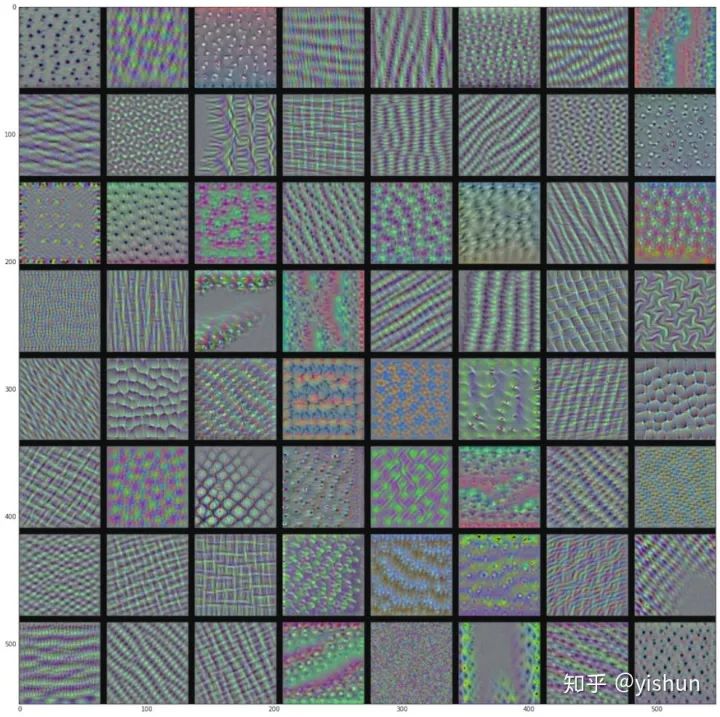
Filter patterns of the block3_conv1 layer
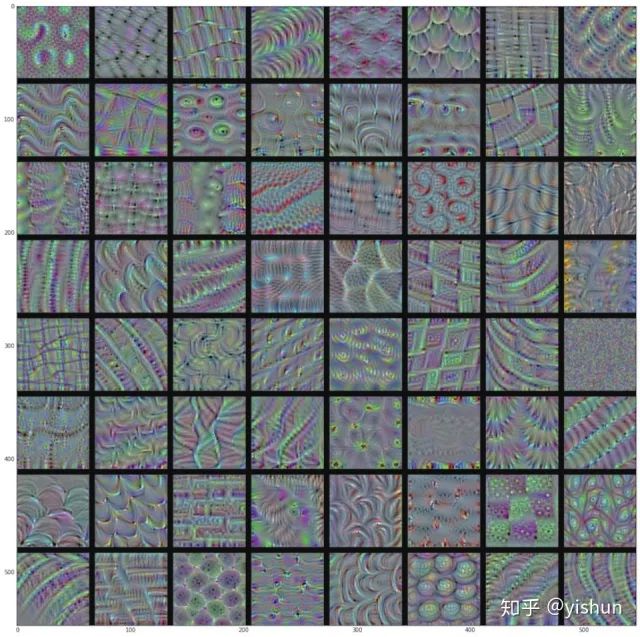
Filter patterns of the block4_conv1 layer
As the layers deepen, the filters in the convolutional neural network become increasingly complex and refined. The filters of the first layer (block1_conv1) correspond to simple directional edges and colors, while higher-level filters resemble textures in natural images: feathers, eyes, leaves, etc.
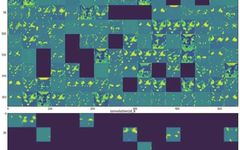
Visualizing Class Activation Heatmaps
This shows the degree of contribution of different regions of the original image to a certain CNN output category, as shown in the image below:
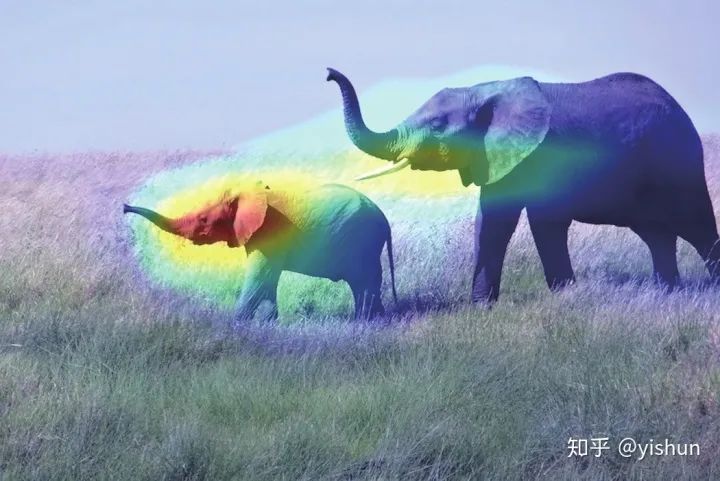
It can be seen that the head of the elephant contributes significantly to the category of ‘elephant’, and this method seems to allow for some degree of unsupervised object detection.
Below is the original text from the book, which might be a bit convoluted.
The specific implementation we will use is described in the paper ‘Grad-CAM: visual explanations from deep networks via gradient-based localization’. This method is very simple: given an input image, for the output feature map of a convolutional layer, weight each channel of this feature map with the gradient of the class with respect to the channel. Intuitively, one way to understand this technique is that you are weighting the spatial map of ‘activation strength of the input image on different channels’ with ‘the importance of each channel to the class’, thus obtaining a spatial map of ‘activation strength of the input image to the class’.
Here I will share my understanding: given a linear function, y is the category, etc., as input. It can be seen that the contribution to y is exactly this. Of course, in deep models, there are nonlinear activation functions, which cannot be simplified into a linear model, so this is just an heuristic understanding.
The code is as follows:
african_elephant_output = model.output[:, 386]
last_conv_layer = model.get_layer('block5_conv3')
grads = K.gradients(african_elephant_output, last_conv_layer.output)[0]
pooled_grads = K.mean(grads, axis=(0, 1, 2))
iterate = K.function([model.input],
[pooled_grads, last_conv_layer.output[0]])
pooled_grads_value, conv_layer_output_value = iterate([x])
for i in range(512):
conv_layer_output_value[:, :, i] *= pooled_grads_value[i]
heatmap = np.mean(conv_layer_output_value, axis=-1)
heatmap = np.maximum(heatmap, 0)
heatmap /= np.max(heatmap)
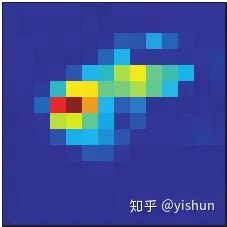
plt.matshow(heatmap)The resulting heatmap is shown below:
After processing with the following code, the image at the beginning of this section can be obtained.
import cv2
img = cv2.imread(img_path)
heatmap = cv2.resize(heatmap, (img.shape[1], img.shape[0]))
heatmap = np.uint8(255 * heatmap)
heatmap = cv2.applyColorMap(heatmap, cv2.COLORMAP_JET)
superimposed_img = heatmap * 0.4 + img
cv2.imwrite('/Users/fchollet/Downloads/elephant_cam.jpg', superimposed_img)
Conclusion
This article ends here. I would like to recommend again the book by Francois Chollet, which is written very accessibly, and I suggest that beginners read it.
Download 1: Chinese Tutorial for OpenCV-Contrib Extension Modules
Reply 'Chinese tutorial for extension modules' in the backend of 'Xiaobai Learns Vision' public account to download the first Chinese version of the OpenCV extension module tutorial, covering installation of extension modules, SFM algorithms, stereo vision, object tracking, biological vision, super-resolution processing, and more than twenty chapters of content.

Download 2: Python Vision Practical Project 52 Lectures
Reply 'Python vision practical project' in the backend of 'Xiaobai Learns Vision' public account to download 31 practical vision projects including image segmentation, mask detection, lane line detection, vehicle counting, eyeliner addition, license plate recognition, character recognition, emotion detection, text content extraction, and face recognition, helping to quickly learn computer vision.

Download 3: OpenCV Practical Projects 20 Lectures
Reply 'OpenCV practical projects 20 lectures' in the backend of 'Xiaobai Learns Vision' public account to download 20 practical projects based on OpenCV, achieving advanced learning in OpenCV.

Group Chat

Welcome to join the reader group of the public account to communicate with peers. Currently, there are WeChat groups for SLAM, 3D vision, sensors, autonomous driving, computational photography, detection, segmentation, recognition, medical imaging, GAN, algorithm competitions, etc. (will gradually be subdivided in the future). Please scan the WeChat number below to join the group, and note: 'nickname + school/company + research direction', for example: 'Zhang San + Shanghai Jiao Tong University + Visual SLAM'. Please follow the format; otherwise, it will not be approved. After successfully adding, invitations will be sent to enter the relevant WeChat groups based on research direction. Please do not send advertisements in the group; otherwise, you will be removed from the group. Thank you for understanding~