Click the blue words to follow us

This research was published in the international journal Applied Sciences. For details, see: Xiaoyi Shao, Xiaoqing Wang*, Chong Xu, Siyuan Ma 2024. MCPSHA: A New Tool for Probabilistic Seismic Hazard Analysis Based on Monte Carlo Simulation. Applied Sciences [J], 14.
Original link:https://doi.org/10.3390/app14031079

[Research Overview]
Xiaoyi Shao and others proposed a probabilistic seismic hazard analysis tool (MCPSHA) based on Monte Carlo simulation. This method is an effective and adaptable alternative to traditional probabilistic seismic hazard analysis (PSHA), especially when facing complex factors such as parameter uncertainty and multiple seismic source models. Using the Monte Carlo method, the research derives formulas for the probability of seismic intensity occurrence and exceedance probability over a specific period, referencing the Cornell seismic activity model widely used in engineering seismology and disaster reduction, as well as seismic activity models capturing time, space, and magnitude non-uniformity. The study predicts the differences between the probability of earthquakes occurring and exceedance probabilities in the Baoji area over the next 50 years. This research provides strong technical support for reducing seismic risk and improving the accuracy of earthquake insurance premium calculations.
[Research Method]
MCPSHA represents a relatively straightforward method for seismic hazard assessment, as shown in Figure 1. The program includes three modules: (1) generating a seismic catalog based on seismic activity parameters; (2) calculating ground motion for specified sites; (3) determining the probability of ground motion at the site. The Monte Carlo simulation primarily uses one or more probability density functions to model physical processes. By employing random sampling, a large number of samples satisfying the probability density function are produced. Based on the fundamental assumptions of China’s seismic motion parameter zoning map and seismic activity parameters, the exceedance equation is solved iteratively to determine the intensity values. Additionally, it is typically assumed that the normalized residual (ε) follows a normal distribution with a mean of zero and a standard deviation (σ). By adding ε to the intensity, the final intensity can be obtained. Considering the potential impact of all seismic belts on the site, this process continues until the specified number of earthquakes is reached within the seismic belt, completing a sampling cycle. Subsequently, a large-scale sampling simulation generates a set of seismic events. The derived formulas are then used to calculate the probability of seismic intensity occurrence and exceedance probability over a specific time period.
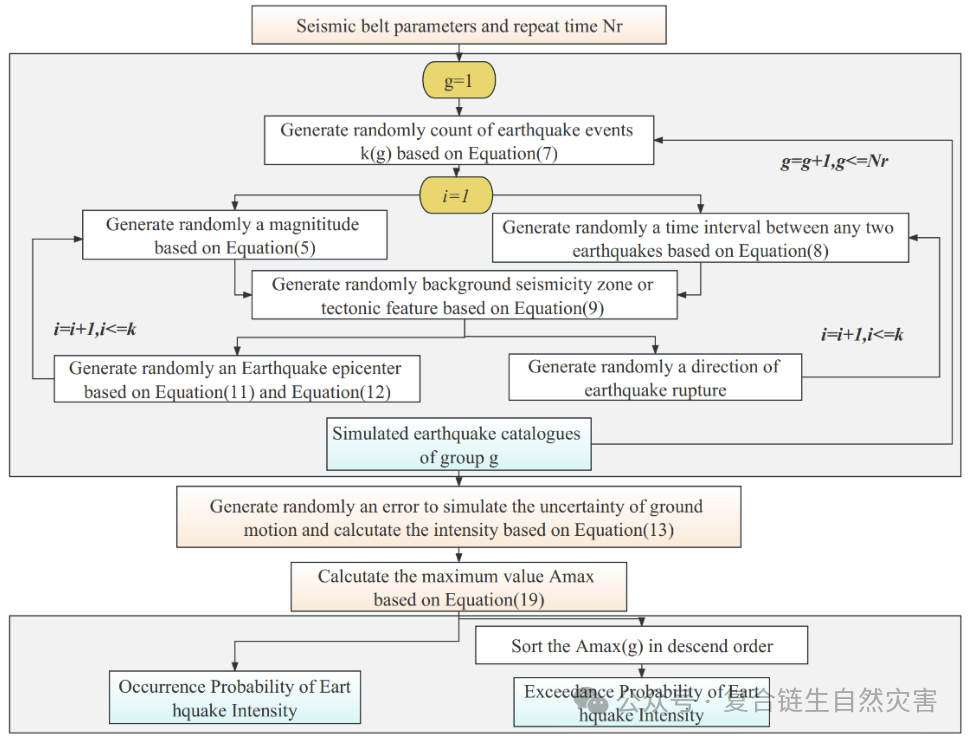
Figure 1. Flowchart of Research Method
[Research Results]
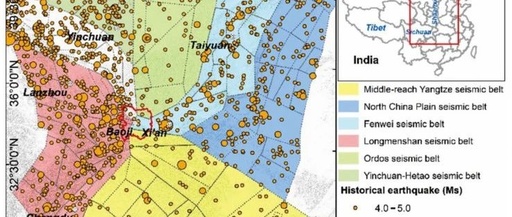
Using the methods described in this study, a seismic catalog of 1,000,000 simulated earthquakes was generated for the next 50 years. Figure 2 shows the distribution of epicenters (5.0≤M≤8.5) in the simulated seismic catalog for the next 50 years. A grid resolution of 0.05°× 0.05° was used to calculate the seismic intensity in the Baoji area under specific hazard levels. Figure 3 displays the probabilities of average intensities VI, VII, and VIII occurring in the area over the next 50 years. The results indicate that the northeastern region has the lowest occurrence probability, while the northwestern region has the highest. Figure 4 shows the changes in occurrence and exceedance probabilities for specific intensities calculated using this method in the study area over the next 50 years. Notably, the differences between the two probabilities are more pronounced at intensity levels VI~VII, while the differences are smaller at intensity level VIII. Figure 5 compares the two probabilities (intensities VI, VII, and VIII) in the area. The results show that as the intensity value increases, the differences between the two gradually diminish.
To verify the accuracy of the program-generated results, 300 random points were selected in the Baoji area, and the hazard for each point was calculated using both the traditional CPSHA method and the MCPSHA program (return period T = 476 years), as shown in Figure 6. Although the results of the two methods show similarities, there are still some differences. The correlation between the intensity results calculated by the two methods is very high, at 0.98 (Figure 7a). To further evaluate the differences between the results of CPSHA and MCPSHA, the differences between the two results were calculated (Figure 7b). The average difference was 0.16, with a minimum of 0.08 and a maximum of 0.2, and a standard deviation of 0.03. The observed differences may stem from the excessive discretization employed by the CPSHA program, particularly in variables such as earthquake magnitude and epicentral distance, aimed at simplifying integration. In MCPSHA, the Monte Carlo method based on the Bayesian law of large numbers ensures that the frequency of events accurately reflects the probability of events occurring under a large number of random simulations. However, the Monte Carlo method also presents computational challenges, especially for complex seismic models, as it requires extensive random simulations, leading to high computational costs. Furthermore, the accuracy of this method depends on the quantity and quality of random sampling; insufficient or inappropriate sampling may introduce biases in the results. In the seismic simulations of the seismic belt in this study, the Poisson model used for the number of earthquakes often deviated from true seismic activity, typically following a clustering model. To address the issue of inter-triggering between earthquakes (e.g., Poisson + clustering), future research could improve the sampling function and incorporate seismic activity models (such as ETAS) to obtain more accurate results, particularly in areas with limited historical earthquake records and complex geological structures.
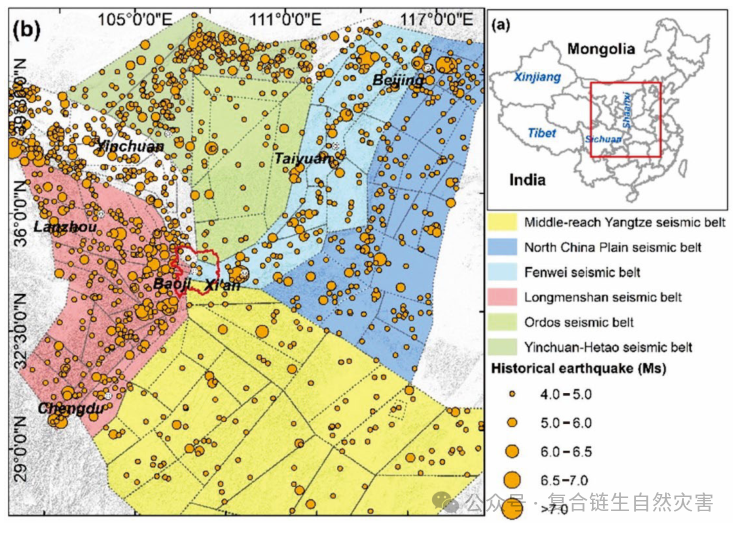
Figure 2. Distribution of epicenters (5.0≤M≤8.5) in the simulated seismic catalog for the next 50 years, (a) study area range, (b) distribution of seismic epicenters and spatial distribution of seismic belts
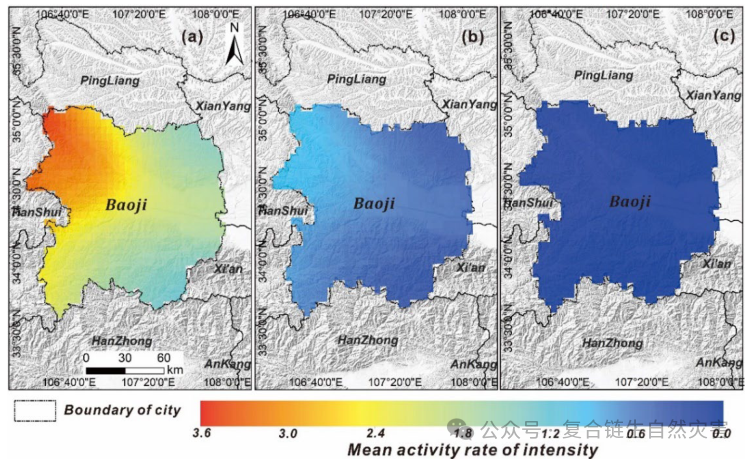
Figure 3. Probabilities of average intensities VI, VII, and VIII occurring over the next 50 years, (a) probability of average intensity VI; (b) probability of average intensity VII; (c) probability of average intensity VIII
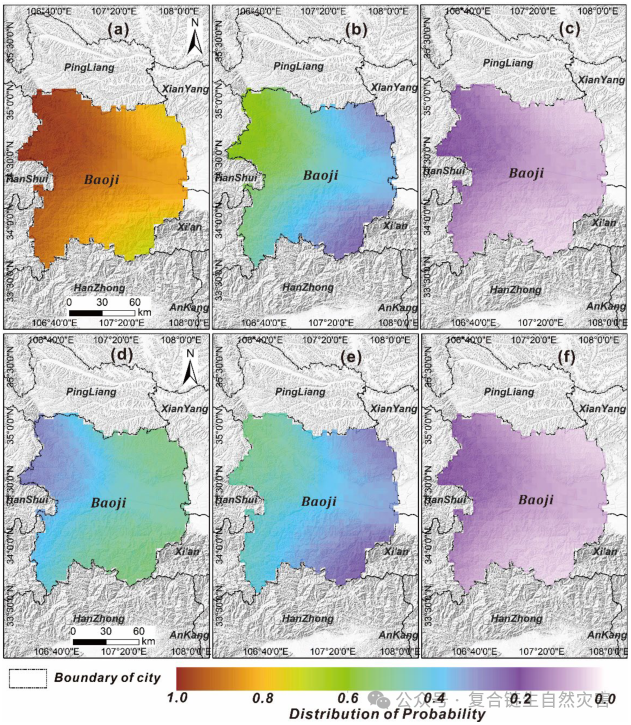
Figure 4. Different intensities and probabilities over the next 50 years, (a-c) represent the changes in probabilities of intensities VI, VII, and VIII in the area; (d-f) represent the exceedance probabilities of intensities VI, VII, and VIII in the area
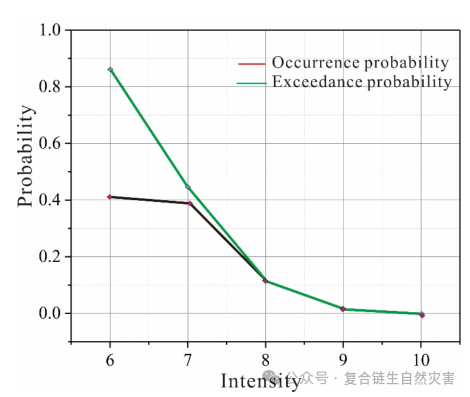
Figure 5. Comparison of the two probabilities for each intensity in the study area
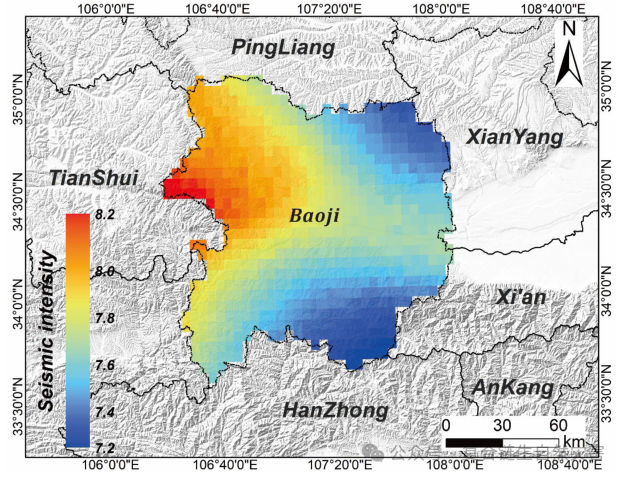
Figure 6. Earthquake hazard map with a 10% exceedance probability over the next 50 years calculated by MCPSHA (T = 476-year return period)
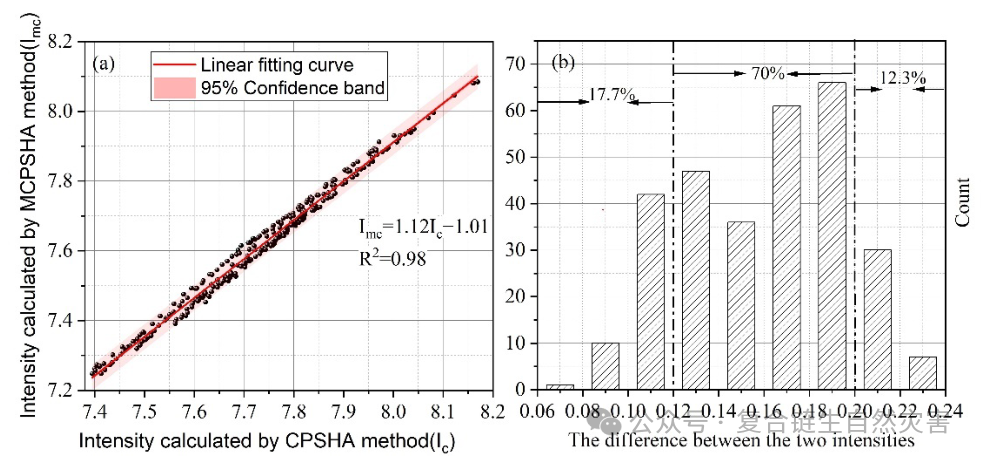
Figure 7. Comparison of intensity fitting results between MCPSHA and CPSHA (T = 476-year return period), (a) correlation between the two intensity results, (b) statistical chart of the differences between the two results
[Research Conclusion]
The study derived formulas for calculating the probabilities of seismic intensity occurrence and exceedance probabilities, and developed the MCPSHA program. The three fundamental components of MCPSHA were carefully considered: seismic source model, magnitude recursion model, and ground motion attenuation model. This method offers greater flexibility and transparency, making it easy to adapt to modifications in seismic activity models. Furthermore, the team studied the differences between the occurrence probabilities and exceedance probabilities in the Baoji area over the next 50 years, revealing that the differences approach two times in the VI~VII intensity range and gradually decrease with increasing intensity. This research emphasizes that exceedance probabilities and occurrence probabilities for specific intensities are not interchangeable, and accurate earthquake intensity occurrence probabilities are essential for seismic risk analysis and earthquake loss estimation.
Data compiled | Xue Zhiwen
Typesetting editor | Wang Qinxia
Submission Email: [email protected]
We welcome your attention and submissions!