· Included in the Overview of Core Journals in China
· Core Journal of Chinese Science and Technology
· High-quality Scientific Journal in the Textile Field (T3)
· Journal Indexed by Scopus in Netherlands
· Included in the Ulrich’s Periodicals Directory in the USA
· Included in EBSCO-TTC in the USA
· Included in the World Textile Science Database (WT)
· Included in the Chinese Science Citation Index (CSCI)
· Included in the Full-text Database of Chinese Academic Journals
· Included in the Chinese Science and Technology Papers and Citation Database
· Included in the Chinese Science and Technology Journal Database
· Included in the National Science and Technology Journal Open Platform
Source | “Modern Textile Technology” Volume 31, Issue 3, 2023
Authors | Xu Kaixin, Dai Ning, Ru Xin, Hu Xudong
(Zhejiang University of Science and Technology, a. Key Laboratory of Modern Textile Equipment Technology, Zhejiang Province; b. College of Textile Science and Engineering (International Silk Institute), Hangzhou)
Author Introduction | Xu Kaixin (1998—), male, from Jiaxing, Zhejiang, master’s student, mainly engaged in research on intelligent manufacturing and data management in textiles.
Abstract Different looms have varying production conditions and influencing parameters, resulting in significant differences in actual weaving efficiency and loom shutdown time. This paper proposes a loom shutdown prediction method based on Long Short-Term Memory (LSTM) recurrent neural networks to address the issue of large deviations between theoretical calculations and actual loom shutdown times when calculating loom shutdown times using pre-set static parameters. By analyzing various factors affecting loom shutdown times from three aspects: the parking situation in the warp and weft directions, personnel work efficiency, and the types of processed fabrics, a dataset with time series characteristics of loom production situations was constructed. The model’s prediction was dynamically adjusted throughout the lifecycle of the loom beam by setting a time progress coefficient, optimizing model performance in terms of loss and training time. Finally, the model’s reliability was validated using eight sets of experimental data. The results show that the average error range between the model’s predicted values and actual values for shutdown predictions from 30 hours to 6 hours before shutdown is between 0.84 hours and 1.52 hours, meeting the required indicators for actual production.
Keywords loom shutdown; LSTM recurrent neural network; time series; warp and weft parking; loom beam
The production of a loom mainly involves the process of interweaving the weft yarn with the warp yarn on the loom to produce fabric [1]. When the yarn on the loom beam is exhausted, it is necessary to clear the loom of the loom beam, warp stop pieces, heddles, and reed, a process known as loom shutdown [2]. Early loom shutdown can lead to waste of yarn raw materials; delayed loom shutdown can cause prolonged machine downtime and insufficient remaining warp length, making it impossible to tie new beams [3]. Accurate prediction of loom shutdown times enables timely arrangements for personnel to perform threading, tying, and beam changing tasks [4], ensuring that new beams are quickly put into production, significantly impacting the improvement of weaving production efficiency.
To accurately predict the loom’s shutdown time and manage the overall production progress of weaving, it involves real-time collection of basic data in the workshop and data-driven analysis and mining of production trends and factor characteristics. Guo Guanghui et al. [5] developed a monitoring system for loom operation data using mobile terminals and a web service-based database middleware architecture; Luo Dongsheng [6] proposed a method for obtaining loom data using interface embedding to solve system compatibility issues caused by equipment heterogeneity. Although the above studies have achieved real-time and complete collection of workshop data, they have not mined influencing factors from massive data and have not considered changes and emergencies in production. Zheng Baoping et al. [7] analyzed the motion laws of the knitting machine’s loop forming mechanism and designed an electronic cam planning curve algorithm and model predictive control algorithm to achieve dynamic tension compensation control of yarn; Zhang Xiaoxia et al. [8] suggested that the most critical factors affecting loom efficiency are the warp and weft stoppages, using back propagation (BP) neural networks and their improved algorithms to predict loom efficiency. Although these studies have statistically and analyzed actual production data, they mostly consider static data such as process parameters, without considering the correlation between various production data of the loom and the time progress.
Given the above analysis, this paper treats the entire lifecycle of the loom during the processing of the loom beam as a long time series, studying the relationship between various production data and production time during loom operation and constructing a loom shutdown time prediction model based on LSTM recurrent neural networks.
To better align with actual production requirements, the actual demand indicators for loom shutdown prediction were analyzed and confirmed. The weaving process is divided into warping, sizing, threading, weaving, and inspection [9]. As a typical full-process production, uninterrupted operation between each link is a key guarantee for high-efficiency weaving production. The time required for the production stages before and after loom weaving is shown in Table 1.
Table 1 Analysis of Time Required for Preparation Stages Before Weaving
Tab.1 Analysis table of preparation time before weaving
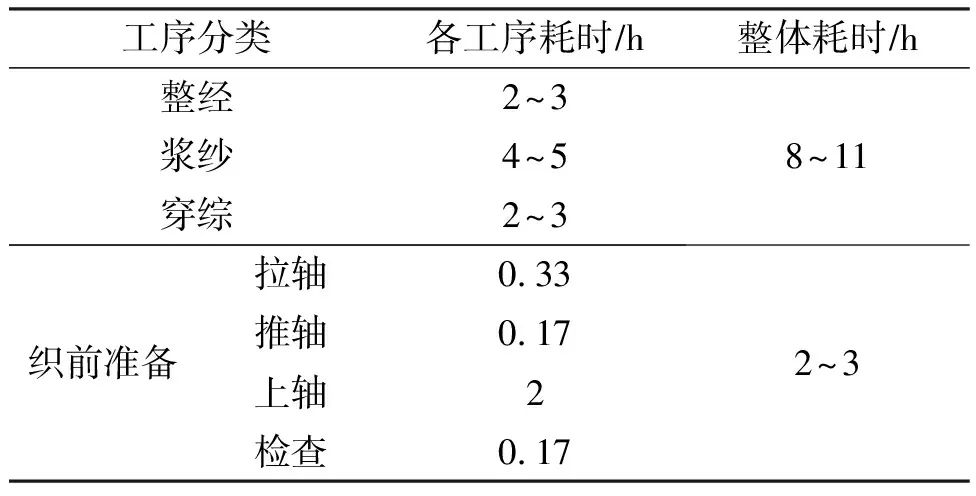
Through surveys, it was found that most textile factories use cone yarn as weaving raw materials, which first need to go through the three processes of warping, sizing, and threading to obtain the loom beam used for loom production. The overall processing time required during this period ranges from 8 hours to 11 hours. To better fit the actual workshop production requirements and allow sufficient preparation time for loom production, as well as to account for possible machine failures, loom shutdown predictions should be controlled to be at least one day or even earlier before the actual loom shutdown.
The error range of the shutdown prediction time is greatly related to the time required for the loom’s preparation stages before weaving. From Table 1, it can be seen that the preparation stages before weaving can be divided into four working steps: pulling beams, pushing beams, installing beams, and the final inspection before starting the loom. Among them, the installation of the loom beam is the most time-consuming in the preparation stages, including yarn tying, process parameter input, and fabric inspection. The overall time consumed in the preparation stages is between 2 and 3 hours. In order to reserve sufficient operation time for the preparation stages and to provide more planning time for operators when encountering loom failures, the error in the loom shutdown prediction time should meet within 3 hours of the actual shutdown time.
Combining the above two requirements, the constraints on the demand indicators that the designed shutdown time prediction model needs to meet are shown in equation (1).
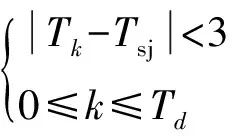
(1)
In the equation, k is the time progress index; d is the time progress point one day before the actual loom shutdown; Tk is the predicted shutdown time at time progress k, in hours; Tsj is the actual shutdown time of the loom, in hours; Td is the actual time of the loom one day prior, in hours.
Analysis of Influencing Factors
The prediction of loom shutdown time is essentially the calculation of the time required for the loom to complete the target loom beam. Based on the total meters of fabric to be woven pre-set on the loom before weaving, the running speed of the loom, and the weft density parameters required for the fabric, the theoretical weaving time needed to achieve the predetermined fabric length can be calculated, which is the theoretical loom shutdown time. The calculation is shown in equation (2).

(2)
In the equation, Tll is the theoretical total time for the loom to weave, in minutes; M is the total length of yarn wound on the loom beam, in meters; W is the weft density parameter value (the number of weft yarns per inch of fabric); S is the running speed of the loom during weaving (the number of wefts inserted by the loom in one minute).
The calculation of equation (2) assumes that the loom maintains an ideal weaving state throughout the entire cycle of processing the loom beam, which does not reflect actual production situations. In practical production scenarios, the loom may experience stoppages due to yarn breakage or machine failures during the weaving process. The actual weaving time of the loom and the theoretical weaving time are related as shown in equation (3).
Tsj=Tll+(Tjw+To)
(3)
In the equation, Tjw is the time spent on warp and weft stoppages during the entire cycle of processing the loom beam, in hours; To is the time spent on other stoppages during the entire cycle of processing the loom beam, in hours.
Thus, the difficulty in accurately predicting the loom shutdown time lies in how to accurately grasp the additional time consumed due to irregular stoppages during the loom’s weaving process.
This paper takes the Toyota JAT710 jet loom as the research object, analyzing the key factors affecting loom shutdown time from three aspects: the parking situation in the warp and weft directions, the work efficiency of the loom operator, and the types of processed fabrics. The specific composition of the influencing factors is shown in Figure 1.
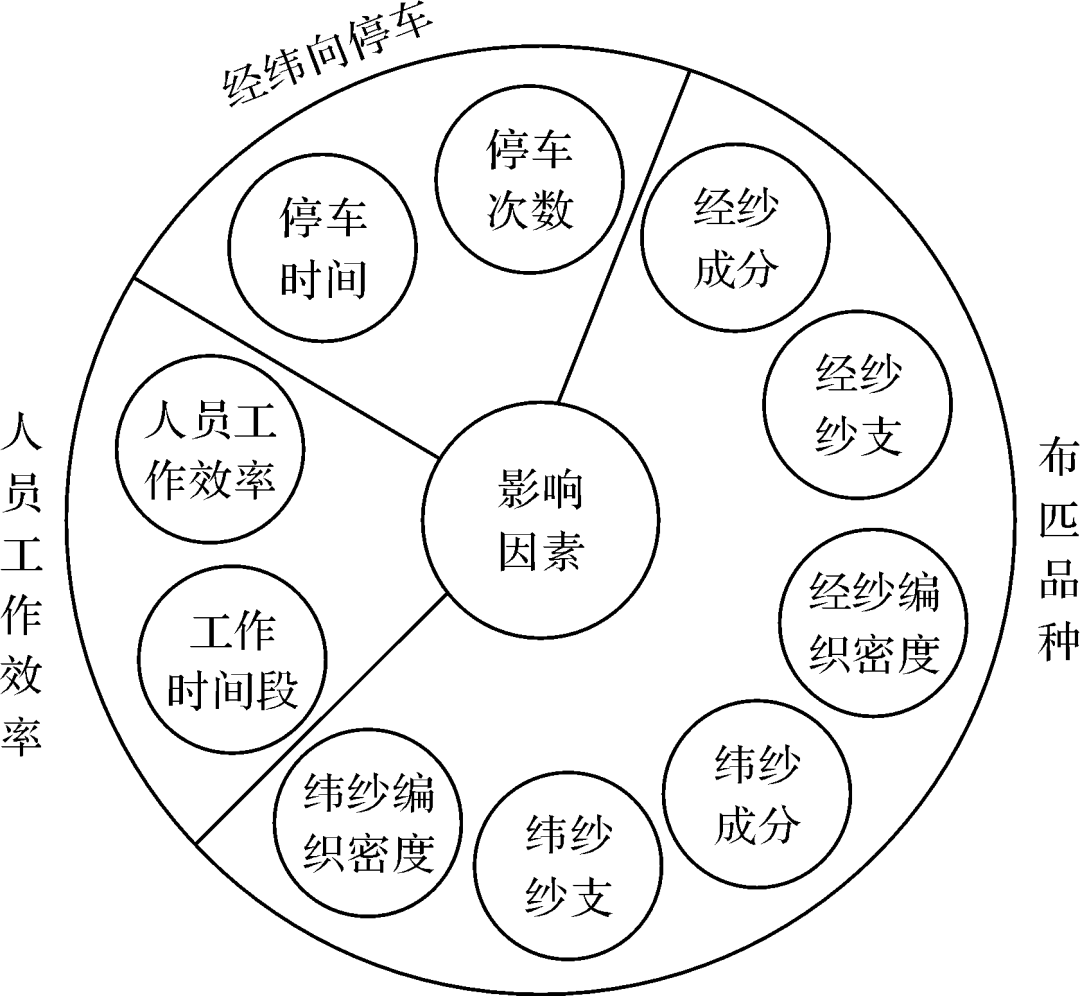
Figure 1 Composition Diagram of Influencing Factors
2.1 Analysis of Warp and Weft Stoppage Influencing Factors
By statistically analyzing the production data of 810 loom devices collected over one month from a textile factory in Jinhua Lanxi City, it was found that the average proportion of loom stoppage time during the entire weaving time of the loom is approximately 9.68%, of which the average proportion of warp and weft stoppage time is about 80.74%.
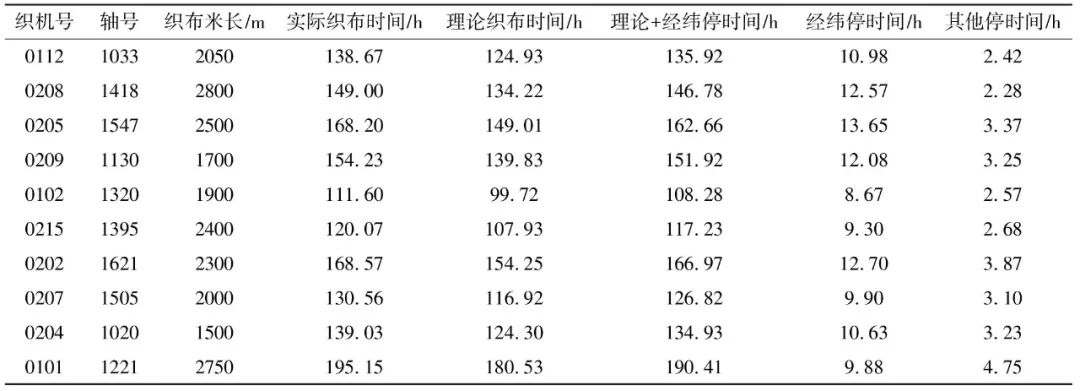
Table 2 locates the data statistical dimensions to specific 10 looms, collecting data on the weaving length, actual weaving time, theoretical weaving time, warp and weft stoppage times, etc., for each loom, obtaining the comparison of various production times of the looms as shown in Table 2.
From Table 2, it can be seen that the sum of the theoretical weaving time calculated for the loom plus the warp and weft stoppage time is close to the actual weaving time of the loom, further demonstrating that warp and weft stoppages are key factors in accurately predicting loom shutdown times.
Table 2 Comparison of Various Consumption Times of Looms
Tab.2 Consumption time comparison table
2.2 Analysis of Loom Operator Work Efficiency Influencing Factors
When the loom pauses due to yarn breakage, it is generally the responsibility of the loom operator to re-tie the broken yarn to restore the normal operation of the loom. The work efficiency of the loom operator directly affects the duration of the loom stoppage (the operational efficiency of the loom).
Figure 2 reflects the warp and weft stoppage situation of a specific loom beam throughout its entire lifecycle.
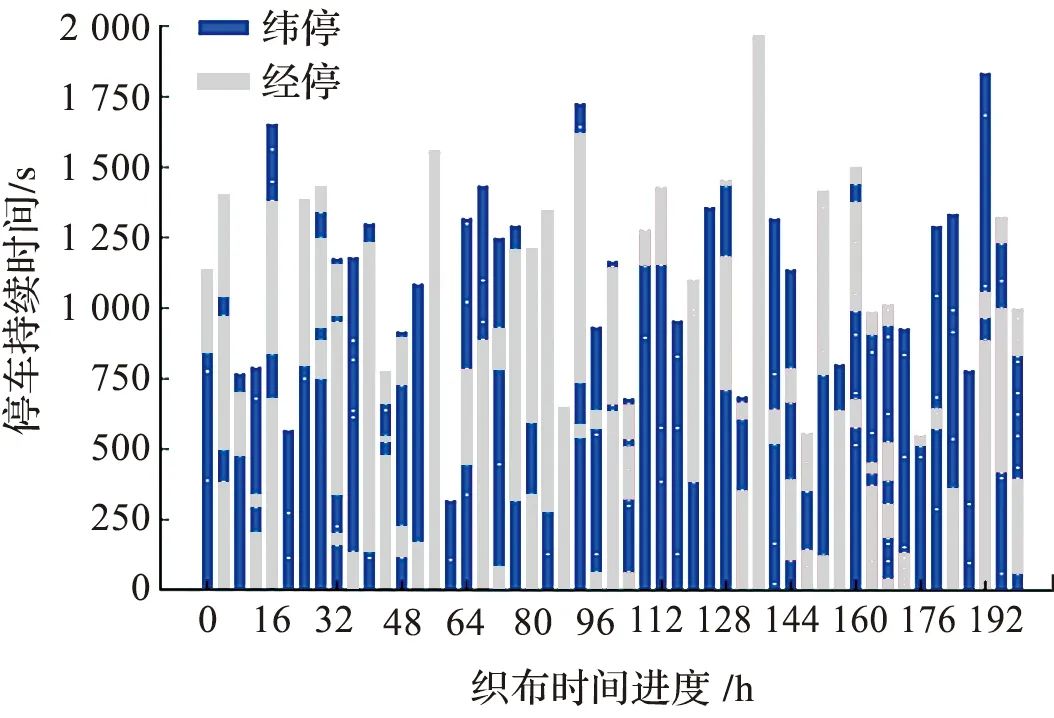
Figure 2 Warp and Weft Stoppage Situation of the Loom at Different Time Periods
According to Figure 2, during the weaving period of this loom beam, the average warp and weft stoppage time every 4 hours is 1145 seconds, and the average number of warp and weft stoppages every 4 hours is 4 times. It can be observed that during the noon (11:45) and midnight (23:45) hours, as well as during the few time periods close to the loom beam’s impending shutdown, the number of warp and weft stoppages and their durations are relatively high, often exceeding the average.
Through further analysis, it can be concluded that this phenomenon is mainly related to the work state of the loom operator. It is known that most textile enterprises operate their weaving workshops 24 hours a day, with workers rotating between day and night shifts. The noon and midnight hours are the most exhausting periods, and workers may not have high work efficiency in handling operations such as tying yarn, which require a certain level of professionalism and skill, leading to extended stoppage times; another period with significantly higher stoppage counts is just before the loom beam is about to shut down. As observed from the data in Figure 2, during the last 48 hours of the lifecycle of this loom beam, the occurrences of warp and weft stoppages are high and concentrated, as the yarn wound on the beam experiences uneven tension, leading to increased yarn breakage and frequent stoppages.
2.3 Analysis of Fabric Variety Influencing Factors
Expanding the time span from a single loom beam to a variety, this section analyzes the influencing factors of loom shutdown by comparing the warp and weft stoppages of the loom during the production of different fabric varieties.
The different fabric varieties produced by the loom are mainly determined by the product process parameters and the yarn components used during the production of the fabrics. Figure 3 records the warp and weft stoppage situations of the same loom under the production process requirements of six different fabric varieties after 15 days of production. Table 3 records the process parameters corresponding to each variety in Figure 3. By combining the data from Table 3 and Figure 3, it can be found that the number of warp and weft stoppages during loom weaving is directly proportional to the required warp and weft density parameters of the fabric; as the warp and weft densities increase, the number of warp and weft stoppages during the weaving process also increases. Moreover, the number of warp and weft stoppages is also related to the thickness of the yarn used; when the yarn’s count parameter is larger, indicating that the yarn is thicker, the number of stoppages during the weaving process is fewer compared to when the yarn’s count parameter is smaller and the yarn is thinner.
Table 3 Comparison of Process Parameters of Different Varieties
Tab.3 Comparison table of process parameters of different varieties
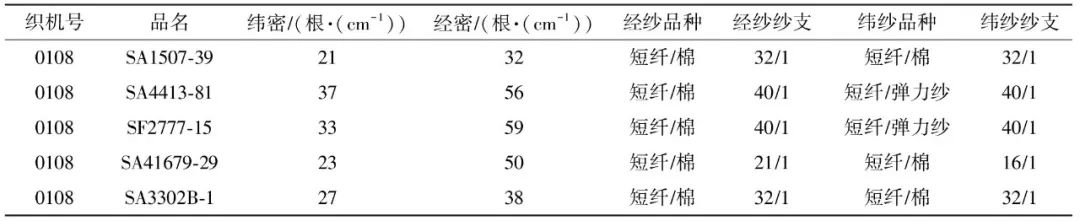
Figure 3 Warp and Weft Stoppage Counts under Different Varieties
Fig.3 Stop times of warp and weft under different varieties
LSTM Recurrent Neural Network
Based on the analysis of the influencing factors on loom shutdown time in the second section, it is evident that each factor has a strong temporal correlation with the shutdown time, and the data of the loom exhibits time-varying characteristics. This paper employs LSTM recurrent neural networks to construct the loom shutdown prediction model.
Long Short-Term Memory (LSTM) recurrent neural networks are a type of recurrent neural network with selective memory functions [10]. By updating the cell states at each moment, they can learn time series information of varying lengths. They introduce a gating mechanism to control the flow and loss of information features based on traditional recurrent neural networks (RNNs) [11]. This prevents issues such as gradient vanishing and explosion when dealing with time-sensitive sequential data like loom shutdown predictions and demonstrates outstanding data fitting capabilities. Each neuron in the LSTM network is primarily composed of a forget gate, an input gate, an output gate, and a cell state.
3.1 Model Construction
This paper constructs the loom shutdown time prediction model based on LSTM recurrent neural networks. First, rather than directly defining the training and testing data proportions, this paper calculates the time progress coefficient for optimizing the model during each iteration based on the production time span of the loom on the target loom beam contained in the dataset, dynamically adjusting the data proportions of the training and testing sets. This approach better reflects the real changes in the amount of training data that the model can learn as production time progresses, comprehensively reflecting the model’s learning and generalization capabilities throughout the lifecycle of the loom beam. Secondly, by regularly solving the remaining theoretical weaving length, the influence of other stoppage factors on the loom shutdown time prediction is weakened, improving the prediction accuracy of the model. The model construction process is shown in Figure 4.
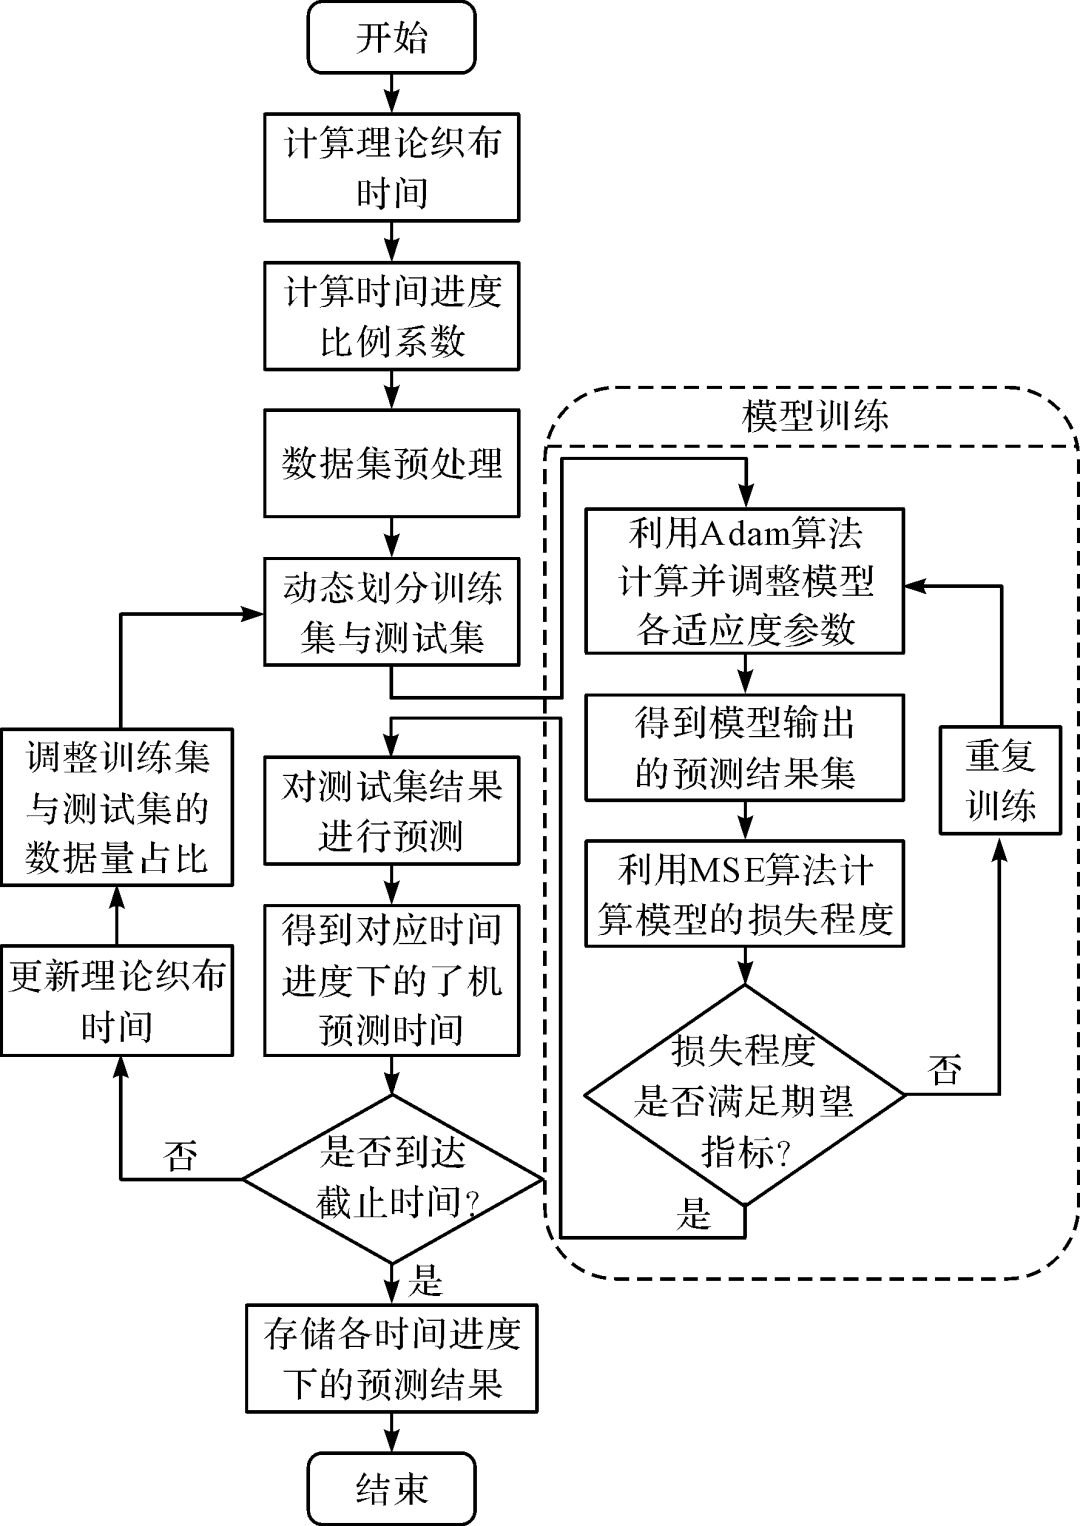
Figure 4 Model Building Flow Chart
3.1.1 Establishment and Preprocessing of the Dataset
This paper uses the analysis of the influencing factors on loom shutdown time from the second section as a basis, dividing the entire lifecycle of the loom beam into n equal parts, and collecting the production time segments (ti), the technical level of the loom operator (ri), the composition of the warp yarn, the count of the warp yarn, the weaving density of the warp yarn, the composition of the weft yarn, the count of the weft yarn, and the weaving density of the weft yarn to obtain n sets of 8-dimensional input data vectors. The consumption times for warp and weft stoppages generated in each time segment are collected to obtain n sets of 2-dimensional output data vectors. The data vectors for the same loom beam throughout the entire cycle are consolidated to form the input dataset (Cx) and output dataset (Cy) with time series characteristics. The overall composition of the dataset is shown in equation (4).
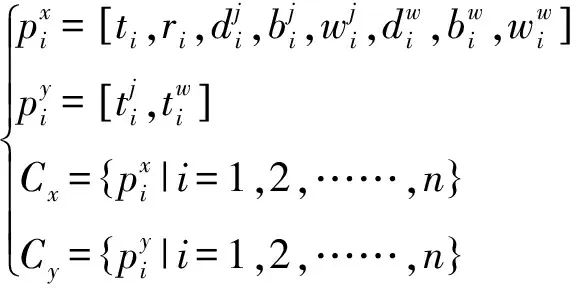
(4)
To avoid the situation where the small magnitude feature values in the selected input dataset weaken the influence of the large magnitude feature values on the results during model training due to inconsistent dimensionality, this paper adopts the max-min data normalization method [12] to preprocess the input dataset. Without affecting the relative relationships between feature values, the method maps the feature values in the input dataset to a specific area, improving the comparability between data and accelerating the iteration convergence speed of model optimization. The calculation of the max-min data normalization method is shown in equation (5).
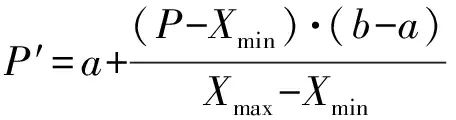
(5)
In the equation, P is the element value to be normalized; P′ is the processed value after normalization; Xmax and Xmin are the maximum and minimum values of the elements in the vector containing element P; a and b are the boundary values for element mapping.
3.1.2 Division of Training and Testing Sets
To better meet actual production needs, the proportion of the training and testing sets for validating the model’s reliability is not fixed. Before the specified prediction deadline, the proportion of the data volume for the training and testing sets is dynamically changed in each iteration according to the time progress coefficient, allowing the model to continuously learn in real-time according to actual production conditions, adjusting the weights and biases of each unit in the model to achieve more accurate predictions that align with actual production conditions.
The steps for dynamically adjusting the data volume for model optimization iterations are as follows:
a) Calculate the total time over the entire lifecycle of the loom beam.
b) According to the required indicators, calculate the prediction accuracy requirements that the prediction model needs to achieve, computing the time progress coefficient for each iteration of the model.
c) Based on the calculated time progress coefficient, dynamically adjust the data volume ratio between the training and testing sets before each optimization iteration of the model. The dynamic adjustment of data between the training and testing sets is driven as shown in equation (6).
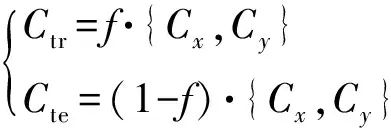
(6)
In the equation, Ctr is the model’s training set; Cte is the model’s testing set; f is the time progress coefficient, which changes in the range of 0
3.1.3 Model Training and Prediction
a) Use the Adaptive Momentum (Adam) gradient descent algorithm to calculate and adjust the model’s adaptive parameters. The Adam optimization algorithm combines the advantages of both adaptive learning rate gradient descent and momentum gradient descent algorithms, improving fitting efficiency under sparse gradients while ensuring that the adjustment of weights and biases for each neuron does not cause the model to fall into local optima during gradient oscillations.
b) Use the Mean Square Error (MSE) algorithm to compare the loss between the predicted result set and the actual target result set. MSE is the most commonly used error comparison algorithm in regression loss functions, representing the mean of the squared differences between the predicted value f(x) and the target value y. The loss function measures the model’s prediction performance. Its calculation is shown in equation (7).
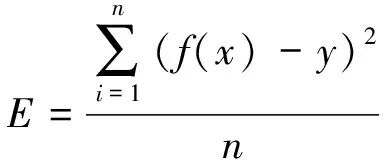
(7)
In the equation, E is the loss degree after comparing the model’s predicted value with the actual value; f(x) is the predicted value obtained from the model; y is the actual expected target value; n is the degree of freedom.
c) Determine whether the loss degree meets the expected indicators. The loss degree obtained each time is compared with the expected loss value. If the current loss degree of the model meets the expected error indicator requirements, training ends. If the current loss degree of the model is too large, training is repeated, and the model’s adaptive parameters are adjusted to optimize the model’s fitting ability. The constraints on the model’s loss degree are shown in equation (8).
Ep≤Ee
(8)
In the equation, Ep is the loss degree of the model’s predicted result compared to the actual result; Ee is the expected loss degree.
d) Predict the loom’s shutdown time. By calculating the theoretical weaving time of the loom at various time progress points, the total warp and weft stoppage time consumed in processing the target loom beam, and the actual warp and weft stoppage time that has occurred, the predicted loom shutdown time at each time progress point can be obtained. The calculation of the predicted loom shutdown time at each time progress point is shown in equation (9).
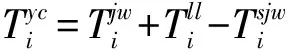
(9)
In the equation, the predicted loom shutdown time at time progress i is  is the predicted warp and weft stoppage time at time progress i,
 is the calculated theoretical weaving time at time progress i,
 is the actual warp and weft stoppage time generated before time progress i, in hours.
Model Prediction Evaluation
This paper evaluates the actual prediction performance of the model based on data collected from a textile factory in Jinhua Lanxi City and the survey results. The weaving data collected in February 2022 was selected.
4.1 Model Verification
The production data of a specific loom beam throughout its lifecycle is used as the dataset to verify the reliability of the model. First, the start time (2022-02-13 02:19:14) and end time (2022-02-21 19:47:27) recorded during the processing of the loom beam are used to calculate the total production time of the beam as 209.47 hours. According to the analysis of the prediction indicators, the total production time of the beam is divided into 150 equal parts, controlling the interval of each loom shutdown prediction iteration to be within 2 hours to refine the training iteration frequency and improve prediction accuracy, meeting the error indicators. The model’s prediction results are shown in Figure 5.
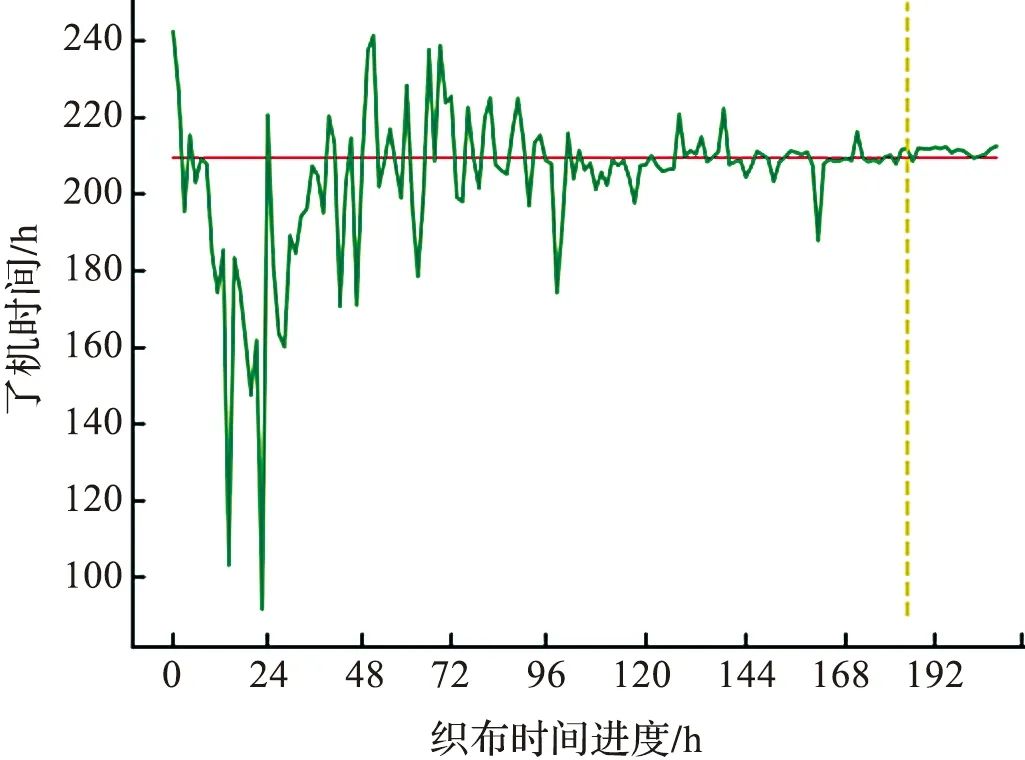
Figure 5 Model Prediction Results (Overall)
In Figure 5, the horizontal axis represents the actual weaving time progress of the loom, and the vertical axis represents the time used for loom weaving. The red solid line indicates the actual weaving time of the loom is 209.47 hours, while the green line represents the model’s predicted weaving duration at each scheduled prediction. As observed in Figure 5, as the loom’s production time progresses, the model gradually learns more actual production data, and the overall prediction trend of the model approaches the actual value. The dashed line in Figure 5 marks the latest deadline for which the model’s prediction is considered relevant (the day before actual shutdown). Combined with the demand indicators, the model’s predictions before the deadline have reference value.
To verify whether the prediction accuracy of the model meets the actual demand indicators, the actual weaving time progress range in Figure 5 is narrowed down to the mid-point of weaving (weaving time progress 104.74 hours) to the end of weaving. The model’s prediction situation within the range from mid-weaving to the end of weaving is shown in Figure 6.
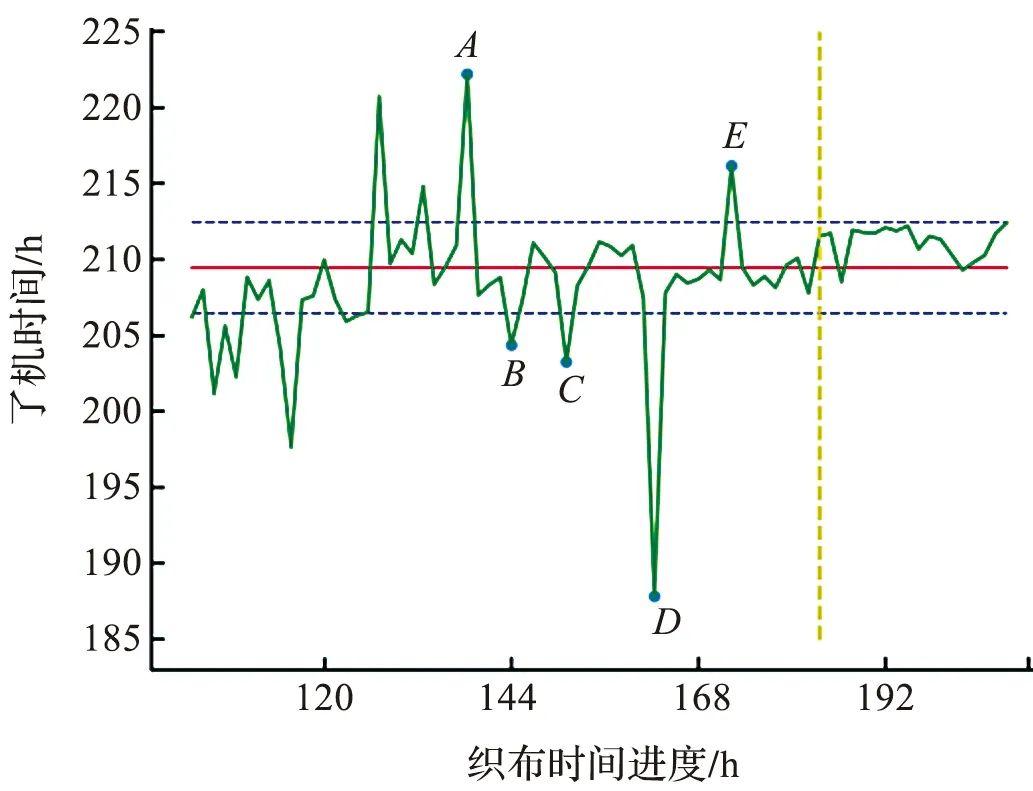
Figure 6 Model Prediction Results (Local)
In Figure 6, the dashed line indicates the upper limit (212.47 hours) and lower limit (206.47 hours) of the loom weaving prediction time within an acceptable error range. It can be seen from Figure 6 that within the two days leading up to the deadline (weaving time progress 137.47–185.47 hours), the model produced five prediction results exceeding the acceptable error range, corresponding sampling points being A-E, with actual loom shutdown time differences of 12.73, -5.07, -6.20, -21.61, and 6.70 hours, respectively. This indicates that the model exhibits instability in its prediction results.
4.2 Model Performance Optimization Processing
Based on the analysis of the model’s prediction situation in section 4.1, it is evident that the model’s prediction accuracy does not meet the actual demand indicators. The reason lies in the dynamic adjustment of the training and testing set data volume, which, while aligning with reality and continuously learning, cannot determine the optimal number of iterations for the model in advance. During the learning process for the new data volume in the training set, the model may experience underfitting or overfitting, causing it to miss or not reach the minimum loss value, resulting in unstable prediction performance.
Through the analysis above, this paper proposes to set a dynamic loss change threshold during model training to enhance the model’s generalization ability. The process for dynamically setting the loss change threshold is shown in Figure 7.
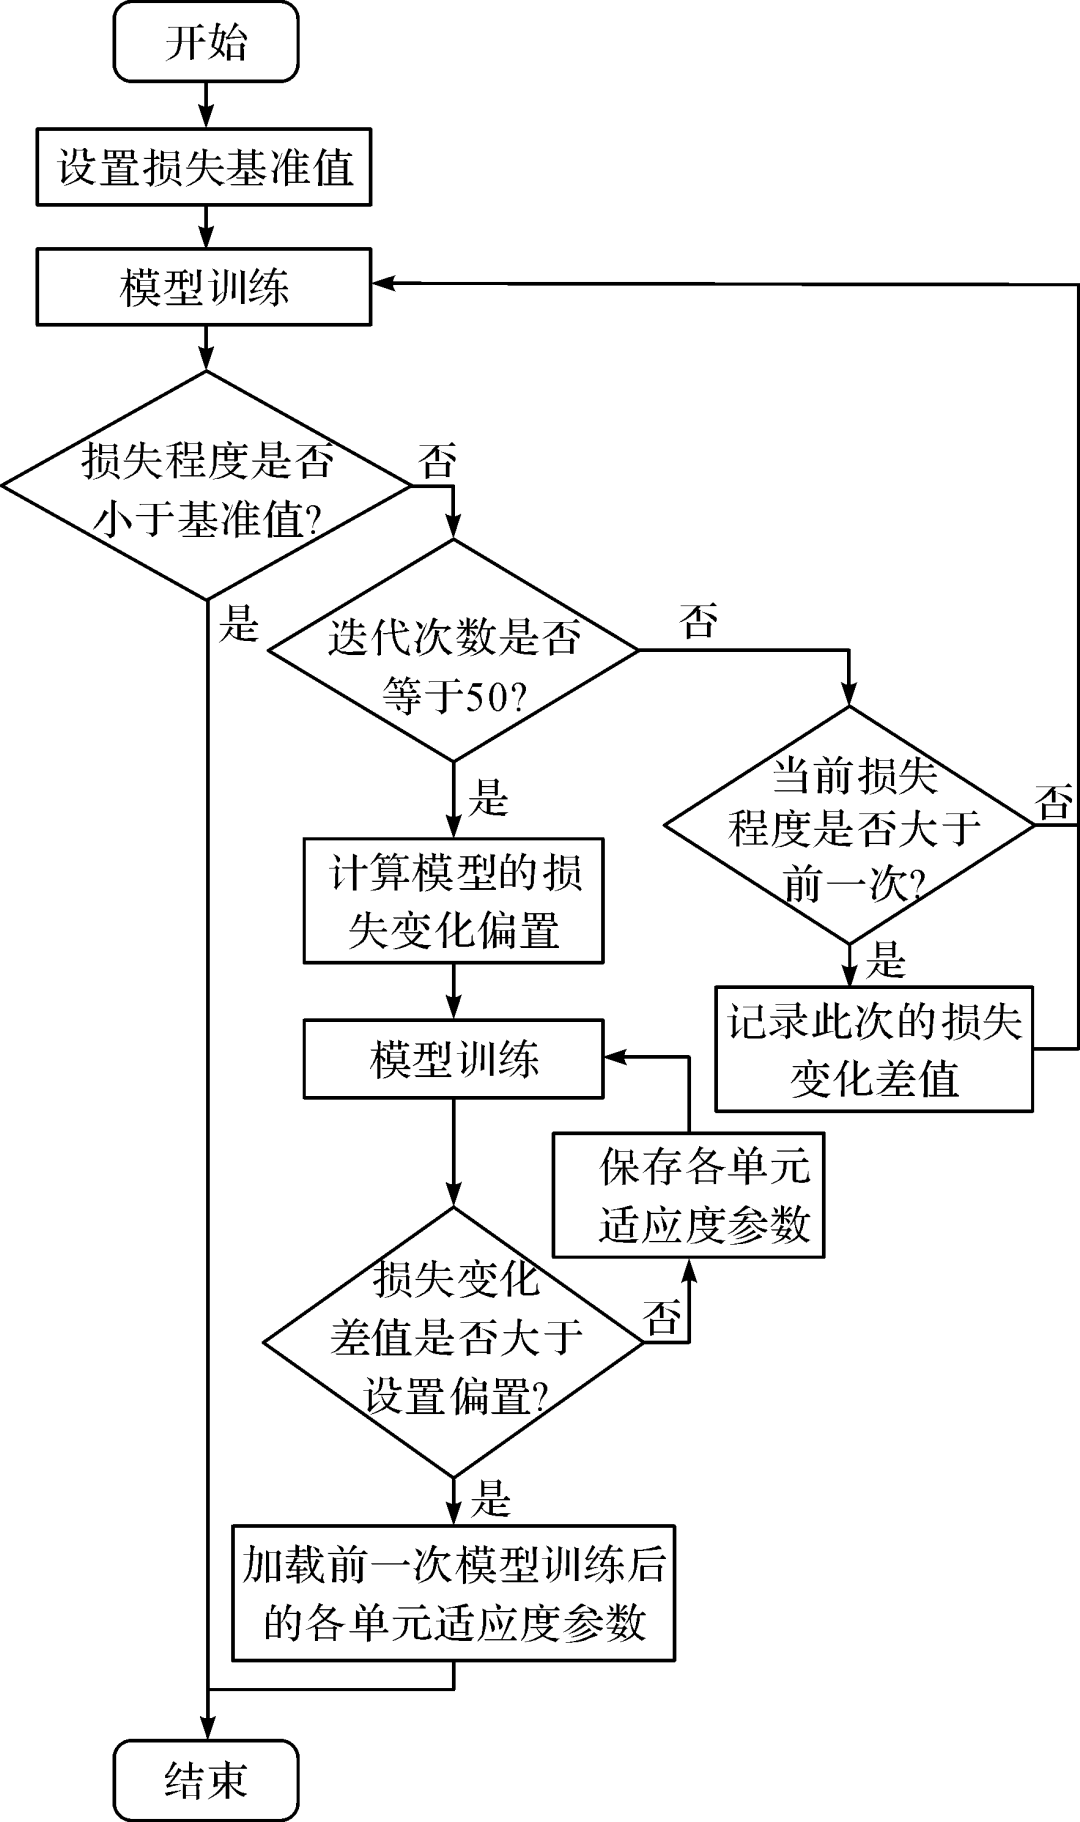
Figure 7 Model Optimization Flow Chart
The specific steps for setting the dynamic loss change threshold are as follows:
a) Record the loss change difference greater than zero during the first 50 iterations of training the model. The calculation of the recorded loss change difference is shown in equation (10).
Δe=ec-el
(10)
In the equation, Δe is the recorded loss change difference, which is greater than zero; ec is the loss value after the current model training; el is the loss value after the previous model training.
b) Calculate the loss change threshold corresponding to the current training set, which is the average of the recorded loss change differences. The calculation of the loss change threshold is shown in equation (11).
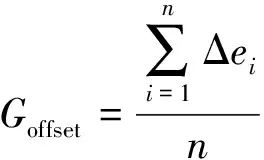
(11)
In the equation, Goffset is the loss change threshold; Δei is the i-th loss change difference; n is the number of recorded loss change differences.
c) Using the calculated loss change threshold, seek suitable iteration counts and loss values. If the loss value obtained from the current model training is greater than the sum of the previous loss value from the model training and the loss change threshold, the model training ends, and the results from the previous training are taken as the final results. This means that the model training results meet the condition shown in equation (12).
ec-el>Goffset
(12)
To verify the improvement in model prediction performance due to the dynamic loss change threshold, the validation dataset from section 4.1 is used again, comparing the loss degree during training iterations of the dataset before and after model optimization. Figure 8 shows the loss degree changes when the model was trained for a fixed 250 iterations on the dataset with 61% data volume before optimization, and the data changes when the iteration count and loss values are dynamically determined based on the loss change threshold after optimization. The dashed line in Figure 8 indicates the loss degree change of the model before optimization. It can be observed that the model’s loss values during the 71st, 100th, 102nd, 187th, and 190th iterations are relatively small, being 10.3, 10.5, 10.4, 9.2, 9.1, and 13.6, respectively. The last iteration’s loss value is 13.6, which is not the best in the entire iteration training, and setting too many iteration counts also raises issues of time and resource consumption for model training.
The solid line in Figure 8 indicates the loss change differences calculated from the first 50 iterations after model optimization, being 0.021, 0.076, 1.136, 0.026, 2.069, 0.880, 1.120, 0.124, and 1.230, resulting in a loss change threshold of 0.74. Using this calculated loss change threshold confirms that the final training result of the model is at the 71st iteration, with a final training loss value of 10.3, as indicated by point e in Figure 8. Although the final training result obtained through the shown variation bias algorithm is not the best in the 250 iterations, it is still considered a good result when considering both model training time and accuracy.
Figure 9 compares the overall training time and loss degree during training iterations on the validation dataset before and after model optimization. Figure 9(a) is the training time comparison chart, where the light red represents the training time for the model before optimization, with a total time of 15.70 hours and an average time of 376.65 seconds. It can be observed that under the condition of fixed 250 training iterations, as the time progresses and the amount of training data increases, the time consumed per training set gradually increases. The dark blue represents the training time corresponding to the model after optimization, with a total time of 3.21 hours and an average time of 77.67 seconds, showing a significant decrease in training time for the model under the same data volume. Figure 9(b) compares the loss degrees before and after model optimization, where the light green represents the loss degree before optimization, with an average loss degree of 11.55, while the dark purple represents the loss degree after optimization, with an average loss degree of 3.21.
It is evident that the optimized model has significantly improved in both training time and loss accuracy.
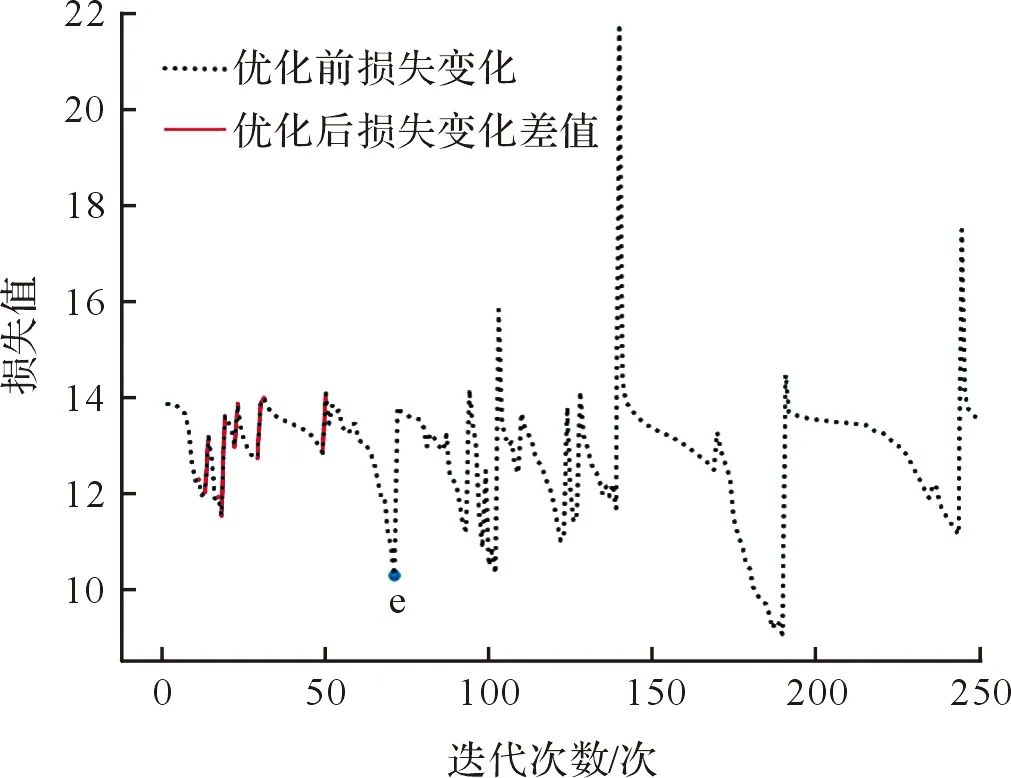
Figure 8 Comparison Diagram of Training Before and After Model Optimization
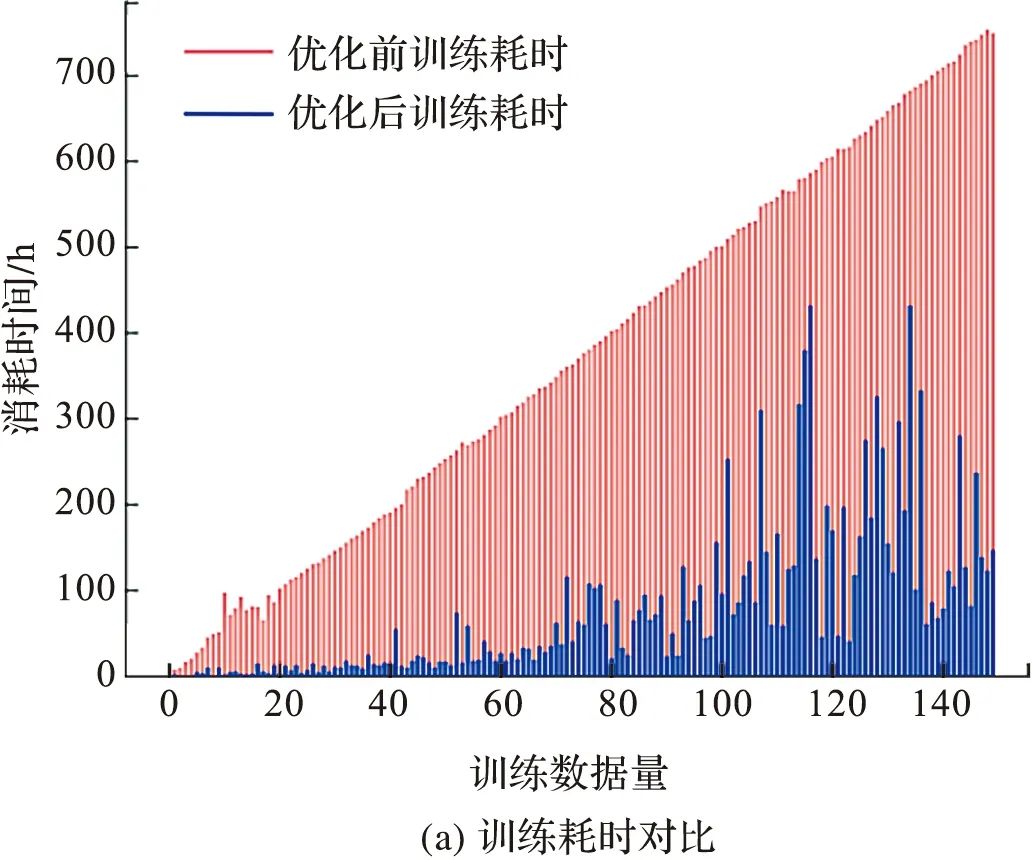
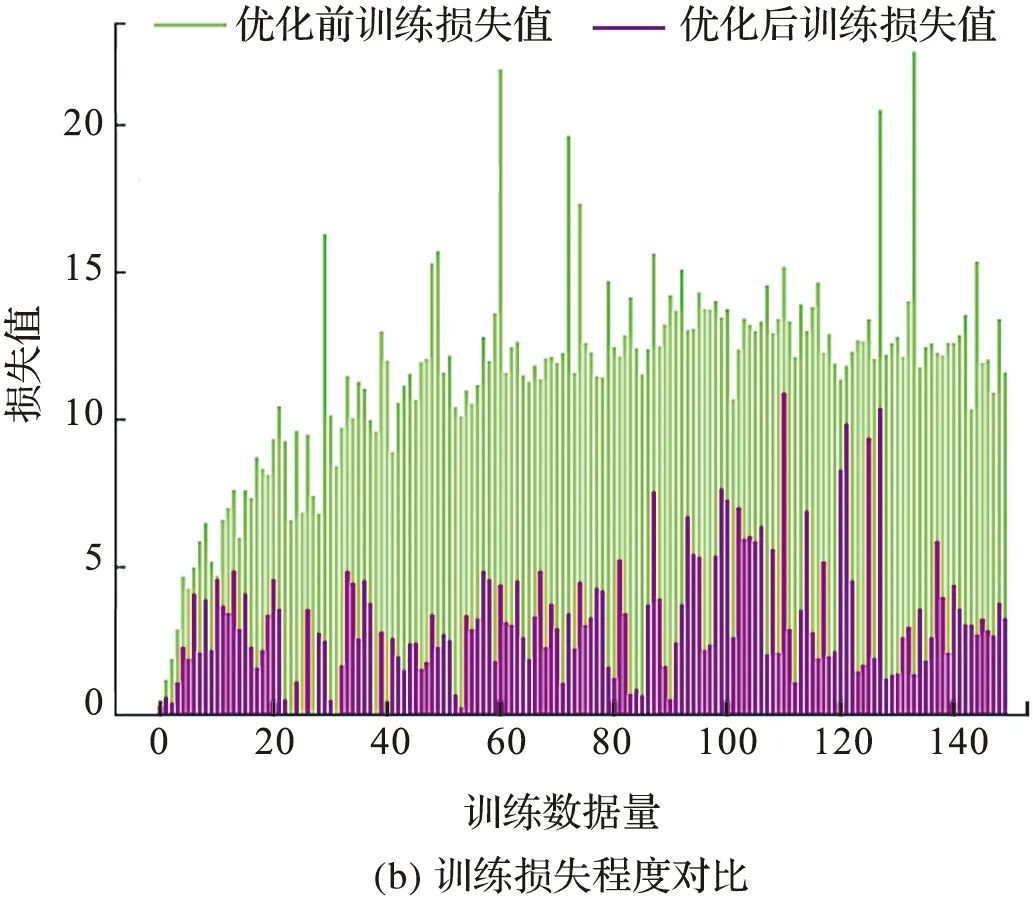
Figure 9 Comparison of Training Time and Loss Degree
Using the optimized model to predict the loom shutdown time for the same loom beam in section 4.1, Figure 10(a) shows the model’s shutdown time prediction under different time progress points throughout the entire lifecycle of the loom beam. Figure 10(b) shows the model’s shutdown time prediction within the local time range from mid-weaving (weaving time progress 104.74 hours) to the end of weaving. As observed in Figure 10(b), the prediction results have approached the actual values within the two days leading up to the deadline, and the prediction results remain stable within the allowed error range.
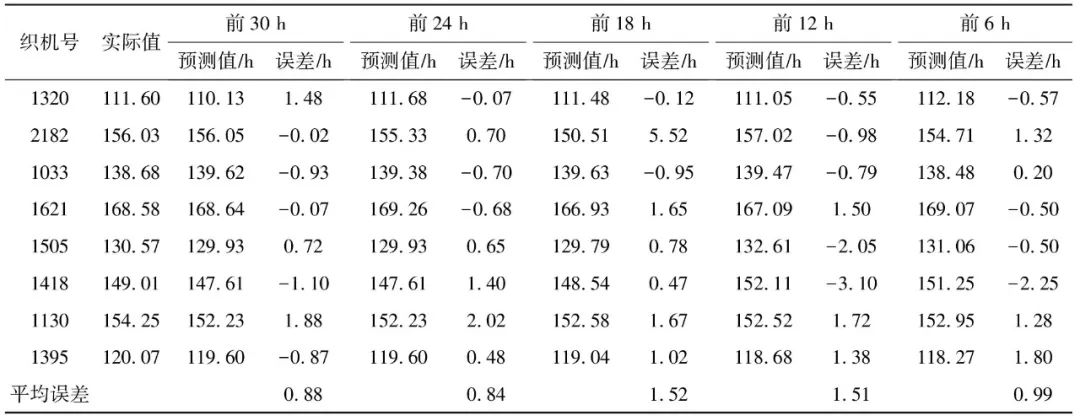
To verify the model’s generalization ability, eight sets of data were randomly selected for validation, with results shown in Table 4.
From Table 4, it can be seen that in the 30 hours, 24 hours, 18 hours, 12 hours, and 6 hours leading up to the prediction deadline, the average errors between the model’s predicted values and actual values are 0.88, 0.84, 1.52, 1.51, and 0.99 hours, respectively. The model’s prediction situation meets the indicator requirements.
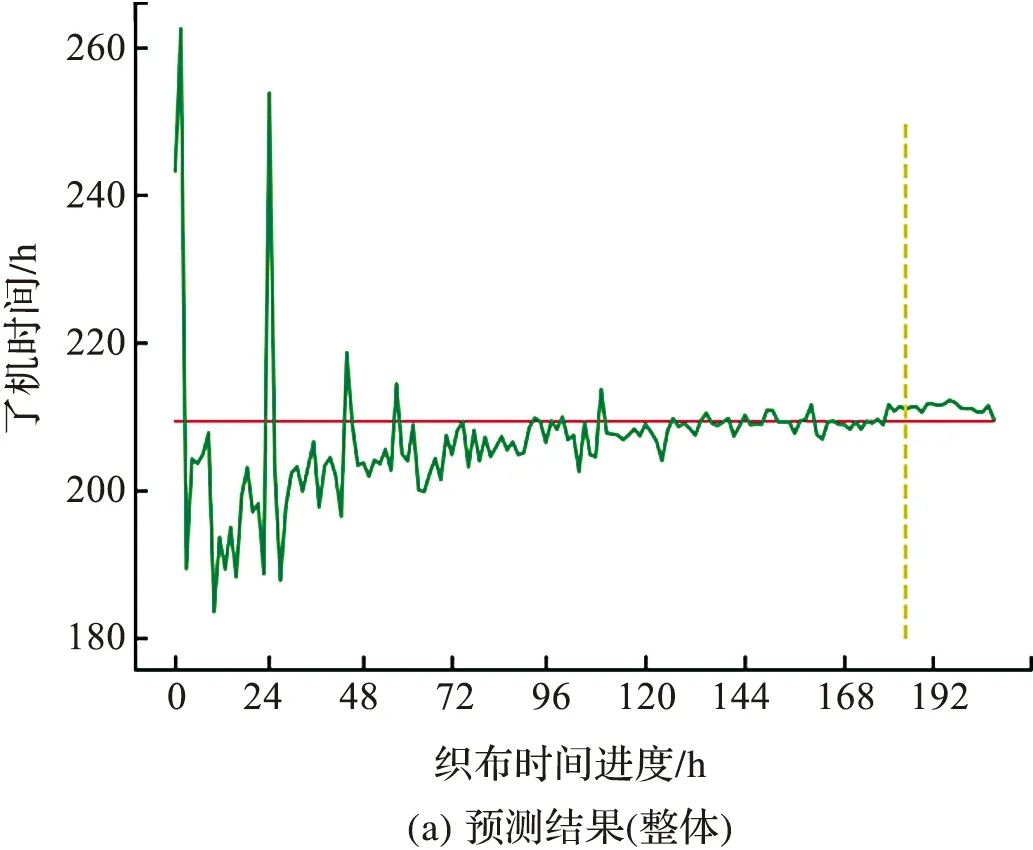
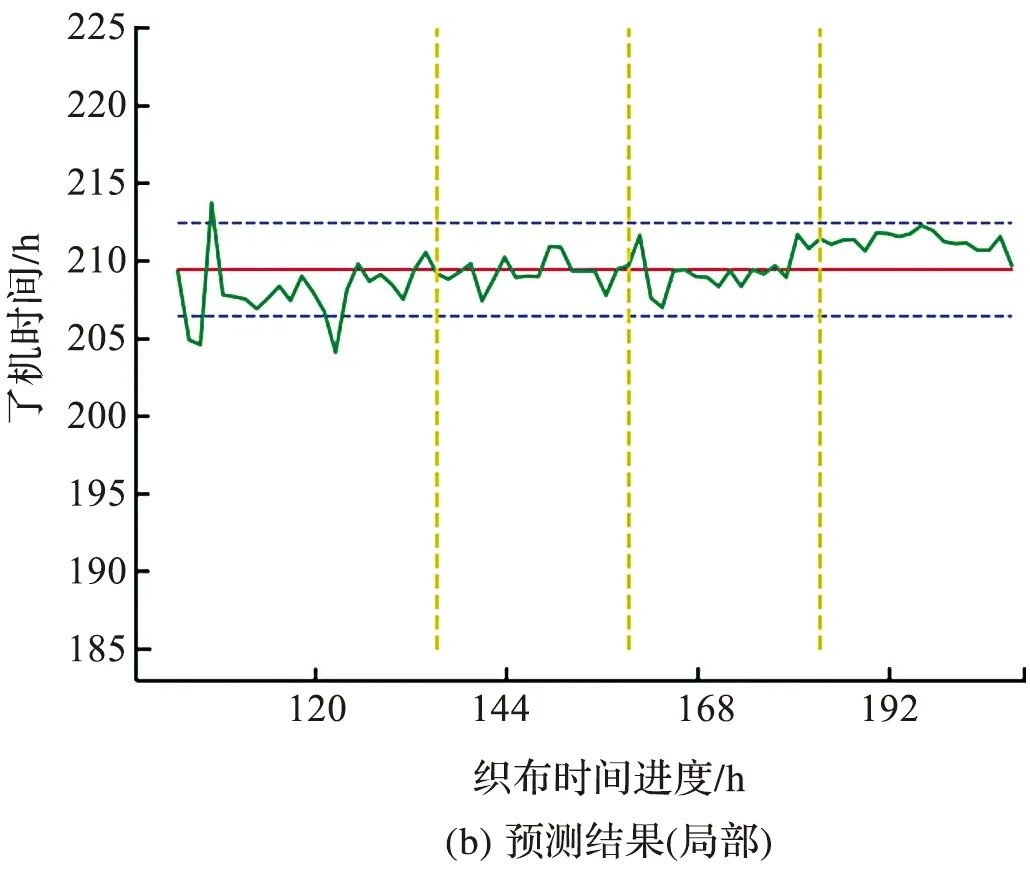
Figure 10 The Graph of Prediction Results After Model Optimization
Table 4 Prediction Result Statistics
Tab.4 Prediction result statistics