Using machine learning for investment has always been a popular subject. In recent years, deep learning models have attracted a lot of attention, especially in the field of computer vision. Therefore, the paper introduced here provides a brand new approach by using the currently hottest computer vision neural network: Convolutional Neural Network (CNN) to predict stock price movements. Experimental results show that it performs better than traditional neural networks.
You may ask, in terms of time series, why use CNN when neural networks like LSTM can be used? LSTM should be more suitable for handling time series data! (After all, LSTM is designed for processing sequences, which are also a form of time series, so people usually use LSTM for stock price predictions). However, the paper explains that CNNs have been researched more thoroughly for image processing compared to other models, and there is a significant amount of research suggesting they may yield better results. Thus, CNN neural networks are adopted to predict stock price movements.
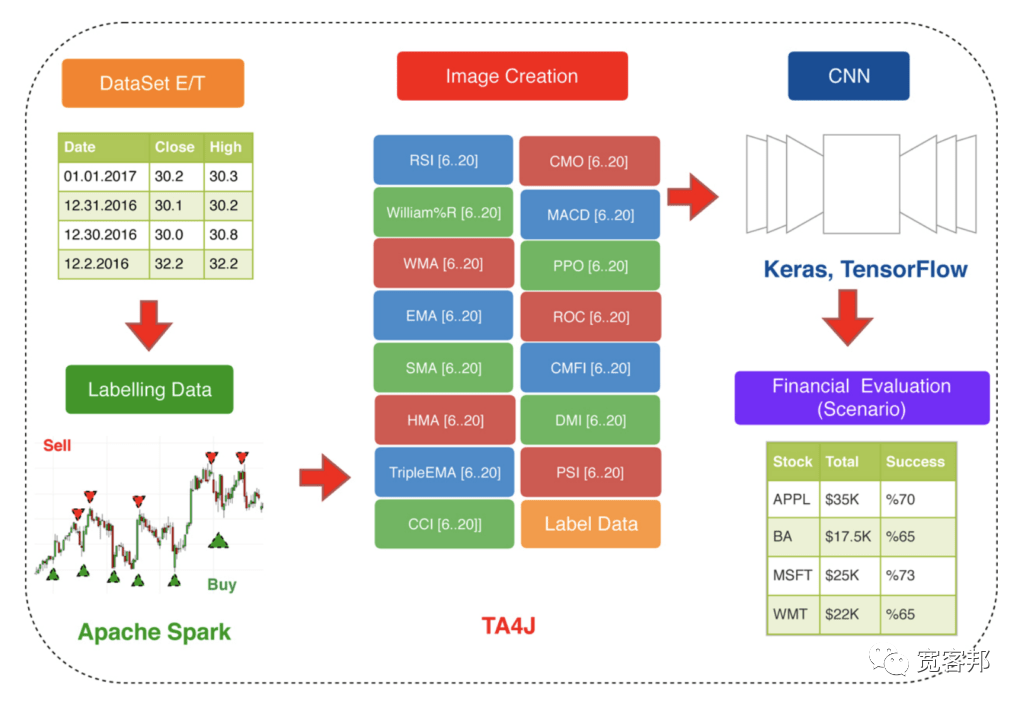
They used 15 technical indicators over 15 days to generate a 15×15 image, which was then fed into the CNN for training. The following image shows the input that the neural network “sees”:
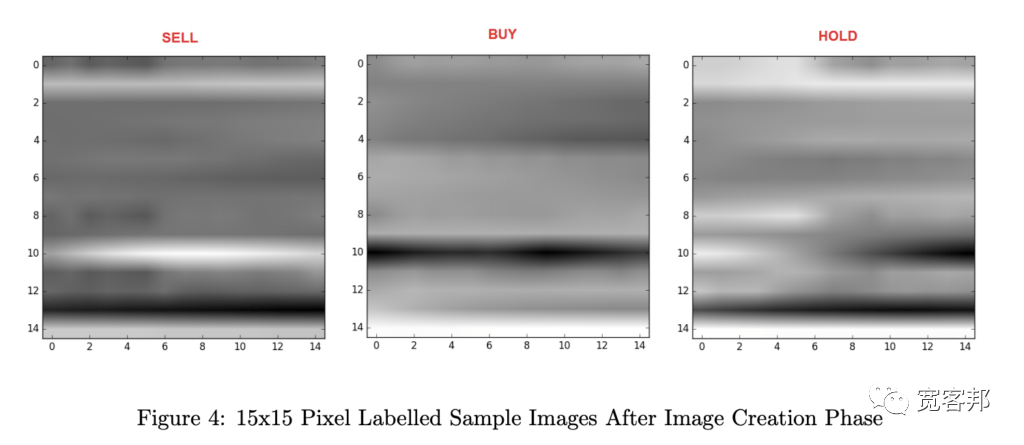
To humans, this image may seem meaningless, but for a computer, it can be used to determine stock price movements! We refer to these images as features, which are signals used by the computer to make buy/sell judgments. Using these signals, the computer can predict trading signals, which are the labels for this neural network. The author provides a simple method using a rolling window to find the maximum and minimum values for each time segment, and the following is the main code.
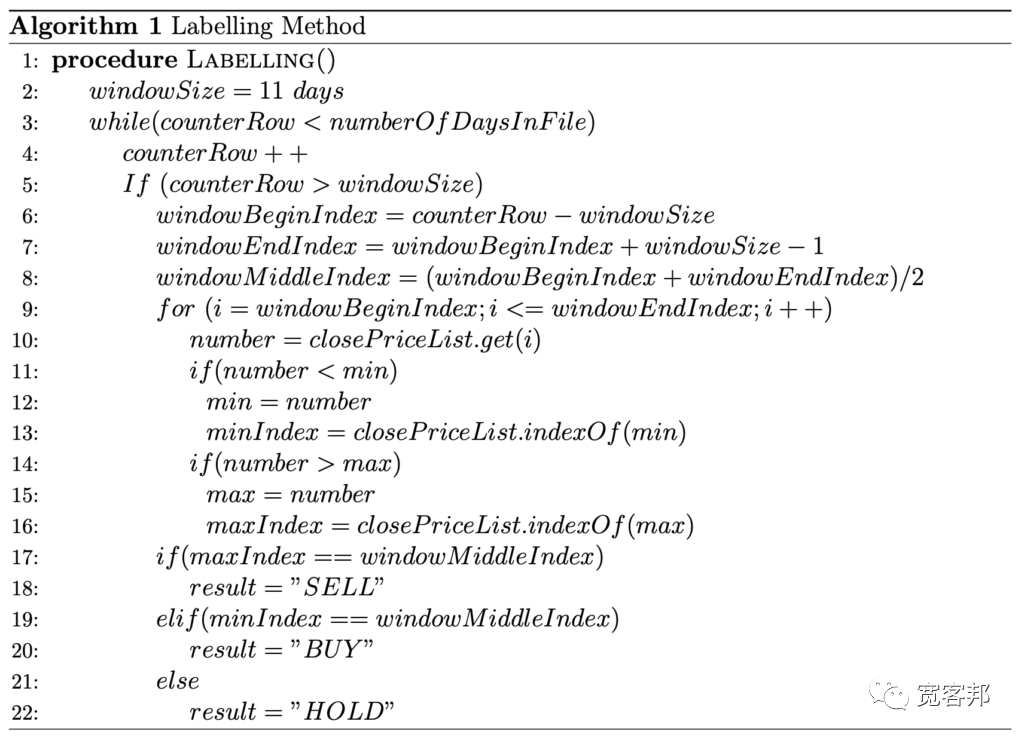
The method described above produces signals of (-1, 0, 1), representing (sell, hold, buy) respectively. However, the signals generated by the above code will inevitably have an imbalance problem, meaning the counts of the three classes are not consistent. Therefore, this article uses random resampling to randomly select an equal number of test cases corresponding to each label, to avoid having too many zeros.
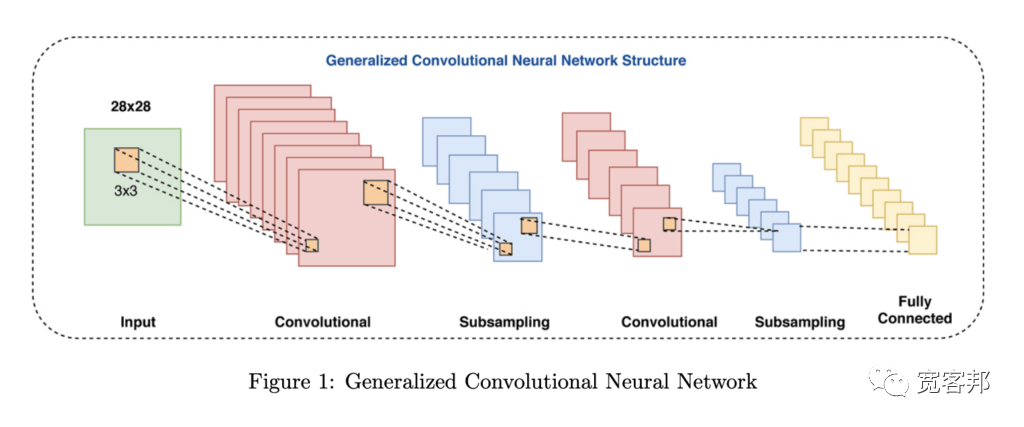
This paper uses US stock ETFs and the Dow Jones 30 components as training targets. With features and labels in hand, it is natural to begin training! The neural network of this paper is as follows:
-
input layer (15×15),
-
two convolutional layers (15x15x32, 15x15x64),
-
max pooling (7x7x64),
-
two dropout layers (0.25, 0.50),
-
fully connected layers (128),
-
output layer (3)
In the architecture above, the input is simply a 15 x 15 image, and the output has 3 categories: buy, sell, and hold. Regarding the intermediate convolutional layers and pooling, the author states that due to the small size of the training dataset, the neural network does not need to be too large, otherwise it would lead to overfitting.
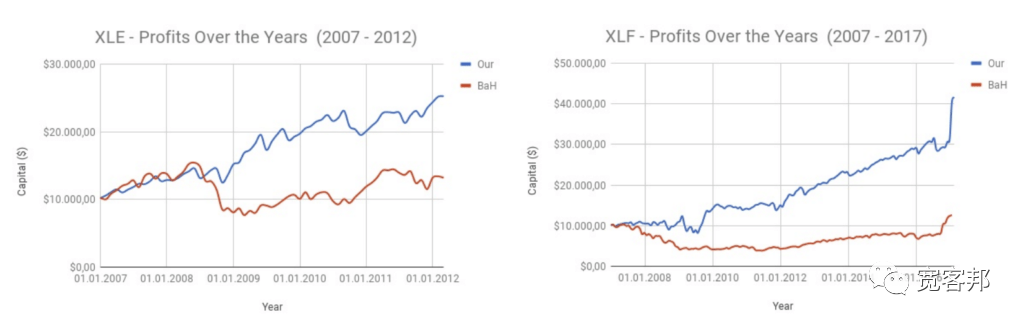
This paper uses a walk-forward method for testing, which has the advantage of producing longer backtest results. The following shows their backtesting results (including two ETFs):
They also compared the results with other neural networks using several common methods:
-
CNN-TAr: The method used by the authors
-
BaHr: The so-called buy and hold long-term strategy
-
RSIr: A strategy based on the RSI technical indicator
-
SMAr: Moving average strategy
-
LSTMr: Neural network strategy pip
-
MLPr: General neural network strategy
The following image shows the annual return rates corresponding to the products (each row) and different strategies (each column):
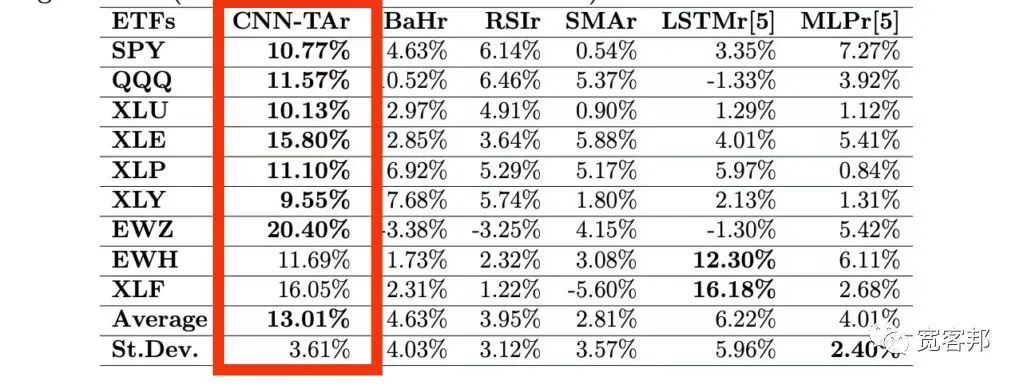
We can see that the CNN-TAr neural network performs better than the others! Moreover, it has a better annual return rate for most products.
Scan the QR code at the bottom of this article to download the original paper in a package.
↓↓Long press to scan and get the complete paper↓↓