
Understanding MR Imaging Technology
FLAIR sequence stands for Fluid Attenuated Inversion Recovery. Water can be pure water or ionic water, combined water. Ionic water is mainly found in cerebrospinal fluid in the ventricles and subarachnoid space, and in simple fluid cysts. Due to its single composition, water molecules can move freely and quickly; combined water is formed when free water molecules bind to hydrophilic macromolecules such as proteins, creating a layer of bound water on the protein surface, which cannot move freely. In conventional T2WI, both ionic and combined water are high signals. For example, in brain tissue, cerebrospinal fluid, subarachnoid cysts, and softened lesions after cerebral embolism are ionic water, while cysts containing protein, hemorrhagic cysts, epidermoid cysts, vascular edema, interstitial edema, and solid tumors are all combined water. T2FLAIR can reduce the signal of ionic water, displaying the nature of lesions containing ionic water or showing lesions at the edges of ionic water, while correspondingly increasing the signal contrast of combined water, making combined water present a very high signal, facilitating lesion detection.
Question 2: Do T1FLAIR and T2FLAIR have diagnostic significance?
IR stands for Inversion Recovery sequence, which mainly applies a 180° inversion pulse, characterized by the TI (Time Inversion) inversion time. It has two features: optimal T1 contrast, significantly higher than SE T1WI; only one echo is collected at a time, and the TR time is very long. The collection time for FLAIR sequences is significantly shorter. T1FLAIR and T2FLAIR have different diagnostic significances in clinical applications. T1FLAIR has excellent anatomical contrast, significantly increasing T1 contrast between brain gray and white matter, which is highly valuable for studying myelination in children and shows good results in diagnosing brain tumors and other lesions. T2FLAIR mainly reduces the signal of ionic water, such as cerebrospinal fluid, allowing clear display of lesions adjacent to cerebrospinal fluid or determining whether lesions contain ionic water, increasing the signal contrast between combined water and normal tissue, such as clearly showing cystic changes, necrosis, and extensive edema signals around tumors.
Question 3: Are FLAIR and Dark-Fluid the same?
FLAIR and Dark-Fluid (black water sequence) refer to the same sequence but different companies use different names for the same technology; Siemens calls it Dark-Fluid. Clinically, both are primarily used for diagnosing conditions in the central nervous system. They are used to display components containing ionic and combined water. Note that there is now a consensus that FLAIR is directly combined with FS fat saturation or STIR fat suppression, making lesion display contrast more pronounced, but provides no additional help in diagnosing lesions.
Imaging Thought Process 057: An elderly female with a vascular rich occupying lesion in the sacrum? Pathology result: cavernous hemangioma.
Imaging Quiz: An elderly patient with bilateral basal ganglia T1 high signal, what is your diagnosis? Discharge diagnosis: hepatic encephalopathy manganese deposition.
The following images are derived from “Technical Guidelines for Magnetic Resonance Imaging” by Yang Zhenghan, Feng Feng, Wang Xiaoying.
Question 1: What are diamagnetic, paramagnetic, superparamagnetic (ferromagnetic), and ferromagnetic materials? What substances and tissues do they include?
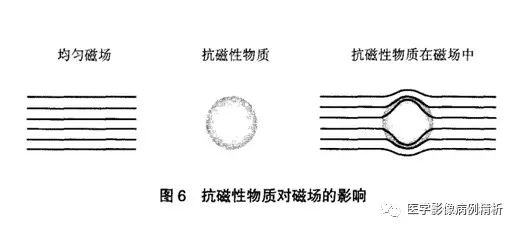
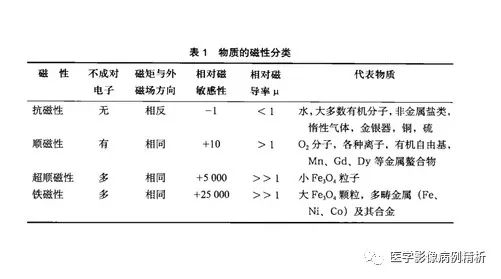
Magnetic susceptibility, also known as magnetic permeability, refers to the degree or ability of a substance to be magnetized under an external magnetic field. It is represented by the symbol X, and the magnetic properties of substances are classified from weak to strong as diamagnetic (X<0), paramagnetic (X>0), superparamagnetic (ferromagnetic), and ferromagnetic (X>>0). Diamagnetic materials exhibit magnetic moments opposite to the direction of the external magnetic field, weakening its effect. This is mainly due to the paired electrons in the constituent atoms, which do not form a net magnetic moment.
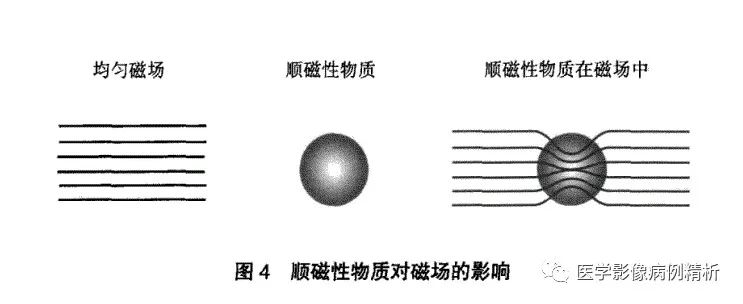
Paramagnetic materials exhibit magnetic moments in the same direction as the external magnetic field, slightly enhancing its effect. This is mainly due to the presence of unpaired electrons in the constituent atoms, forming a disordered net magnetic moment.
Ferromagnetic materials, such as iron, nickel, and cobalt in solid or crystalline forms, exhibit magnetic moments in the same direction as the external magnetic field, with a very large magnetic moment capability, producing significant effects on the magnetic field, even creating very large artifacts. They exhibit hysteresis or magnetic memory effects and retain magnetism even after leaving the magnetic field.
Superparamagnetic (often referred to as ferromagnetic) materials are composed of small metal particles (e.g., Fe3O4) and have moderate magnetic susceptibility, greater than paramagnetic but less than ferromagnetic, without hysteresis or magnetic memory effects, serving as the physical basis for MRI enhancement. (To draft an article: What is the physical basis of MR enhancement? How does MR enhancement differ from CT enhancement?)
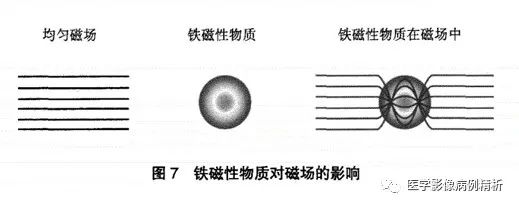
Various magnetic materials are shown in the figure; it is important to note that while the following materials exhibit certain magnetic properties, their magnetism may change with alterations in chemical structure. For example, large molecular iron exhibits significant ferromagnetism, such as certain artificial prostheses, bone locks, etc., which can produce strong magnetic susceptibility artifacts; small molecular iron exhibits superparamagnetism and can be used as contrast agents for enhancing MRI, shortening T1 time and presenting high signals, while hemosiderin also shortens T2 time far more than T1 time, resulting in significantly low signals in T2WI; iron molecules in oxyhemoglobin and deoxyhemoglobin exhibit diamagnetism and weak paramagnetism, presenting equal or low signals in T1. These contents will be gradually elaborated in future articles.
Question 2: What is the clinical diagnostic significance of T1 high signals (short T1)?
The T1 high signals mentioned in this article specifically refer to certain substances or tissues, not specifically tied to certain diseases. Common examples include subacute hematomas, fat, calcium, manganese, melanin, and large molecular mucoproteins, as well as the posterior lobe of the pituitary gland. It is particularly important to note that subacute hematomas are indeed oxyhemoglobin, where the iron molecules can shorten T1 time, exhibiting the strongest effect and the highest signal, thus showing T1 high signals (to draft an article: What are the characteristics of MR hematoma signals and their clinical diagnostic significance?). Normal calcified lesions contain no hydrogen protons, resulting in no signal acquisition, thus presenting low signals. It is important to note that the signal from calcium molecules depends on the crystalline structure of the bound calcium; if the crystalline structure is rough enough to accommodate other components, it can easily shorten T1 time and present high signals (to draft an article: What are the characteristics of calcified lesion signals and their clinical diagnostic significance?). Manganese has a shortening effect on T1 time, and if liver diseases affect manganese metabolism, leading to manganese deposition in the basal ganglia of the brain, T1 high signals occur. Typical melanin exhibits T1 high signals and T2 low signals, noting that pure melanin is very rare in diseases and seldom displays typical signal characteristics. Large molecular mucoproteins mainly show high signals in mucin cysts, Rathke’s cysts, and gelatinous cysts. It is particularly noted that the posterior lobe of the pituitary gland, due to the secretion of antidiuretic hormone, has a shortening effect on T1 time, presenting high signals, thus listed as a special tissue commonly encountered.
Question 3: What is the clinical diagnostic significance of T2 high signals (long T2)?
T2 high signal substances mainly include water, fat, and hematomas. Water can be free water or ionic water, and combined water. Water, rich in hydrogen protons, thus has a very high T2 signal. Combined water, due to different binding methods with tissues, produces medium to high T2 signals. Fat has a very long T2 time, thus producing high signals, but the signals produced by SE sequences (spin echo sequences) tend to be moderate to high T2 signals, while FSE (fast spin echo sequences) significantly increase the T2 time of fat, presenting very high signals. T2 high signals in hematomas mainly include hyperacute and subacute late hematomas, where hyperacute hematomas contain oxyhemoglobin, with Fe²⁺ presenting slightly high signals in T2; subacute late hematomas contain extracellular oxyhemoglobin, where Fe³⁺ has a strong effect on shortening T2 time, but a large amount of water molecules are released, greatly extending T2 time, so that the two counteract each other, with the water molecule content far exceeding the iron molecules, thus presenting very high T2 signals.
Question 4: What is the diagnostic significance of T1 and T2 high signals (short T1 and long T2) and low signals (long T1 and short T2)?
T1 and T2 high signals are very rare and primarily consist of fat and subacute late hematomas.
T1 and T2 low signals are also very rare, mainly gases and calcium, as they contain no hydrogen protons to produce signals, thus presenting low signals. Note that in certain special cases, calcium molecules may present T1 high signals, increasing the difficulty of MR diagnostics.
Imaging Thought Process 055: How to qualitatively determine multiple occupying lesions in the vertebral canal of a young male? Pathology result: neurofibroma, hemangioma, lipoma.
The following images are derived from “Technical Guidelines for Magnetic Resonance Imaging” by Yang Zhenghan, Feng Feng, Wang Xiaoying.
Question 1: How are nuclear T1 and T2 signals collected by MR?
First, let’s explain two basic concepts, which we will review:
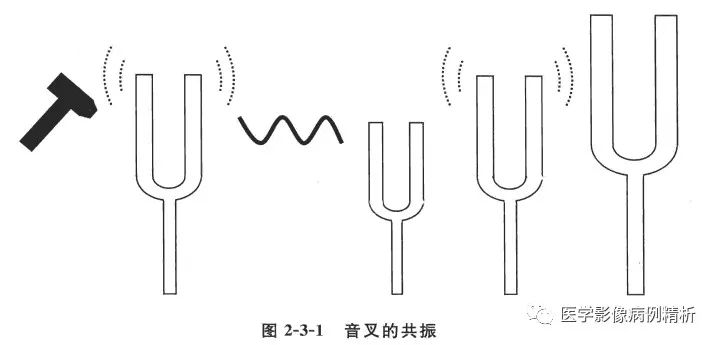
1. The resonance phenomenon, as shown in the diagram, is a method of energy transfer, the principle of emitting radiofrequency pulses.
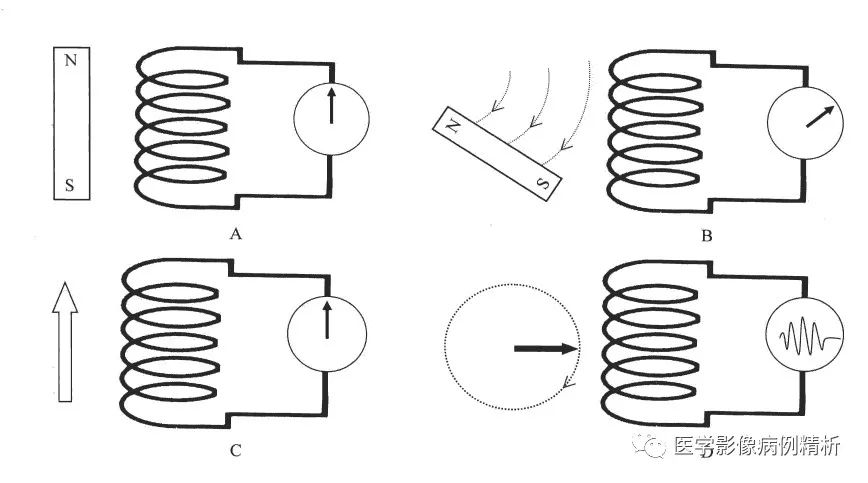
2. Electromagnetic induction, as shown in the diagram, requires explanation: A magnetic body parallel to the coil does not cut the magnetic field lines, thus generating no current. B When the magnetic body moves perpendicularly to the coil, it cuts the magnetic field lines, generating current. Similarly, C when the magnetic moment is parallel to the coil, it does not cut the magnetic field lines, generating no current. D When the magnetic moment is perpendicular to the coil, it cuts the magnetic field lines, generating current which is converted into signals. This is the principle for collecting MR signals.
3. The world is divided into XYZ three axes, with the strong magnetic field direction being the Z axis, parallel to the receiving coil. When the nuclear spins are placed in a strong magnetic field, the disordered magnetic moments are immediately aligned into a bundle along the Z axis, and the receiving coil cannot receive any signals. When an external radiofrequency pulse is applied, this pulse serves to induce resonance, transferring energy to a portion of the nuclear protons, causing the Z-axis magnetic moment to rotate to the X-axis direction, cutting the receiving coil perpendicularly and generating a weak current. The receiving coil captures this current and converts it into image signals. To maximize the image signal, a 90° radiofrequency pulse is used, as it is completely perpendicular to the coil. After a certain period, the radiofrequency pulse is turned off, and the X-axis magnetic moment begins to revert to the Z-axis direction under the influence of the external strong magnetic field. After a period, another 90° radiofrequency pulse is applied, generating another signal. Each measurement of different tissues generates different image signals. This angle can be adjusted freely, and different angles can be set according to needs to produce different signals. This is the fundamental method for collecting MR signals to generate images.
Question 2: Why is short T1 a high signal, and long T1 a low signal?
Some explanations can be found in the previous article of this section: Imaging Thought Process 054: Multiple vertebral body destruction due to tuberculosis or Brucellosis? Discharge diagnosis: Brucellosis.
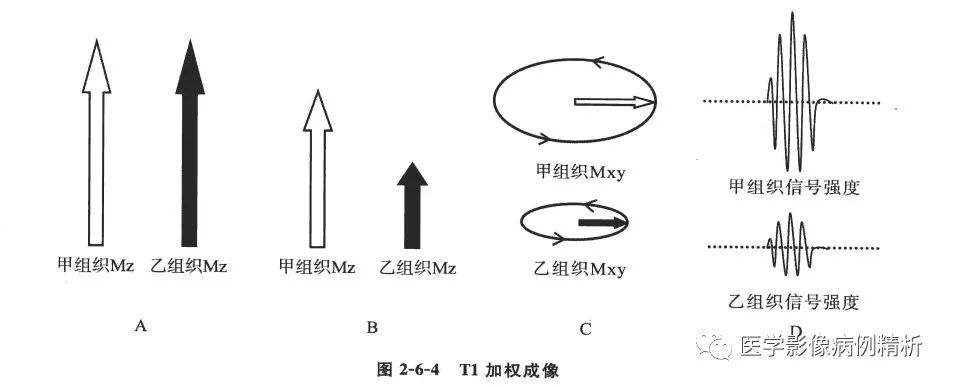
T1 is the longitudinal relaxation time, which refers to the time taken for T1 to increase from 0 to 67% of its maximum value. To simplify, let’s assign two special values to two tissues: assuming tissue A has a T1 of 60 seconds and tissue B has a T1 of 600 seconds, and we set the acquisition time to 40 seconds. After 40 seconds, when we read the signal intensity from the receiving coil, tissue A would be at 40/60, which is exactly 67%, resulting in the strongest signal, while tissue B would be at 40/600, which is 6.7%, resulting in a very weak signal. At this point, the acquired image shows that tissue A (with a short T1 value) has a signal that is significantly higher than that of tissue B (with a long T1 value). Some may ask, if we set the acquisition time to 600 seconds, would it then all be high signals? In fact, that’s not the case. Once the signal of a substance reaches 67% of its maximum T1 value, no further acquisition occurs. In reality, the T1 values of various tissues are fixed. To create richer image contrasts, optimal acquisition times are designed, so there will not be excessively short or long acquisitions. Of course, for diagnostic needs, acquisition times can be designed to be excessively long or short.
Question 3: Why does short T2 yield low signals, while long T2 yields high signals?
Some explanations can be found in the previous article of this section: Imaging Thought Process 054: Multiple vertebral body destruction due to tuberculosis or Brucellosis? Discharge diagnosis: Brucellosis.
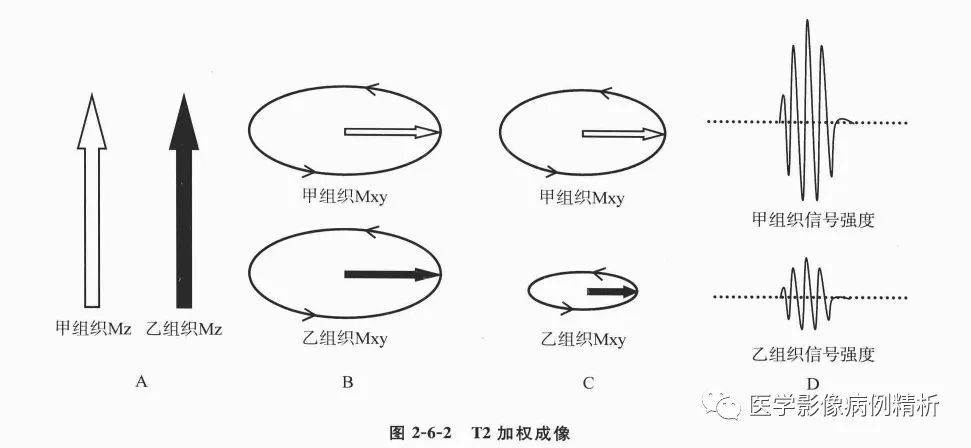
T2 is the transverse relaxation time, which refers to the time taken for T2 to decrease from its maximum value to 37%. To simplify, let’s assign two special values to two tissues: tissue A has a T2 time of 60 seconds, while tissue B has a T2 time of 600 seconds. Assuming the acquisition time is 50 seconds, for tissue B, the signal would be (60-50)/60, which is 16.7%, resulting in a very low signal, while for tissue A, (600-50)/600=91.7%, resulting in a very strong signal. In the acquired image at this time, the signal of tissue A (with a long T2 value) is significantly higher than that of tissue B (with a short T2 value).
Ultimately, the reason for the opposite signals between T1 and T2 is due to the different calculation methods. T1 is calculated based on the increase ratio, while T2 is calculated based on the remaining ratio after reduction. The ratio of produced and remaining signals determines the displayed signal. If the time is short, the increased ratio rises quickly, displaying a relatively large signal. However, T1 values are short (as shown in the T1-weighted imaging of tissue A); if the time is long, the decreased ratio is relatively small, resulting in a larger remaining ratio, thus displaying a relatively large signal, but T2 values are long (as shown in the T2-weighted imaging of tissue A). One looks at the increased ratio value, while the other looks at the remaining ratio value after reduction, which leads to this seemingly strange and difficult-to-understand answer. This can be quite confusing for clinical doctors and beginners. I suggest using high and low signals for clarity, as it is easily understood and conveys the intended meaning effectively.
Imaging Thought Process 054: Multiple vertebral body destruction due to tuberculosis or Brucellosis? Discharge diagnosis: Brucellosis.
Question 1: What is the main difference between MR and CT?
1. The imaging mechanisms are different. CT imaging is based on the penetration of X-rays through substances, with low-density materials being penetrated easily and appearing black, while high-density materials are poorly penetrated and appear white. MRI displays images based on the change of atomic magnetic moments in a magnetic field environment through resonance.
2. The meanings of the images differ. Both CT and MRI images are black and white, with black indicating low signal and white indicating high signal. CT values are represented in Housefield units, with gases having the lowest values (black) as X-rays penetrate completely, while metals have the highest values (white) as X-rays are completely absorbed. In MRI, the meaning of the images displayed varies with different weighted sequences. For example, T1WI and T2WI both show black as low signal and white as high signal, but they represent entirely different meanings. In T1WI, black indicates low signal representing long T1 time, while white indicates high signal representing short T1 time; in T2WI, black indicates low signal representing short T2 time, while white indicates high signal representing long T2 time. This will be further explained in Question 3 regarding T1 and T2.
3. Acquisition time differs; CT is very fast, taking about 3 minutes to complete a routine scan of one area. MRI is much slower; even the most basic head scan takes about 5-10 minutes.
4. Cost and expenses differ; CT is very common and inexpensive, while MRI is costly, with high maintenance costs and difficulties in promotion at the grassroots level.
Question 2: Why is MR difficult to learn? What are its advantages and disadvantages?
The difficulty in learning MRI can be compared to mathematics in relation to CT. CT is like a single series from 1 to 100, which can be explained clearly. MRI resembles permutations and combinations, first arranging 1 to 100 in rows, then arranging each row from 1 to 100 in columns, making it very complex. For example, in CT, high density represents metals or calcified iron components, with CT values around 100-1000 Hu, while fat has CT values around -40 to -120 Hu, which is quite simple and clear. In MRI, there are multiple sequence images, each with high and low signals representing different meanings. For instance, T1WI high signals can be fat, hematomas, melanin, or manganese; T2WI high signals can be water, hematomas, or fat; and DWI high signals can indicate cytotoxic edema, large molecular mucoproteins, or dense small round cells. Only by combining more sequence images can one analyze the meanings of high and low signals, as a single image has no significance. This complexity is why magnetic resonance can analyze more diseases like a detective.
Advantages: high soft tissue resolution and excellent diagnostic value for the nervous system. Imaging technology has improved and applications are increasingly broad. Special imaging techniques like MRS, fMRI, and DTI are more meaningful for differentiating and diagnosing specific diseases.
Disadvantages: high costs, slow speeds, inability to perform scans on patients with metal implants, high maintenance costs, and increased learning costs.
Question 3: What do T1 and T2 represent?
This question could be elaborated upon extensively. My personal understanding is as follows.
T1 = T1 value = T1 time = T1 recovery time = T1 relaxation time = spin-lattice relaxation time.
T2 = T2 value = T2 time = T2 recovery time = T2 relaxation time = spin-spin relaxation time.
Firstly, let’s answer this question using a reverse Q&A method.
The key point is that T1 and T2 are both times, so we refer to short and long T1 and T2. What do these times represent? They represent the recovery times of hydrogen atomic nuclei in body tissues under a magnetic field. Why is it referred to as recovery or relaxation time? Because the originally disordered magnetic moments of hydrogen atomic nuclei become aligned in the direction of the magnetic field; when a 90° radiofrequency pulse alters the direction of the magnetic moments, the atomic nuclei must recover to their original disordered state, hence the term recovery or relaxation time. What do T1 and T2 times represent? If we divide the world into three axes, XYZ, the Z axis represents the external magnetic field direction, T1 represents the longitudinal relaxation of all vectors, and T2 represents the transverse relaxation of all vectors. When nuclear spins are placed in a magnetic field, the energy of the magnetic field is strong, while the energy of the nuclear spins is weak, thus they are aligned into a bundle along the Z axis. The maximum value of T1 longitudinal relaxation is reached, while T2 transverse relaxation is at 0. When a 90° radiofrequency pulse is applied, the magnetic moments rotate 90° to become a transverse bundle, with T1 longitudinal relaxation at 0 and T2 transverse relaxation at maximum. Under the influence of the external magnetic field, they begin to recover; when T1 increases to 67% of its maximum value, this is the T1 value of the tissue; when T2 decreases to 37% of its maximum value, this is the T2 value of the tissue. The maximum values are fixed (the same field strength is fixed, but different field strengths yield different results; at high field strengths, T1 values increase, while T2 values remain largely unchanged), thus T1 and T2 times are also fixed. All tissues have T1 values that are much longer than T2 values, with T1 ranging from hundreds to thousands of milliseconds, and T2 ranging from tens to hundreds of milliseconds.
Imaging Thought Process 053: Is the vertebral body disc destruction due to inflammation or tumor? Pathology result: thoracic tuberculosis.
The following images are derived from “Technical Guidelines for Magnetic Resonance Imaging” by Yang Zhenghan, Feng Feng, Wang Xiaoying.
Question 1: What does weighted mean in T1WI, commonly referred to as T1-weighted imaging?
T1WI means T1 weighted image, where weighted means “to give weight to something; to make something heavier or to fix it with a heavy object; to weight something”. It can be understood as being more important. For example, in a restaurant, there are many tables of customers, with T1, T2, and PD sitting at three tables. If one server is called to take orders, it is likely that the server will not hear anything clearly. To solve this, the customers will take turns telling the server their orders. When the table of T1 customers places their order, for the server, that is the most important order, which is the only one that needs to be conveyed to the kitchen (and thus is displayed in the image). The other customers at tables T2 and PD are still there but are silent, so the server does not hear them. T1WI plays this role; during a certain period, it focuses on collecting T1 time, thus displaying the T1 time signal of a specific anatomical layer, while other times like T2 and PD still exist but are technically ignored. Thus, an MRI image comprises multiple signals, focusing on collecting and displaying a specific signal while technically ignoring others.
Question 2: What are the differences between T1WI and T2WI?
This question could lead to a lengthy discussion. The two questions can be elaborated upon extensively.
T1WI, or T1 weighted image, primarily reflects the differences in T1 times of all substances at a specific anatomical layer. As mentioned in Question 1, other times such as T2 and PD also exist but are minimal and unimportant. T1WI can also be understood as a T1 time contrast image, and the same reasoning applies to T2WI. This fundamentally differs from the high and low density in CT. T1WI has a high signal-to-noise ratio and excellent anatomical structure contrast, mainly used to observe anatomical structures, while enhancement is primarily achieved using T1WI. T2WI is more useful for observing lesions, as they are often rich in water or blood supply, making lesions more apparent.
Question 3: How to distinguish between T1WI and T2WI? This question is too broad, so let’s limit it to vertebral images.
In simple terms, to distinguish between T1WI and T2WI:
1. Observe the technical parameters. T1WI and T2WI are mainly determined by TR (repetition time) and TE (echo time). TR determines T1, while TE determines T2. Therefore, short TR and short TE indicate T1WI, while long TR and long TE indicate T2WI; long TR and short TE indicate PD (proton density weighted). Understanding this is sufficient; when comparing T1WI and T2WI images, pay attention to the TR and TE. If TR is in the hundreds of milliseconds and TE is in the twenties or thirties of milliseconds, it is mostly T1WI; conversely, if TR is in the thousands of milliseconds and TE is around a hundred milliseconds, it is definitely T2WI.
2. Observe the signal of cerebrospinal fluid. Regardless of the MRI image, within the same image, black indicates low signal and white indicates high signal. However, different weighted images display the same signal with entirely different meanings, which must be noted. In vertebral images, pay attention to the subarachnoid space of the vertebral canal; in T1WI, cerebrospinal fluid is represented as ionic water, appearing as low signal (black); in T2WI, cerebrospinal fluid represents high signal (white).
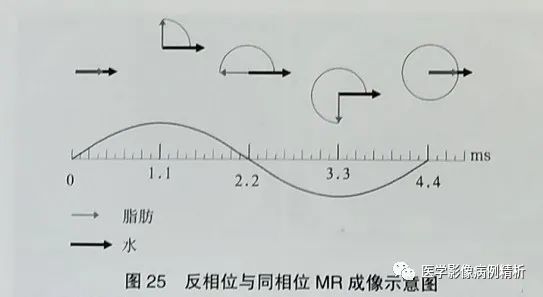
3. What is the diagnostic significance of fat suppression in fat-suppressed images? Due to the large amount of fat tissue filling the abdominal cavity and subcutaneous soft tissues, both T1WI and T2WI present slightly high or high signals, as some diseases also exhibit high signals, which can be obscured within the fat signals. Therefore, fat suppression is applied to reduce fat signals and clearly display the high signals of lesions. This primarily includes FS (fat saturation method), STIR (short time inversion recovery), selective water excitation imaging, and out-of-phase imaging techniques. The first three methods reduce large fat signals, while out-of-phase is particularly unique in that it suppresses small fat signals, which is very significant. Note that fat suppression techniques can be combined; for instance, applying STIR fat suppression and FS fat suppression to T1WI is possible, but it takes time.