Wheat is one of the most important staple foods in China, and the sowing area and yield of wheat are directly related to national food security and social stability. At the same time, the sowing area of wheat is an important link in monitoring wheat growth and estimating yield. With the development of remote sensing technology, it provides an effective means for the rapid and accurate extraction of the spatial distribution of wheat sowing.
This article utilizes the ENVI deep learning image classification tool to extract the sowing area of winter wheat in Henan Province from Sentinel-2 satellite images with a resolution of 10 meters for the years 2018-2019 and 2019-2020.
The extraction results are as follows:
|
Year |
Remote Sensing Extracted Area |
Publicly Announced Area |
Difference |
|
2018-2019 |
5926.49 thousand hectares |
5718.7 thousand hectares |
+3.6% |
|
2019-2020 |
5882.12 thousand hectares |
Not Announced |
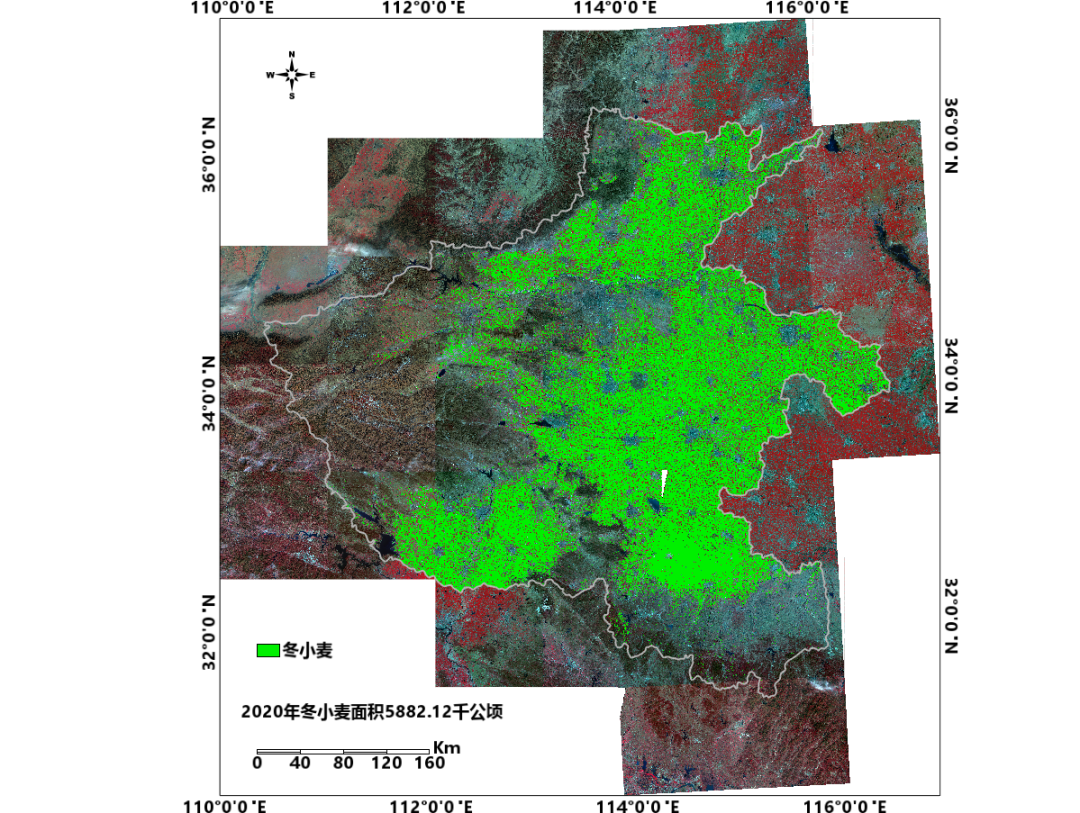
Figure: Spatial distribution of winter wheat planting in 2019-2020
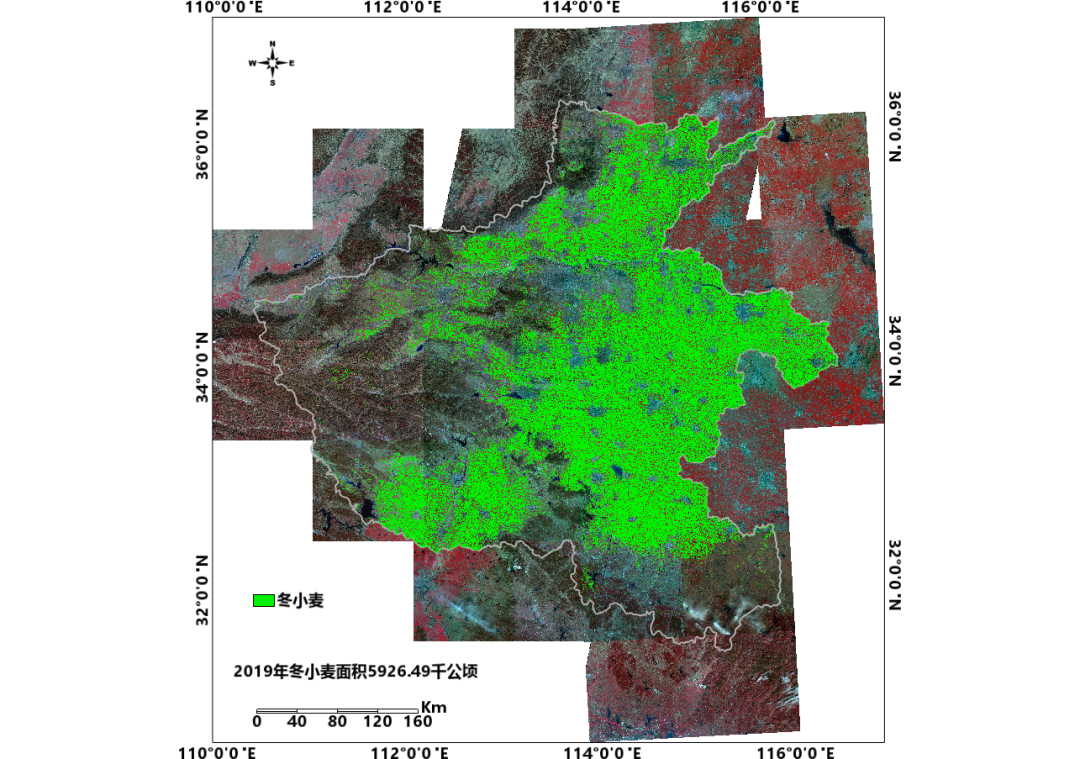
Figure: Spatial distribution of winter wheat planting in 2018-2019
Below are several partial extraction effect images:
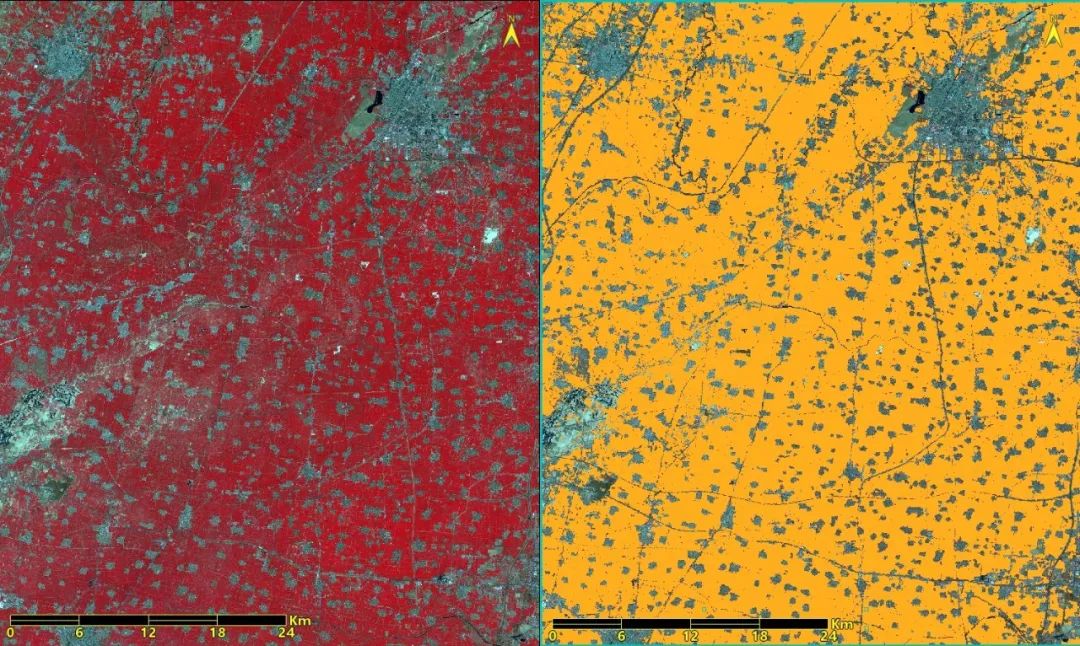
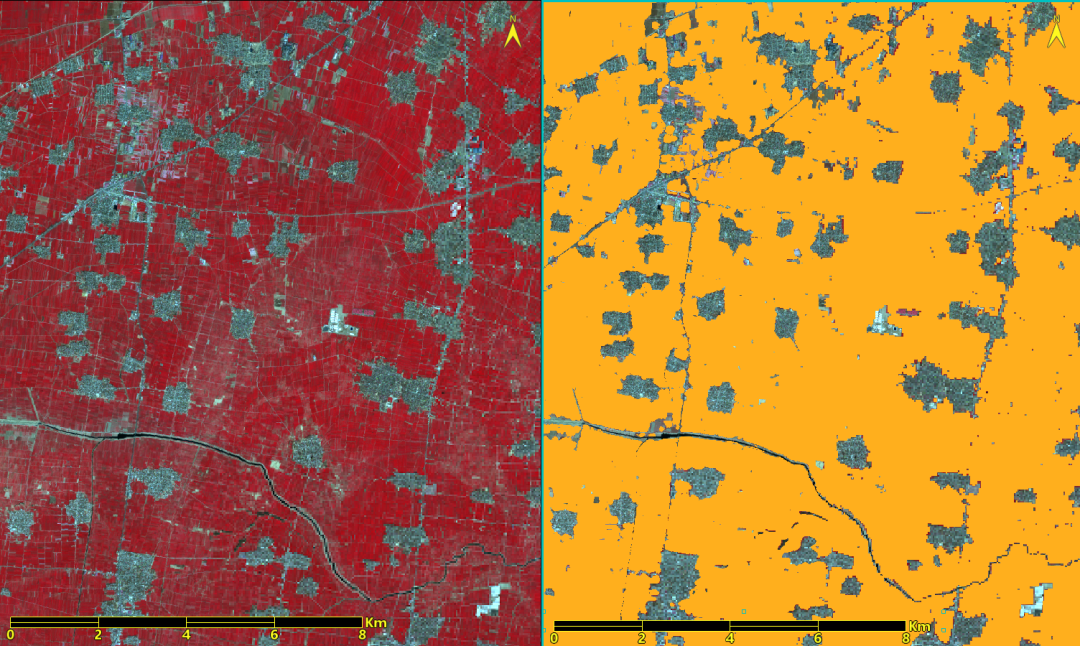
Figure: Plain area
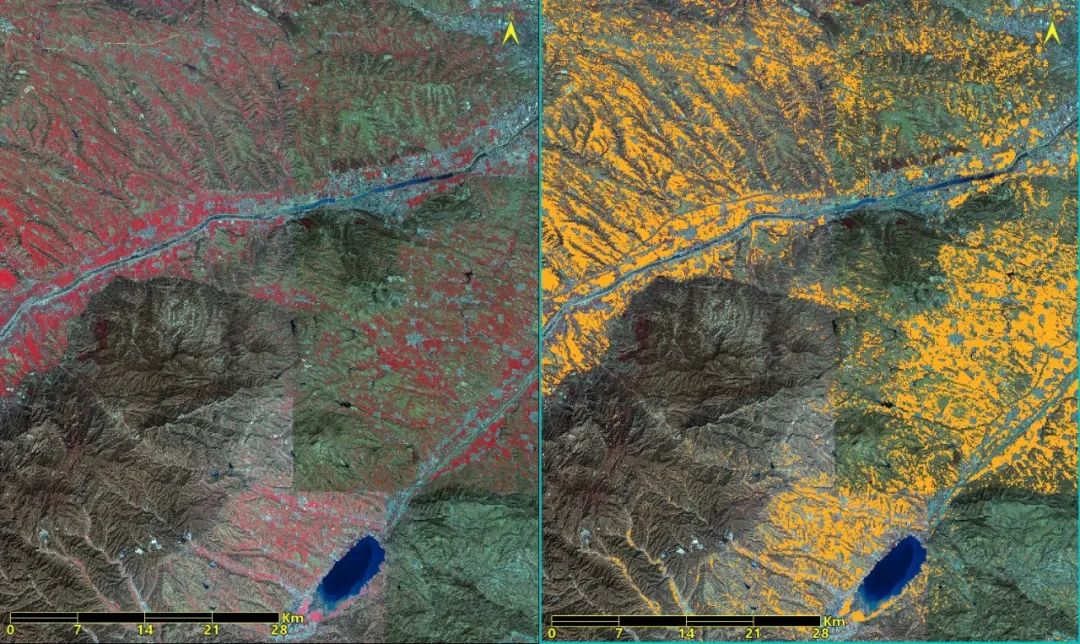
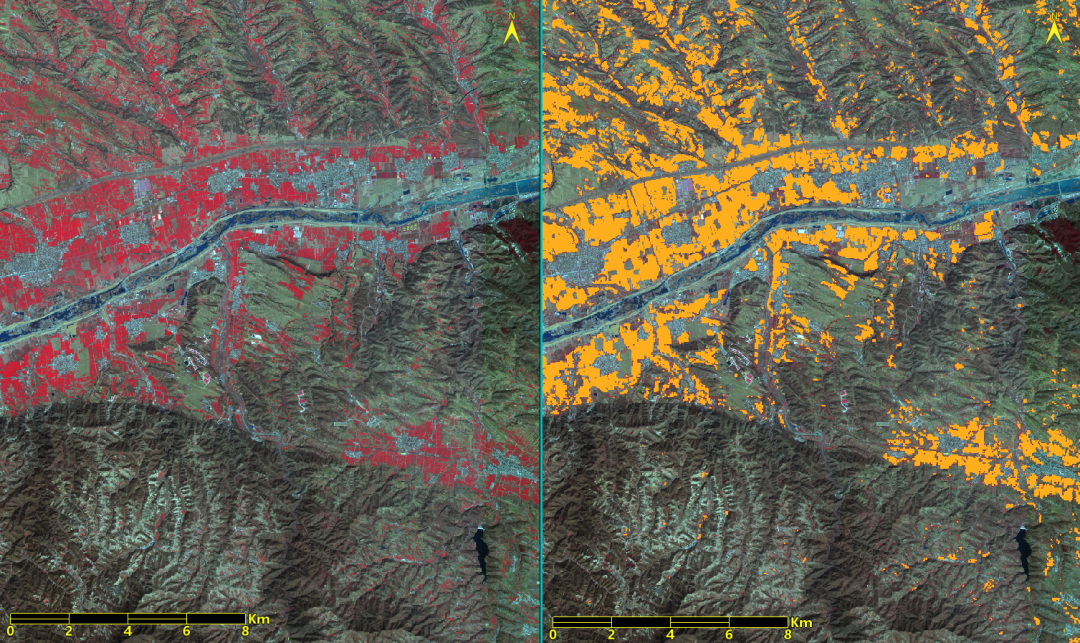
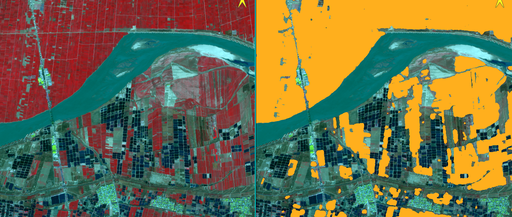
Figure: Mountain area
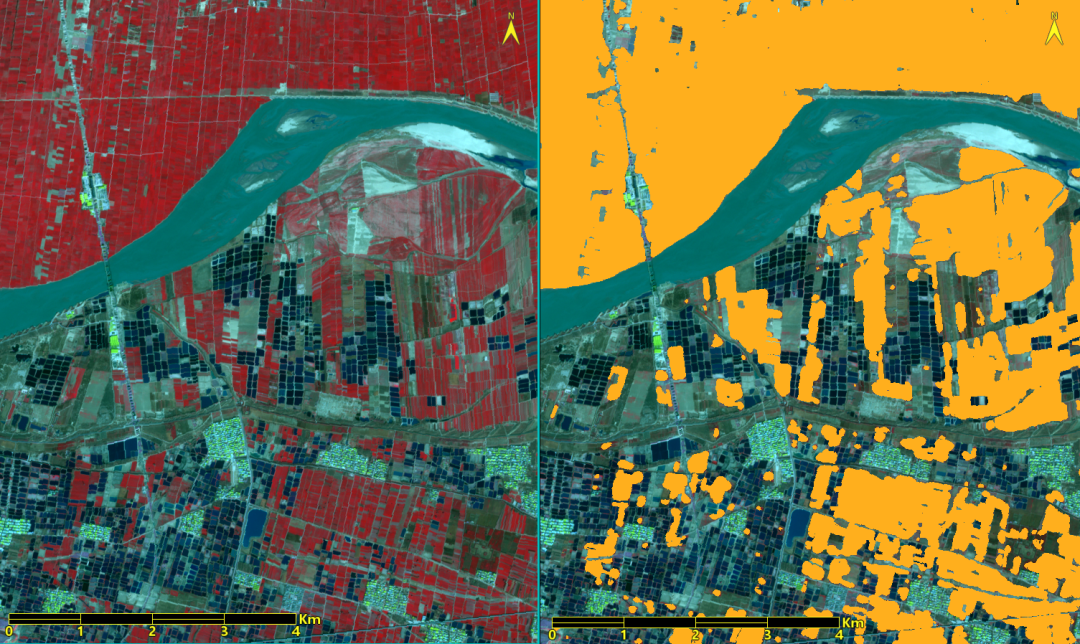
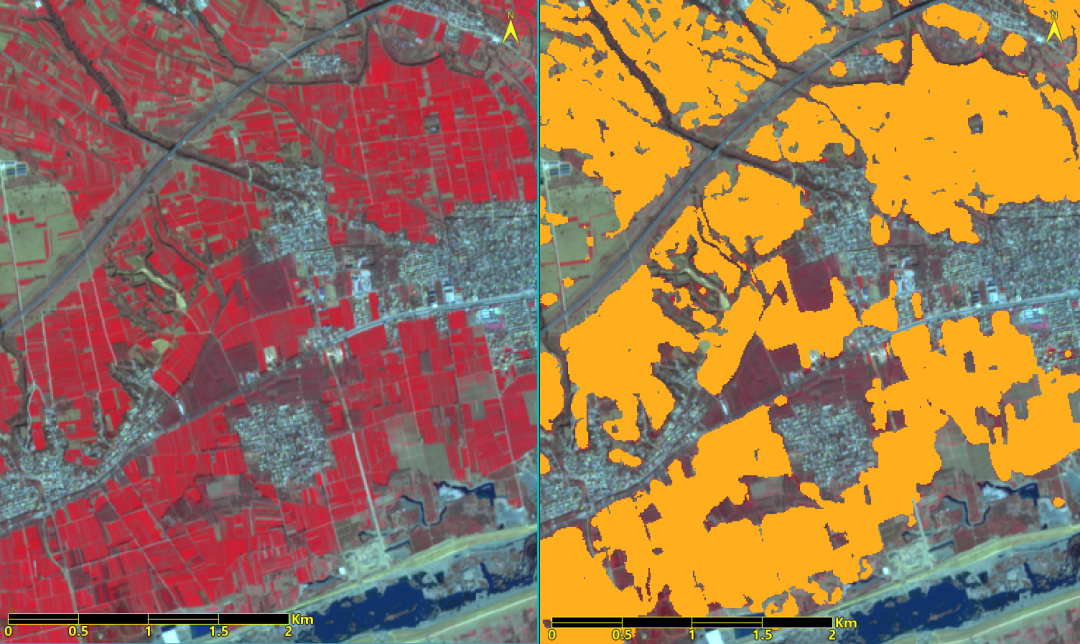
Figure: Complex cultivated land type area
Due to the lack of validation data, the training samples were used to validate the deep learning training model, and the results are as follows:
-
User Accuracy: 0.94
-
Producer Accuracy: 0.91
-
F1: 0.924
All operations were completed in ENVI 5.5.3 + ENVI Deep Learning 1.1, and the computer environment was: DELL 7520 laptop (CPU: i7-7700HQ, GPU: NVIDIA Quadro M2200, 4GB, Memory: 64GB). The time for each step is shown in the table below:
|
Step |
Time |
Description |
|
Sample Selection |
10 hours |
The object-oriented classification method was used to obtain samples; the time for method research is not included. |
|
Training Model |
10 hours |
The model was trained using 2019 image samples, and the model was directly applied to 2020. |
|
Image Classification |
2019: 7 hours 40 minutes 2020: 7 hours |
2019 43 scenes of images (overlapping coverage area is large), 2020 39 scenes of images |
|
Post Classification Processing |
Within 30 minutes |
Mosaicking, cropping, and small patch removal. |
The total time for computer processing was about 35 hours.
The image data is Sentinel-2 data released by the European Space Agency, captured in March, with a cloud cover of less than 1%.
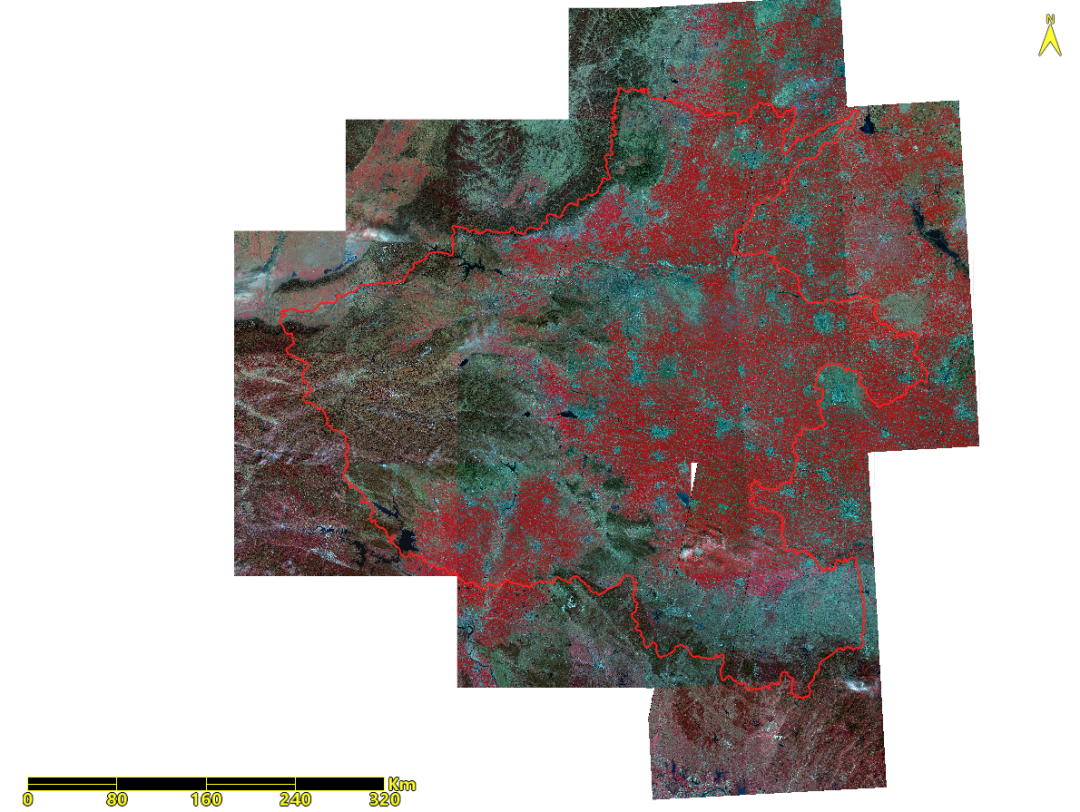
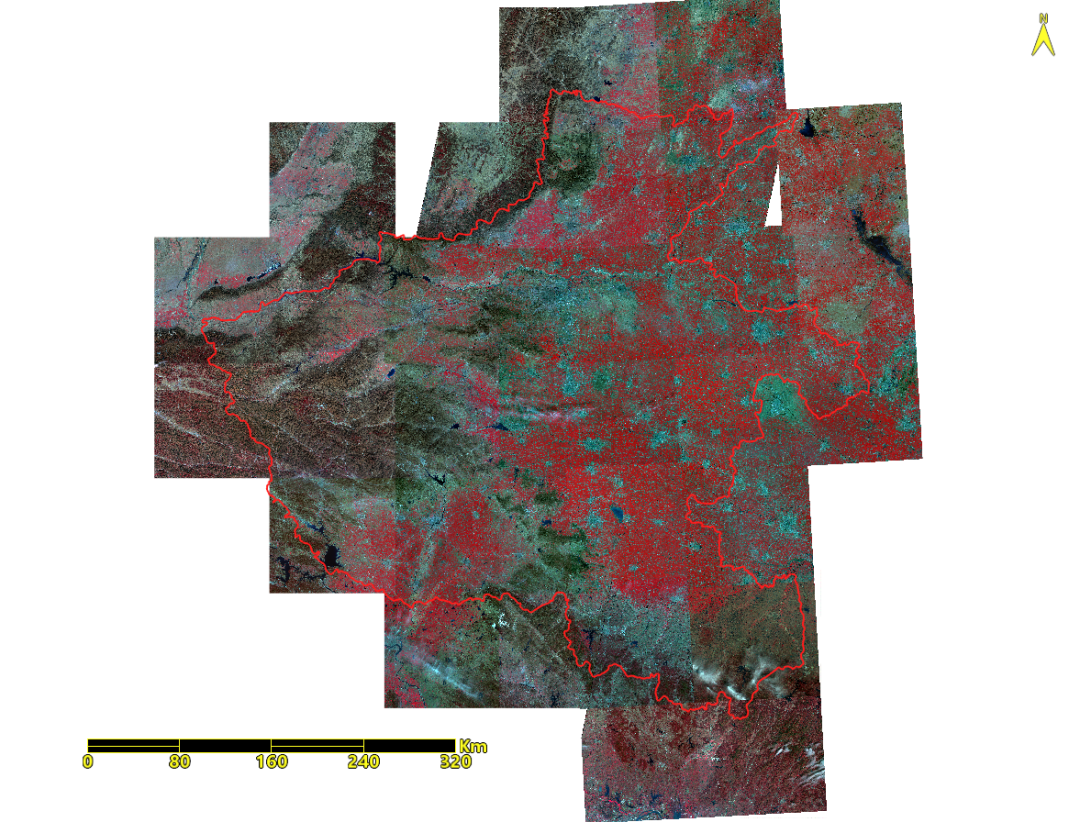
Figure: Left side 2020 (39 scenes), right side 2019 (43 scenes)
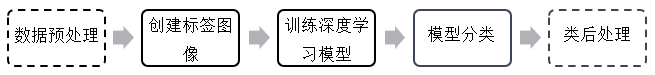
The technical process is as follows:
This winter wheat area extraction did not preprocess the Sentinel data; normalizing the data may help improve extraction accuracy.
This extraction of the winter wheat area in Henan Province used Sentinel-2 satellite images, selecting Blue, Green, Red, and NIR 10-meter resolution 4 bands for winter wheat extraction.
3.1 Create Label Image
The first step in deep learning is to create a label image. ENVI provides various methods to obtain samples to generate the required label image.
The first step in deep learning is to create a label image. ENVI provides various methods to obtain samples to generate the required label image.
(1) Sample Area Selection
Considering that Henan Province is vast and has significant regional differences, the selection of areas for sample acquisition needs to be comprehensively considered so that the model can adapt to the image characteristics of different regions in Henan Province. Therefore, single-scene Sentinel-2 data from the central, northern, southern, eastern, and western regions of Henan Province were selected as sample areas to obtain samples.
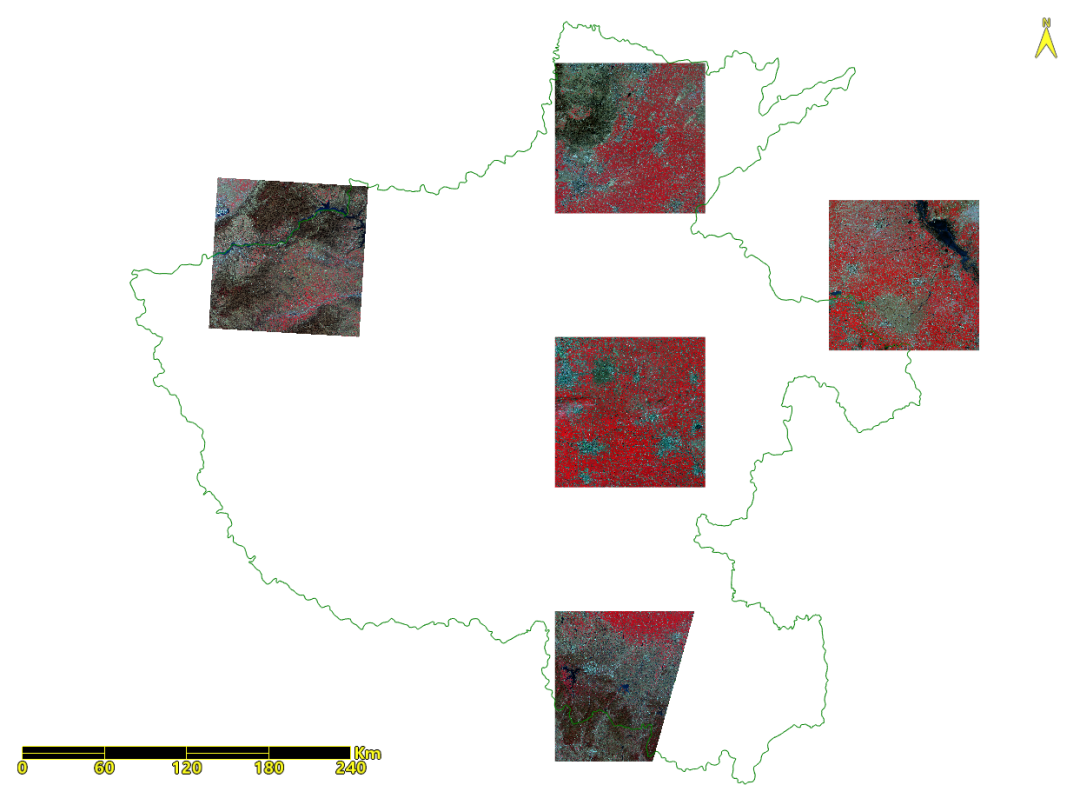
Figure: Sample selection image distribution
(2) Sample Drawing
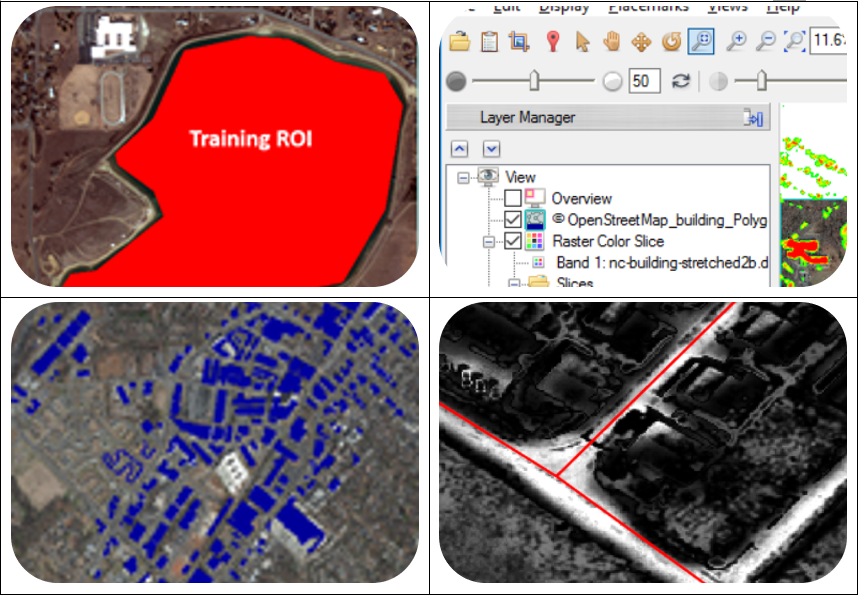
Considering the large sample selection area, the manual visual interpretation workload is considerable. Here, the ENVI object-oriented classification results are used as sample data.
In the ENVI toolbox, select Feature Extraction/Rule Based Feature Extraction Workflow, use the ENVI FX tool to perform object-oriented segmentation on 5 scenes of images, and establish different extraction rules based on the characteristics of each image to extract winter wheat planting areas.
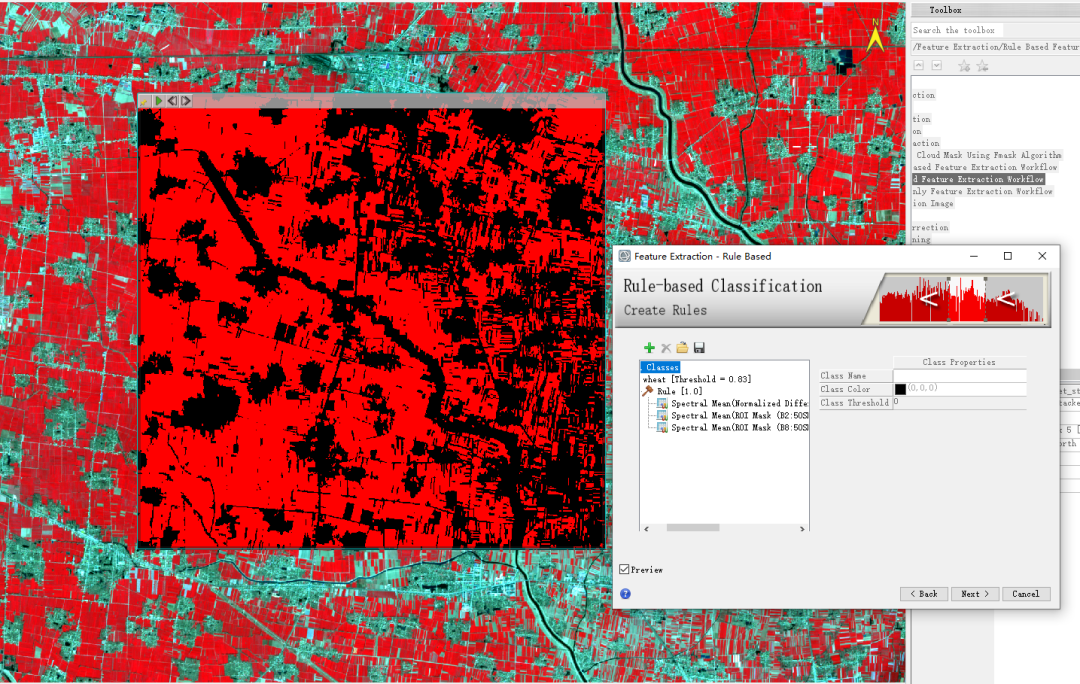
Figure: Establishing classification rules
Each scene’s rules need to be analyzed separately to obtain spectral data. The analysis method is as follows:
-
In the ROI sample drawing tool, draw different types of samples: winter wheat with different growth conditions, blue-roofed houses, forest vegetation, and other sample types.
-
After drawing the samples, right-click to select Statistics to perform spectral statistical analysis on different samples, obtaining extraction thresholds based on the spectral range differences of different samples, and then establish rules in FX to extract winter wheat.
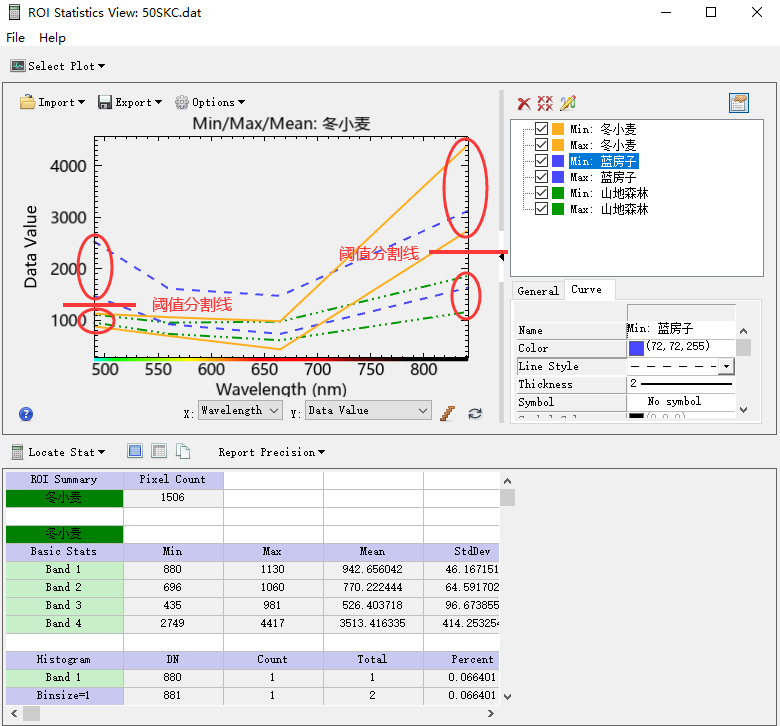
Figure: Obtaining classification rules
Finally, according to different rules, the winter wheat planting area for 5 scenes of images is extracted.
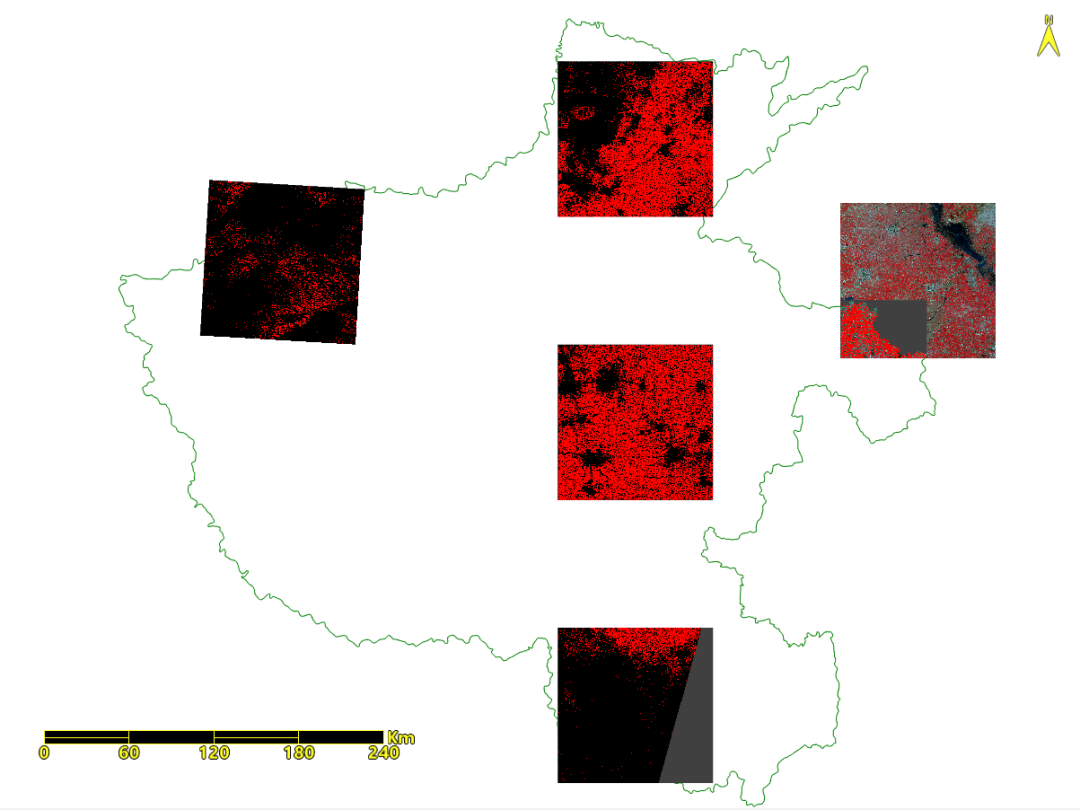
Figure: Sample extraction results
(3) Generate Label Image
Using the object-oriented classification method, the winter wheat planting areas for 5 scenes of images are obtained as samples, and the Deep Learning/Build Label Raster from Classification tool is used to generate label rasters for deep learning model training.
3.2 Train Deep Learning Model
With the label raster, you can select Deep Learning/Train TensorFlow Model in the ENVI toolbox to train the deep learning model.
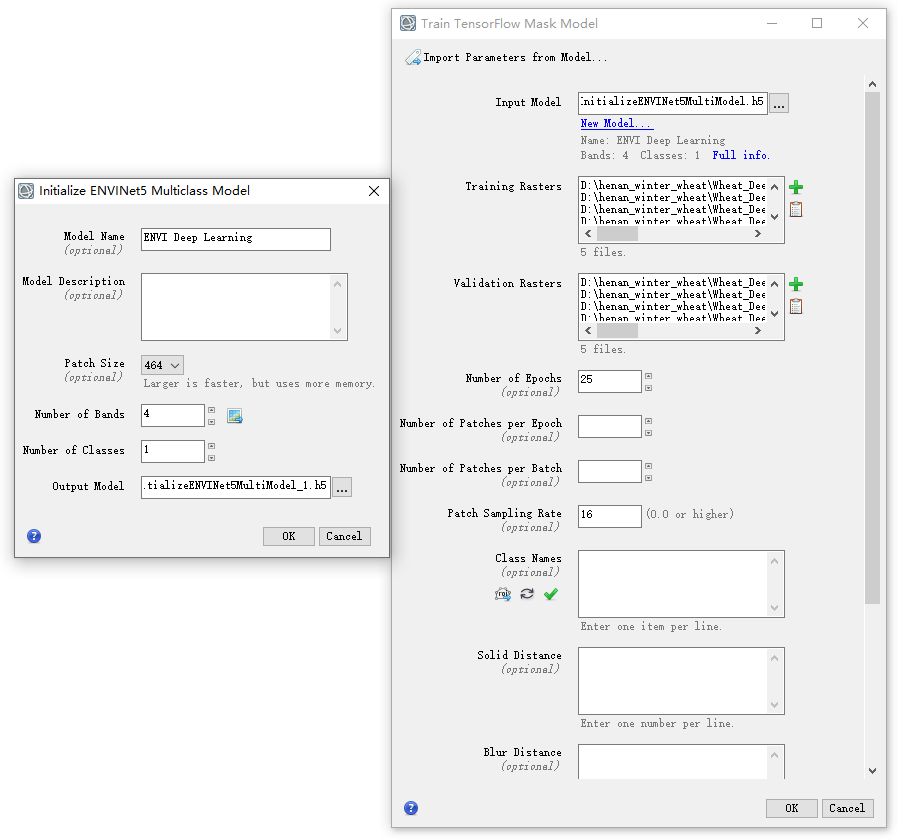
Figure: Model training
-
In the Train TensorFlow Mask Model panel, click New Model under Input Model to initialize a deep learning multi-class extraction model, set Number of Bands to 4 bands, Number of Classes to 1 class, and keep other parameters at default, then click OK.
-
In the Training Raster option, select the created 5 scene Label Raster, and also select the same 5 scene Label Raster in the Validation Raster, keeping other parameters at default.
-
Set the output paths and filenames for Output Best Model and Output Last Model, and click OK to start training the deep learning model.
3.3 Model Classification
Using the trained model, winter wheat extraction is performed on Sentinel-2 images with a resolution of 10 meters for 43 scenes in 2019 and 39 scenes in 2020. The ENVI Modeler is used to establish a batch classification tool.
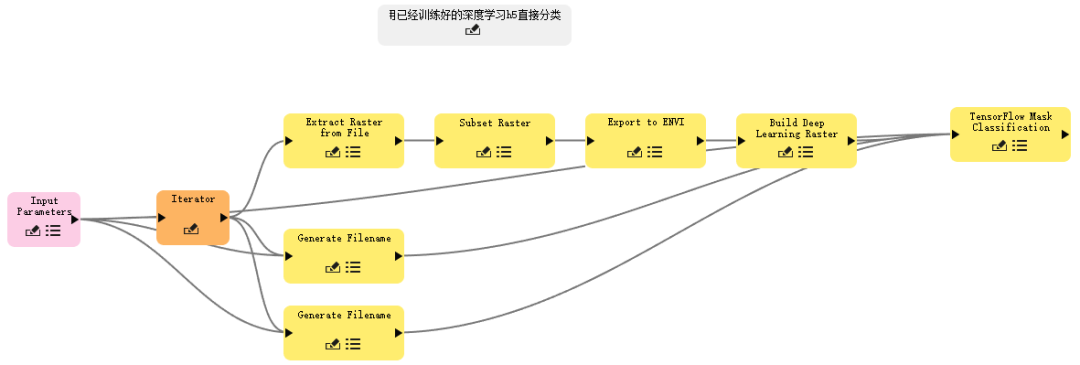
Figure: ENVI Modeler deep learning batch processing
Run the batch processing function, input the Sentinel data to be extracted in the parameter input panel, select the H5 model (Best Trained Model) trained in the previous step, set the output path, classification file name, and class activation file name, then click OK to perform deep learning model classification.
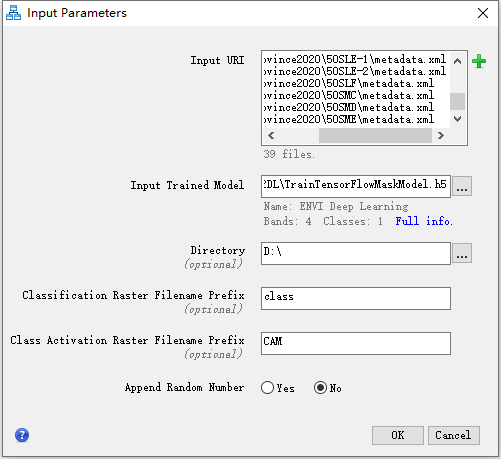
Figure: Deep learning batch processing tool
3.4 Post Classification Processing
Post classification processing mainly includes result mosaicking, cropping, small patch processing, and post-classification editing.
(1) Result Mosaicking
Use Mosaicking/Quick Mosaic tool, in the pop-up parameter dialog, select the winter wheat classification file for Input Raster, set Data Ignore Value to 0, set output path and filename, and click OK to perform mosaicking processing.
(2) Result Cropping
Use Region of Interest/Subset Data from ROIs tool to crop the mosaicked winter wheat classification file using the vector of Henan Province’s administrative boundary.
(3) Small Patch Processing
Use Post Classification/Majority/Minority Analysis tool, select the cropped classification file in the Classification Input File dialog, click OK, and in the Majority/Minority Parameters dialog, select the class name for small patch processing, set Kernel Size to 9, and keep other settings at default, then set output path and filename, click OK to perform small patch processing.
For mixed pixels adjacent to cultivated land and other land types, dilation and erosion operations can further filter or retain them. This winter wheat extraction result filtered out mixed pixels adjacent to cultivated land and other types. Use Filter/Convolutions and Morphology tool, in the pop-up dialog, click Morphology to select Erode for erosion processing, set Kernel Size to 3×3, and keep other settings at default, then click Apply To File. In the Morphology Input File dialog, select the result from the previous step, click OK, and in the pop-up dialog, select output path and filename, click OK to process.
(4) Post-classification Editing
Overlay the winter wheat extraction results onto the image map, using the ENVI classification editing tool to edit misclassified or missed pixels. This article did not edit the results.