
Author: Siddharth M
Translator: Wang Kehan
Proofreader: Ouyang Jin


This article is approximately 1300 words long and is recommended for a 6-minute read.
This article teaches you how to use LSTM networks to predict stock price trends and visualize opening and closing prices.
1. Introduction
Dataset:
2. Implementing Time Series Prediction for Stocks Using LSTM
gstock_data = pd.read_csv('data.csv')
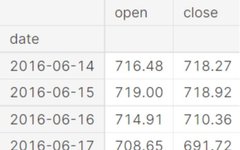
gstock_data.head()
Dataset Exploration:
gstock_data = gstock_data[['date','open','close']]
gstock_data['date'] = pd.to_datetime(gstock_data['date'].apply(lambda x: x.split()[0]))
gstock_data.set_index('date', drop=True, inplace=True)
gstock_data.head()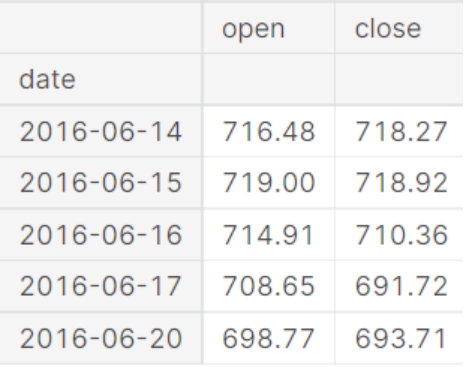
fg, ax = plt.subplots(1, 2, figsize=(20, 7))
ax[0].plot(gstock_data['open'], label='Open', color='green')
ax[0].set_xlabel('Date', size=15)
ax[0].set_ylabel('Price', size=15)
ax[0].legend()
ax[1].plot(gstock_data['close'], label='Close', color='red')
ax[1].set_xlabel('Date', size=15)
ax[1].set_ylabel('Price', size=15)
ax[1].legend()
fg.show()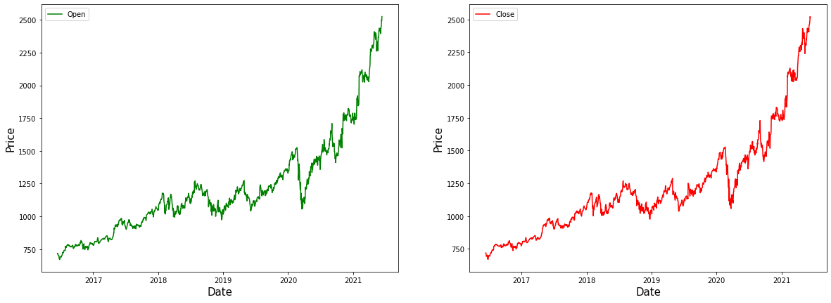
Data Preprocessing:
from sklearn.preprocessing import MinMaxScaler
Ms = MinMaxScaler()
gstock_data[gstock_data.columns] = Ms.fit_transform(gstock_data)
training_size = round(len(gstock_data) * 0.80)
train_data = gstock_data[:training_size]
test_data = gstock_data[training_size:]
Splitting Training Data:
def create_sequence(dataset):
    sequences = []
    labels = []
    start_idx = 0
    for stop_idx in range(50, len(dataset)):
        sequences.append(dataset.iloc[start_idx:stop_idx])
        labels.append(dataset.iloc[stop_idx])
        start_idx += 1
    return (np.array(sequences), np.array(labels))
train_seq, train_label = create_sequence(train_data)
test_seq, test_label = create_sequence(test_data)
Implementing the LSTM Model:
from keras.models import Sequential
from keras.layers import Dense, Dropout, LSTM, Bidirectionalmodel = Sequential()
model.add(LSTM(units=50, return_sequences=True, input_shape=(train_seq.shape[1], train_seq.shape[2])))
model.add(Dropout(0.1))
model.add(LSTM(units=50))
model.add(Dense(2))
model.compile(loss='mean_squared_error', optimizer='adam', metrics=['mean_absolute_error'])
model.summary()
model.fit(train_seq, train_label, epochs=80, validation_data=(test_seq, test_label), verbose=1)
test_predicted = model.predict(test_seq)
test_inverse_predicted = Ms.inverse_transform(test_predicted)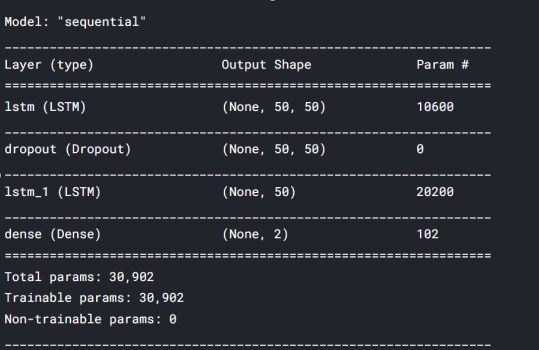
Visualization:
# Merging actual and predicted data for better visualization
gs_slic_data = pd.concat([gstock_data.iloc[-202:].copy(), pd.DataFrame(test_inverse_predicted, columns=['open_predicted', 'close_predicted'], index=gstock_data.iloc[-202:].index)], axis=1)
gs_slic_data[['open', 'close']] = Ms.inverse_transform(gs_slic_data[['open', 'close']])
gs_slic_data.head()
gs_slic_data[['open', 'open_predicted']].plot(figsize=(10, 6))
plt.xticks(rotation=45)
plt.xlabel('Date', size=15)
plt.ylabel('Stock Price', size=15)
plt.title('Actual vs Predicted for open price', size=15)
plt.show()
gs_slic_data[['close', 'close_predicted']].plot(figsize=(10, 6))
plt.xticks(rotation=45)
plt.xlabel('Date', size=15)
plt.ylabel('Stock Price', size=15)
plt.title('Actual vs Predicted for close price', size=15)
plt.show()
3. Conclusion
References:
https://the-learning-machine.com/article/dl/long-short-term-memory
https://www.kaggle.com/amarsharma768/stock-price-prediction-using-lstm/notebook
Editor: Huang Jiyan
Translator’s Profile

Wang Kehan, a direct PhD student in the Department of Mechanical Engineering at Tsinghua University. Previously had a background in physics, developed a strong interest in data science during graduate studies, and is curious about machine learning and AI. Looking forward to seeing the sparks of collision between artificial intelligence and mechanical engineering, computational physics in the research path. Hope to make friends and share more stories about data science, viewing the world through the lens of data science.
Recruitment Information for Translation Team
Job Description: Requires a meticulous heart to translate selected foreign articles into fluent Chinese. If you are a data science/statistics/computer student studying abroad, or working in related fields overseas, or are confident in your language skills, you are welcome to join the translation team.
What You Will Gain: Regular translation training to improve volunteers’ translation skills, enhance awareness of cutting-edge data science, and connect overseas friends with domestic technical application development. The THU Data Team’s background provides good development opportunities for volunteers.
Other Benefits: You will become partners with data scientists from well-known companies, students from prestigious universities like Peking University and Tsinghua University, as well as overseas students.
Click the “Read the original” link at the end of the article to join the Data Team~
Reprint Notice
If you need to reprint, please indicate the author and source prominently at the beginning (Reprinted from: Data Team ID: DatapiTHU), and place a prominent QR code for Data Team at the end of the article. For articles with original identification, please send [Article Name – Public Account Name and ID to be authorized] to the contact email to apply for whitelist authorization and edit as required.
After publishing, please provide the link feedback to the contact email (see below). Unauthorized reprints and adaptations will be pursued legally.
Click “Read the original” to view the original article