Article Number | 1009-265X(2020)06-0055-07
Source | “Modern Textile Technology” 2020 Issue 6
Authors | Wang Jingjing a, Chen Minzhi b
(Zhejiang University of Science and Technology, a. School of Clothing; b. International Education College, Hangzhou)
Author Introduction | Wang Jingjing (1993-), female, from Nanyang, Henan, master’s student, mainly engaged in research in clothing technology and theory.
Abstract To improve the accuracy of classification of the chest shapes of young women, thereby providing a basis for the structural design of personalized women’s clothing to meet the requirements of personalized clothing development, a chest shape recognition model based on Long Short-Term Memory (LSTM) neural network was constructed. Three-dimensional measurement technology was used to obtain body data from 230 young women, and cluster analysis extracted 5 typical indicators reflecting chest morphology, categorizing the chest shapes into 3 classes based on these indicators. On this basis, a chest shape recognition model based on LSTM combined fully connected layers was constructed, using the 5 typical indicators as feature parameters for input. The mini-batch Adam optimization algorithm was employed to train the model, avoiding local optima, and dropout was used to reduce overfitting, with the output results classified using a Softmax regression classifier. The results show that this model can effectively recognize and classify chest shapes, achieving an accuracy rate of 94.6%. Compared to traditional BP networks and PNN networks, this model exhibits better fitting effects and prediction accuracy.
Keywords chest shape; three-dimensional measurement; cluster analysis; long short-term memory neural network; recognition model
To meet the consumption needs in clothing and the development of the clothing market, personalized clothing customization will become the trend of future clothing industry development [1]. The current clothing size specifications set four body types: Y, A, B, and C. The classification of body types, especially for women’s local body types, is not detailed enough. Therefore, in the clothing pattern-making process, the distribution of the chest relaxation and dart is often based on the experience of the pattern maker, leading to unsatisfactory results in women’s structural design. In the process of personalized women’s structural design, how to reasonably distinguish the differences in chest morphology and improve the accuracy of chest shape recognition is of significant practical importance and market application prospects for the clothing industry [2].
Currently, many scholars have studied the classification of local body shapes, with commonly used methods including mathematical statistics, such as cluster analysis [3-4] and regression analysis [5]. However, with the development of artificial intelligence technology, techniques like neural networks and random forests have become the primary research methods for body shape recognition due to their advanced data mining and learning capabilities. Zhang Suyun et al. [6] introduced the support vector machine method for body shape classification, Jin Juanfeng et al. [7-8] constructed a probabilistic neural network recognition model for classifying women’s hips, and Yin Ling et al. [9] established a female body shape classification discrimination model based on random forest theory algorithms. Due to the strong ambiguity in the standards and boundaries of human body shape classification, it is necessary to continually seek better classification methods to improve classification accuracy.
This study utilized three-dimensional measurement technology to obtain 19 indicators reflecting the chest morphology of young women, extracted 5 typical chest indicators through R-type clustering, and further subdivided the chest shapes based on mean clustering and variance analysis. A chest shape recognition model based on Long Short-Term Memory (LSTM) was constructed to train and test the experimental data, improving the accuracy of chest shape classification, thereby providing a basis for personalized clothing structural design.
Experiment

1.1 Experimental Subjects
As body shape is influenced by various factors such as age and region, to ensure targeted classification, 230 young women from Jiangsu, Zhejiang, and Shanghai regions, aged 18 to 28, were selected. This age group represents a completed stage of female body development and reflects typical body characteristics of young women.
1.2 Instruments and Conditions
The experimental measurement used the American TC2 three-dimensional body measurement instrument, with the measurement environment temperature set at (27±3)℃ and relative humidity at 60%±10%, meeting the requirements for naked measurements.
1.3 Measurement Requirements
The measurement room was closed and unlit, following GB/T 23698—2009 “General Requirements for Three-Dimensional Scanning Body Measurement Methods”. Test subjects were required to wear high-elasticity sports vests without inserts, primarily made of polyester fiber and spandex, with adjustable dimensions at the back. They wore black swim caps and did not wear jewelry, watches, etc. To reduce measurement errors, each test subject underwent three repeated measurements, and the average of these three scans was taken.
1.4 Measurement Items
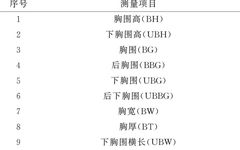
Based on the requirements of women’s clothing pattern research, 15 basic measurement items reflecting women’s chest morphology and 4 derived indicators were determined, as shown in Table 1.
Table 1 Measurement Items
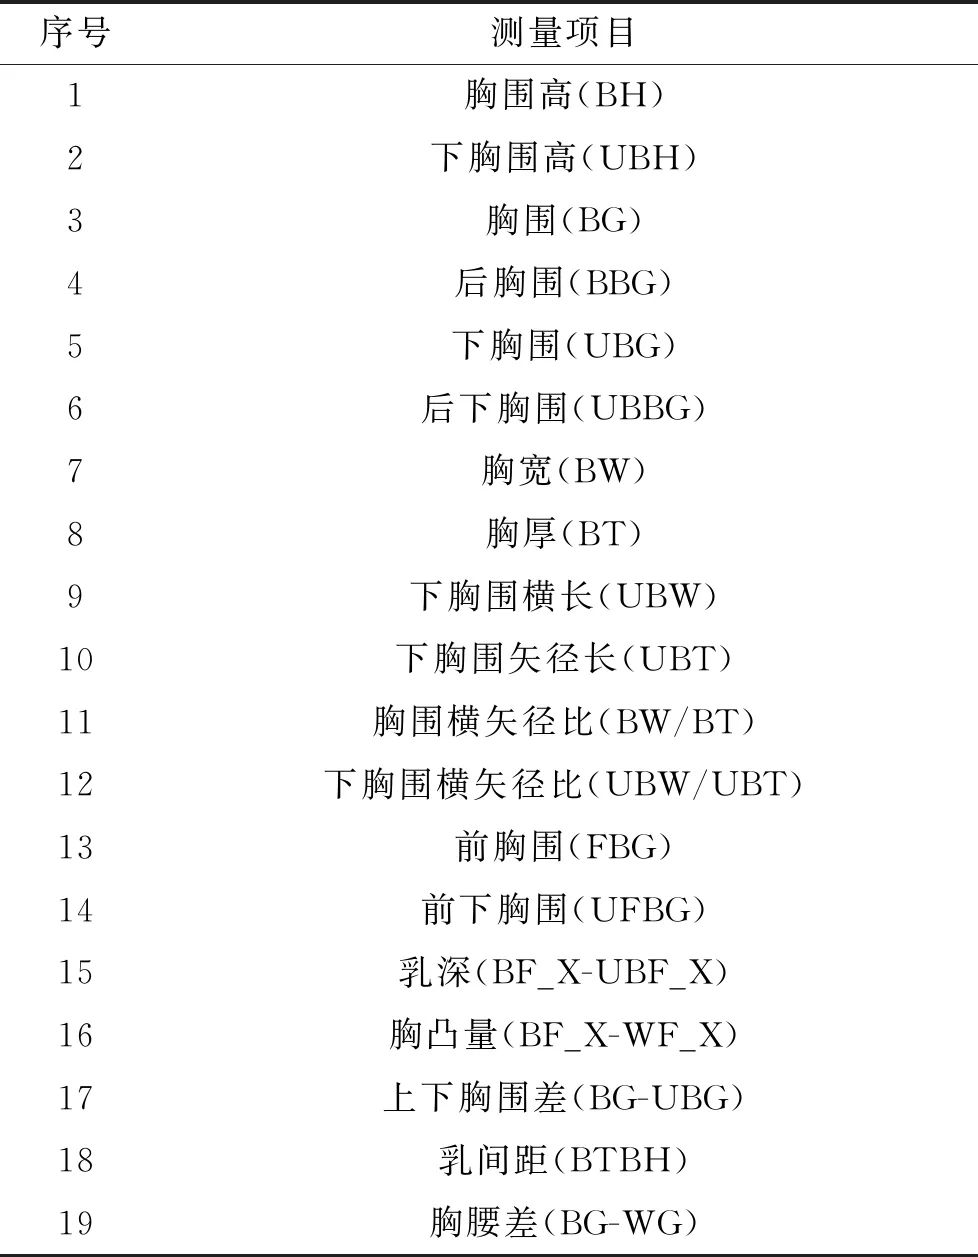
Note: The front chest circumference (front lower chest circumference) is the length from the left armpit along the front chest circumference line (lower chest circumference line) to the right armpit; the back chest circumference (back lower chest circumference) is the length from the left armpit along the back chest circumference line (back lower chest circumference line) to the right armpit.
Data Processing and Analysis

2.1 Cluster Analysis
Cluster analysis refers to the process of grouping a collection of physical or abstract objects into multiple classes composed of similar objects [10]. In cluster analysis, it can be divided into Q-type cluster analysis and R-type cluster analysis based on the classification objects. R-type clustering can classify indicators or variables.
Using SPSS 19.0 software for data preprocessing, invalid samples were removed, determining the effective sample size for this study to be 221, with these 221 sets of effective body data serving as the final experimental samples. SPSS 19.0 software was used to perform R-type cluster analysis on the 19 chest measurement items and indicators, selecting the farthest distance method as the clustering method and Pearson correlation as the method for measuring variable similarity for clustering. Figure 1 shows the clustering dendrogram of the chest measurement items.
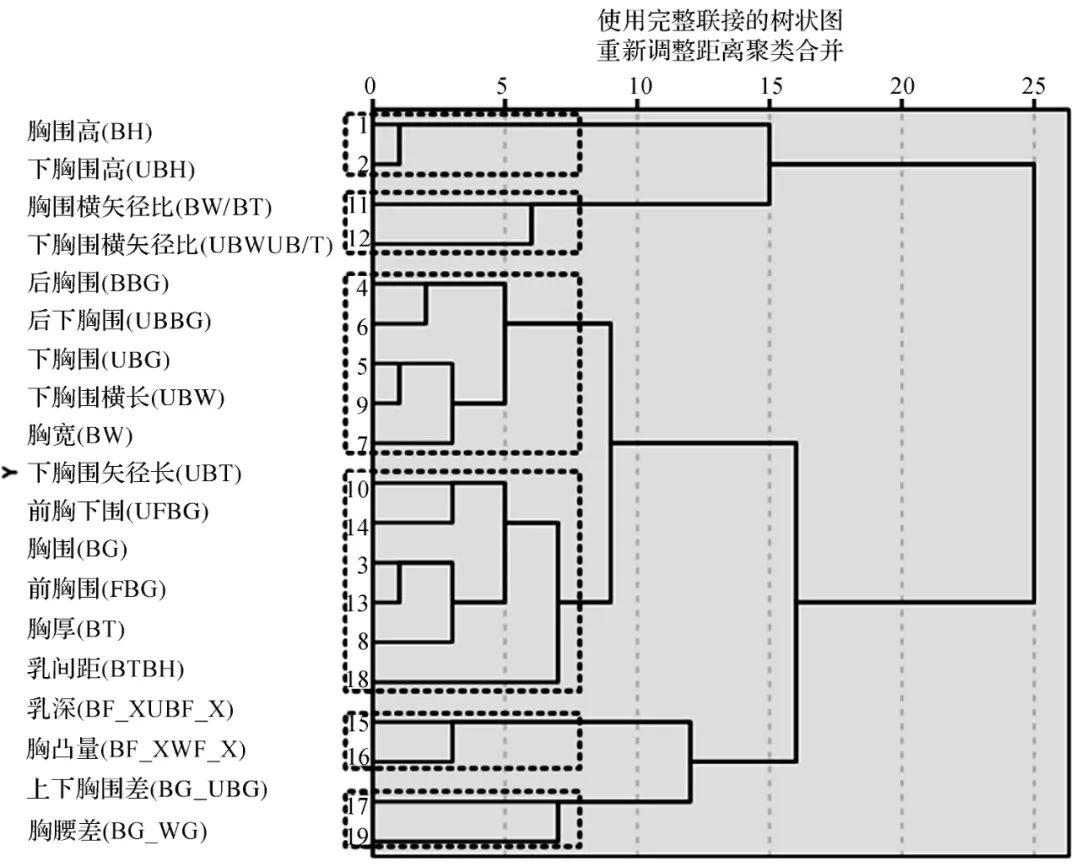
Figure 1 Clustering Dendrogram
To ensure significant differences between groups after clustering and that the indicators reflecting body morphology have higher representativeness, the 19 chest-related measurement items were classified into 6 categories based on the clustering dendrogram. The first category: chest height (BH), lower chest height (UBH), reflecting the height of the chest position; the second category: chest width ratio (BW/BT), lower chest width ratio (UBW/UBT), reflecting the fullness of the chest; the third category: back chest circumference (BBG), back lower chest circumference (UBBG), lower chest circumference (UBG), lower chest width (UBW), chest width (BW), reflecting the relative width of the chest; the fourth category: lower chest depth (UBT), front lower chest circumference (UFBG), chest circumference (BG), front chest circumference (FBG), chest thickness (BT), inter-breast distance (BTBH), reflecting the dimensional direction of the chest; the fifth category: breast depth (BF_X-UBF_X), chest protrusion (BF_X-WF_X), reflecting the relative height of the breast; the sixth category: upper-lower chest circumference difference (BG-UBG), chest-waist difference (BG-WG), reflecting the relative three-dimensionality of the chest.
2.2 Selection of Typical Indicators
To determine the correlation between variables within each category and select representative typical indicators, the correlation index of one variable with other indicators in the same category was calculated, combined with professional knowledge to determine typical indicators, specific calculations are shown in Formula (1):

In Formula (1), j is the number of variables, r is the correlation coefficient of the shown indicator with other indicators in the same category, and mj is the number of indicators in the category where indicator r is located.
Since the indicators related to chest height have a low correlation with the detailed dimensions of the chest, they have little impact on the subdivision of chest morphology; thus, the first category of height items was excluded, and feature indicators were extracted from the remaining 5 categories.
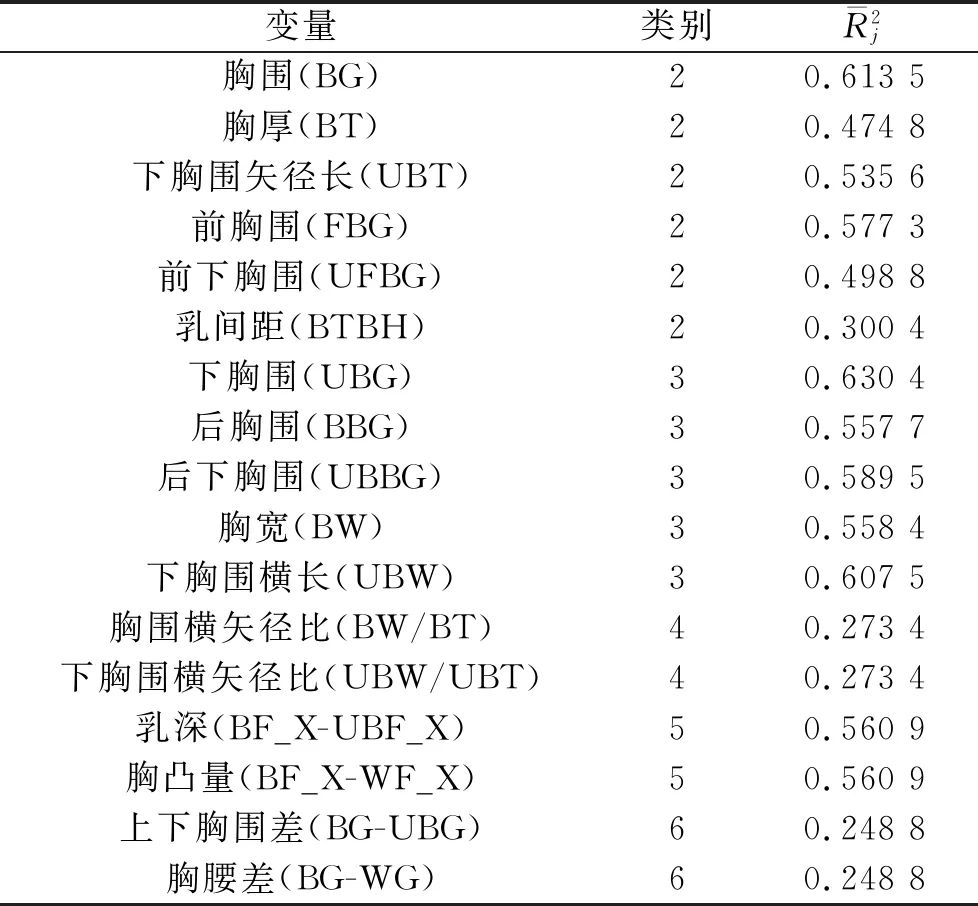
Using the formula for the correlation index between the above variables, the values for each variable in each category were calculated, extracting the maximum variable as the typical chest indicator, with the calculation results of the correlation values for each category shown in Table 2.
Comparing the correlation indices of the parameters in the 5 categories, the chest circumference (BG), lower chest circumference (UBG), chest width ratio (BW/BT), breast depth (BF_X-UBF_X), and upper-lower chest circumference difference (BG-UBG) were extracted as typical chest indicators.
Table 2 Values of Each Category Variable
2.3 Chest Shape Analysis
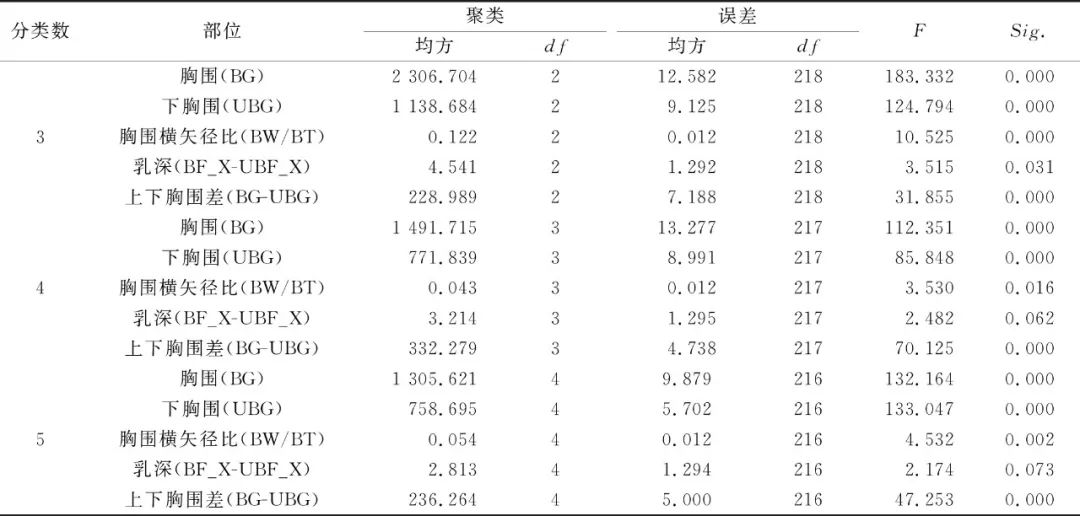
To achieve the subdivision of young women’s chest shapes, based on the 5 typical chest indicators obtained, K-means clustering method was applied to classify the chest data of 221 body samples, determining the clustering number range as 3 to 5 classes. The variance analysis results of typical indicators in each class are shown in Table 3. Observing the data in Table 3, it can be seen that when dividing the experimental samples into 3 classes, the F-test values of the chest-related variables are all less than 0.05, indicating that the clustering choice of 3 classes is optimal.
Table 3 Variance Statistical Results of Typical Indicator Clustering
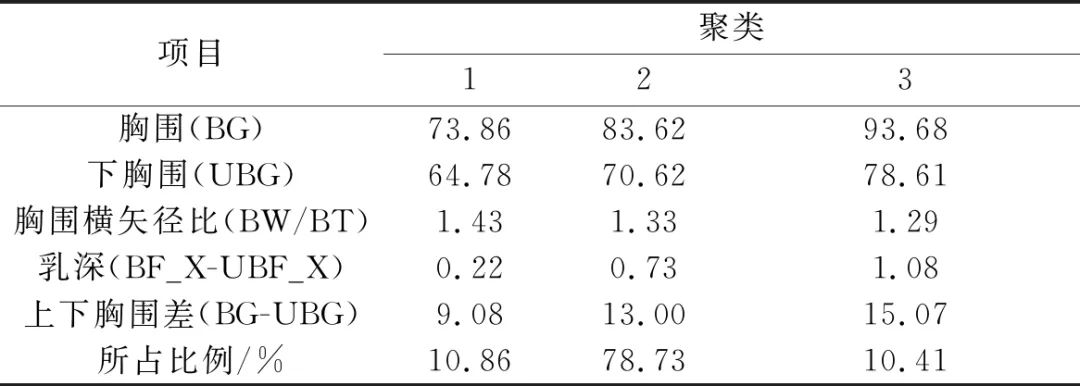
According to the final clustering center results, the 221 research samples were subdivided into 3 types of chest shapes, with each type having 24, 174, and 23 individuals, respectively. The specific data of typical indicators for each type of chest shape can be obtained from the final clustering center results, and the intermediate body representing each category can be identified. Figure 2 shows images of the intermediate bodies for each category. Table 4 presents the final clustering center values of chest-related variables and the proportions of each type in the total sample.
Table 4 Final Clustering Center and Proportions of Each Type
From the chest images in Figure 2, it can be observed that there are significant differences among each type of chest.
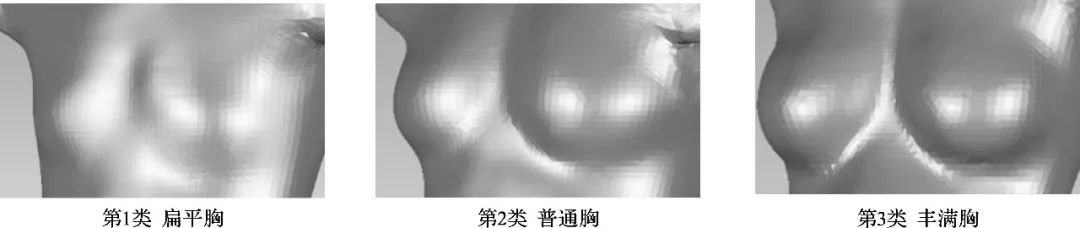
Figure 2 Chest Classification
Type 1: Breasts are not prominently protruding, the chest thickness is relatively thin, and the width is relatively wide, appearing as a flat chest;
Type 2: Breasts are fuller and protruding, with moderate width and thickness, appearing as an ordinary chest;
Type 3: Breasts are full and prominently protruding, with a noticeable cleavage, and the chest thickness is relatively thick, appearing as a full chest.
Construction of Chest Shape Recognition Model Based on LSTM

Long Short-Term Memory (LSTM) neural networks, based on Recurrent Neural Networks (RNN), add memory cells to each neuron unit in the hidden layer, allowing for controllable memory information over time series [11]. Each time data is passed among the hidden layer units, three controllable gates (forget gate, input gate, output gate) manage the retention and forgetting of previous and current information, enabling the LSTM network to possess long-term memory functionality.
LSTM algorithms are simple, training is straightforward, and they offer better generalization performance and advantages in simulating dependency relationships among data. Therefore, they can simulate the dependencies between different feature data related to the human chest, achieving detailed segmentation of the chest. Among the commonly used neural network models suitable for recognition and classification, probabilistic neural networks (PNN) require each training sample to correspond to one hidden layer neuron, which complicates the network structure as the sample size increases. Backpropagation neural networks (BP) have issues with slow convergence speed and can easily get trapped in local minima, leading to training failures. Compared to PNN and BP, LSTM can also batch train data, saving model parameters and optimizing complex objective functions [12]. Therefore, this study constructs a human chest recognition model based on LSTM, as shown in Figure 3.
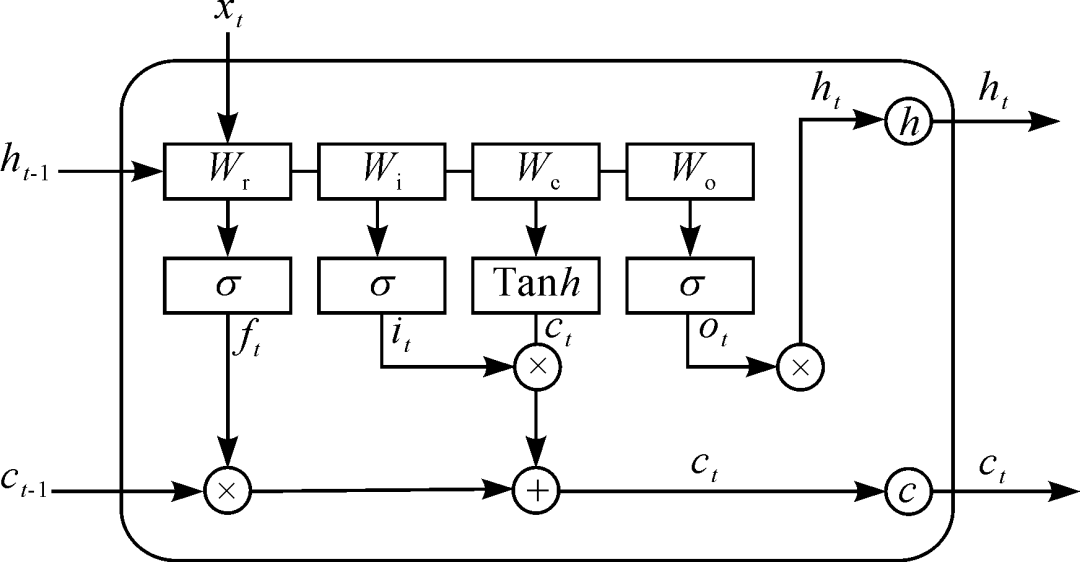
Figure 3 LSTM Block Structure
The LSTM-based model possesses memory functionality, provided by the LSTM blocks in the network. The input data for the LSTM block consists of the cell state ct-1 from the previous time point, output ht-1, and the input xt at time t, with the output data being the cell state ct and output ht at time t. The forget gate in LSTM determines the extent to which the state unit ct-1 from time t-1 influences ct, the input gate determines how much of the input xt at time t is retained in ct, and the output gate determines how much of the state unit ct at time t is retained in the output gate, with ct and ht participating in the LSTM computation at time t+1.
The specific computational process within LSTM is as follows:
Forget gate calculation formula:
ft=σ(WfXt+Ufht-1+bf)
Input gate calculation formula:
it=σ(W1Xt+Uiht-1+bi)
Candidate layer calculation formula:

Memory cell update formula, “°” represents dot multiplication:
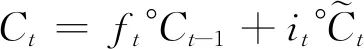
Output gate calculation formula:
Ot=σ(WoXt+Uoht-1+bo)
Final output calculation formula of LSTM:
ht=Ot°Tanh(Ct)
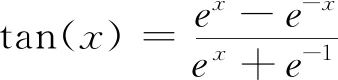
Where σ is the sigmoid function, and the sigmoid and tanh functions are two activation functions, as shown below:

Wf, Wi, Wc, Wo and Uf, Ui, Uc, Uo are the respective layer weights; bf, bi, bc, bo are the respective layer biases.
3.1 Experimental Data and Parameters
The 5 feature indicators extracted from the clustering results: chest circumference (BG), lower chest circumference (UBG), chest width ratio (BW/BT), breast depth (BF_X-UBF_X), and upper-lower chest circumference difference (BG-UBG) were used as input feature vectors for the LSTM model. The three categories of chest shapes were used as output vectors for the network model, selecting 3/4 of the samples, totaling 165, as training samples, with the remaining 1/4, totaling 56, as test samples.
3.2 Model Framework and Construction
In the clothing pattern-making process, the morphology of local body parts significantly affects the outcome of clothing patterns. Therefore, based on the clustering classification results of young women’s chests, a neural network structure based on LSTM was constructed to train and test the experimental data, achieving recognition and classification of the human chest to better predict the category of human chest shapes.
Due to the inconsistency in measurement standards of the input feature data, max-min normalization was applied to linearly transform the original data, with the transformation formula as follows:
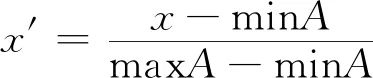
Where minA and maxA are the maximum and minimum values of attribute A, x is an original value of A, and x′ is the value mapped to the interval [0, 1] through max-min normalization.
The normalized chest data was input into the LSTM model in a time series format for training. The LSTM chest shape classification model is shown in Figure 4. In the input layer, [X1, X2, …, Xn] are the selected human chest feature vectors, with n being the number of selected feature vectors. One-hot encoding was applied to the category labels corresponding to the input features. To prevent the neural network model from falling into local optima, a mini-batch Adam optimization algorithm was used for training, with the batch size set to 10. After LSTM training, the number of nodes in the hidden layer of LSTM was set to 64, resulting in an output matrix of n×64. This output matrix was then fed into a fully connected layer (FC), with the number of nodes in the fully connected layer set to 32, resulting in the final output vector.
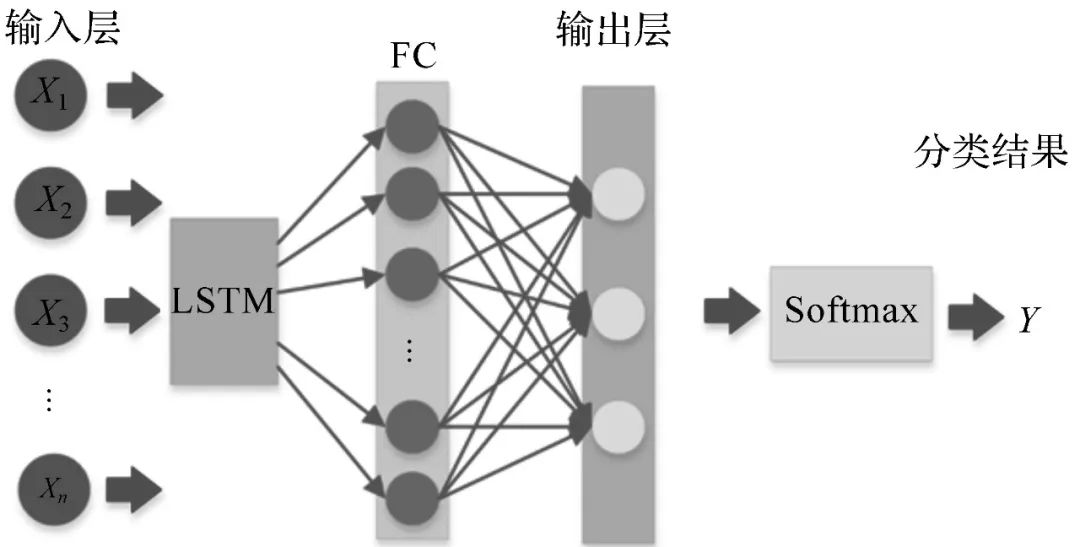
Figure 4 LSTM-Based Chest Shape Classification Model
Additionally, a small learning rate can lead to slow training, requiring more training iterations, while a large learning rate can cause the training to fail to converge. The learning rate is generally set within the range of (0,1) [13]. This network model used mini-batch learning, with a small learning rate set to 0.001 and training iterations set to 100. To reduce the risk of overfitting, dropout was applied randomly to hide certain nodes in the fully connected layer, set to 0.2. Finally, Softmax was used as the classification function to compute the output vector and obtain the chest classification results.
3.3 Results and Analysis
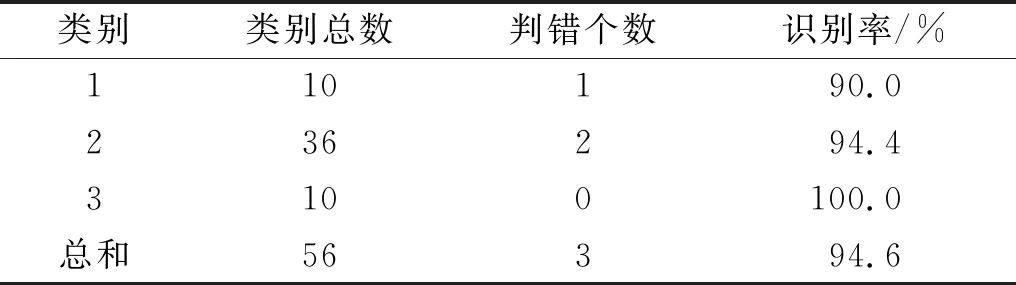
The accuracy rates of the LSTM-full connection neural network model for classifying young women’s chest shapes are shown in Table 5, indicating that the accuracy rates for classifying each type of chest shape are all above 90%, with an overall recognition accuracy of 94.6% for the model.
Table 5 Accuracy Rates of LSTM+FC for Chest Shape Classification
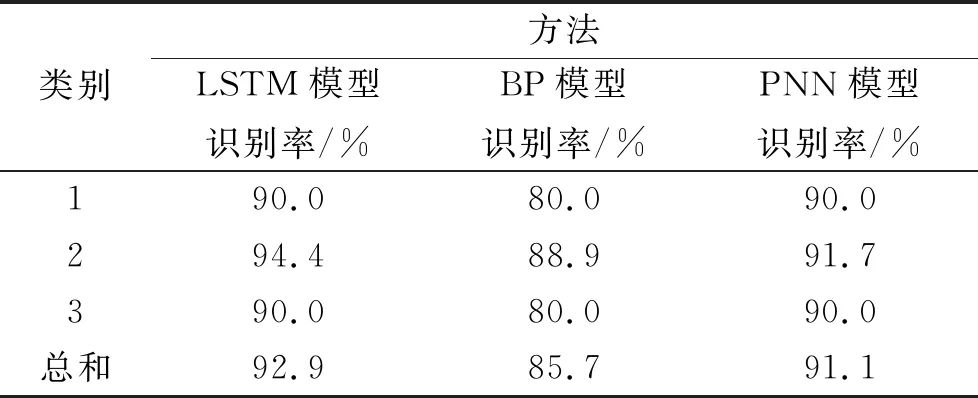
To verify the advantages of the LSTM neural network and FC combination model for classifying human chests, comparisons were made with LSTM neural networks, BP neural networks, and PNN neural networks. The accuracy rates for chest shape classification using these three models are shown in Table 6. It can be seen that the overall recognition accuracy rates for classifying young women’s chests using the LSTM network, traditional BP network, and PNN network were 92.9%, 85.7%, and 91.1%, respectively. Comparing Table 6, it is clear that the LSTM neural network and FC combination model achieved the best classification results.
Table 6 Accuracy Rates of LSTM, BP, and PNN for Chest Shape Classification
Conclusion

a) Utilizing three-dimensional measurement technology to obtain body data, 5 typical indicators reflecting the chest morphology of young women were extracted through R-type cluster analysis;
b) Using the extracted typical indicators, chest shapes were classified into 3 types through mean clustering and variance analysis, yielding the clustering centers and proportions of typical indicators;
c) Constructing an LSTM fully connected neural network model to recognize and classify the chest shapes of young women, with the 5 typical indicators as input feature parameters and the chest shape classification results as output. The overall identification accuracy of the model was 94.6%.
References
[1] Zou Qizhi, Xie Hong, Peng Lei. Research on Fit Prototypes in Customized Women’s Clothing Systems[J]. Journal of Qingdao University (Engineering Technology Edition), 2012, 27(4): 51-60.
[2] Wu Qiuying. On the Relationship Between Body Shape and Clothing Structure[J]. Tianjin Textile Science and Technology, 2005, 43(4): 41-44.
[3] SONG H K, KIM S M, ASHDOWN S P, et al. Categorization of lower body shapes for adult females based on multiple view analysis[J]. Textile Research Journal, 2011, 81(9): 914-931.
[4] Chen Huirong, Zhang Xin, Tao Na. Analysis of Chest Morphological Characteristics of Young Women Based on Three-Dimensional Body Measurement[J]. Journal of Xi’an Engineering University, 2008(2): 147-152.
[5] YOON M K, NAM Y J, KIM W et al. Classifying male upper lateral somatotypes using space vectors[J]. International Journal of Clothing Science and Technology, 2016, 28(1): 115-129.
[6] Zhang Suyun, Zou Fengyuan, Ding Xiaojun, et al. Research on Body Shape Classification of Young Women Based on SVM[J]. Journal of Zhejiang University of Science and Technology, 2008, 25(1): 41-45.
[7] Jin Juanfeng, Sun Jie, Ni Shiming, et al. Subdivision of Young Women’s Hip Shapes Based on Three-Dimensional Body Measurement[J]. Journal of Textile Science, 2013, 9(34): 109-122.
[8] Jin Juanfeng, Yang Yunchu, Xia Xin, et al. Construction of a Probabilistic Neural Network Recognition Model for Young Women’s Hip Shapes Based on Three-Dimensional Measurement[J]. Journal of Textile Science, 2014, 35(4): 100-104.
[9] Yin Ling, Xia Lei, Xu Caiguo. Female Body Shape Discrimination Based on Random Forest[J]. Journal of Textile Science, 2014, 35(5): 114-116.
[10] Liu Aiyu, Tian Zhipeng. SPSS Data Analysis Tutorial[M]. Beijing: Peking University Press, 2017.
[11] HOCHREITER S, SCHMIDHUBER J. Long short-term memory[J]. Neural Computation, 1997, 9(8): 1735-1780.
[12] GRAVES A. Long short-term memory[M]. Berlin: Springer, 2012: 1735-1780.
[13] HAM F M, KOSTANIC I. Principles of neurocomputing for science & engineering[M]. Beijing: China Machine Press and McGraw-Hill Education (Asia) Co., 2003.
Published | Zhejiang University of Science and Technology Magazine New Media Center
Editor | Xu Hang