
♚
Author: Yishui Hancheng, CSDN Blog Expert, Research Areas: Machine Learning, Deep Learning, NLP, CV
Blog: http://yishuihancheng.blog.csdn.net
For us algorithm analysts, machine learning and neural networks are no longer new topics. Building and training a good model for online production is an essential basic function. For business personnel or those who are not very clear about or concerned with model details, this can seem very abstract. At this point, necessary visualization work becomes very important. The currently mature visualization tools include: matplotlib, seaborn, Chaco, pychart, VPython, yellowbrick, etc. These are the more mainstream modules used frequently, but when it comes to visualizing model structures, they seem somewhat inadequate. Here, we urgently need some specialized tools to help us complete these tasks.
This article mainly summarizes the tools that the author has frequently used during the past three years of model experience. If good tools are discovered later, this article will be continuously updated. Friends who are interested are welcome to leave comments and recommendations.
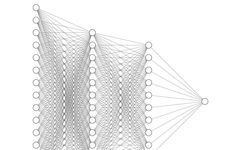
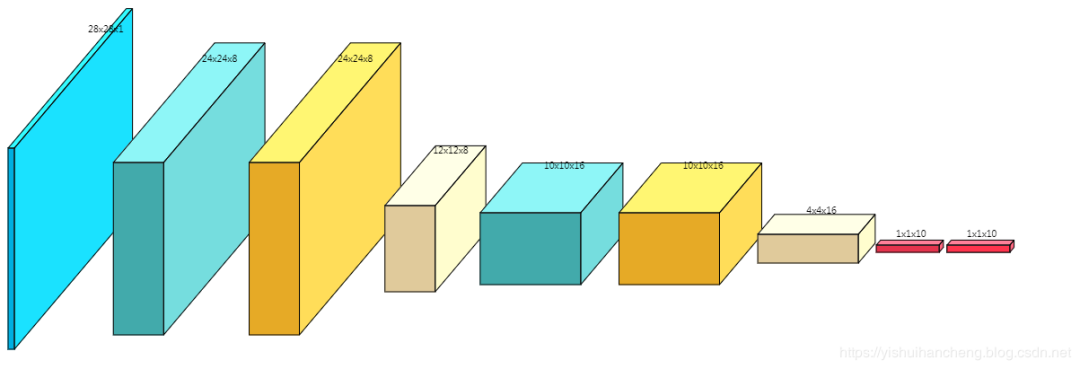
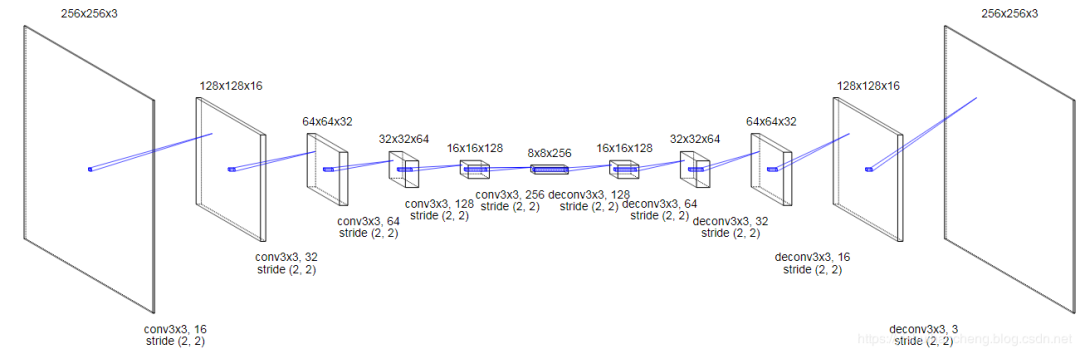
First, let’s look at a few pictures of finished model structures, as shown below:
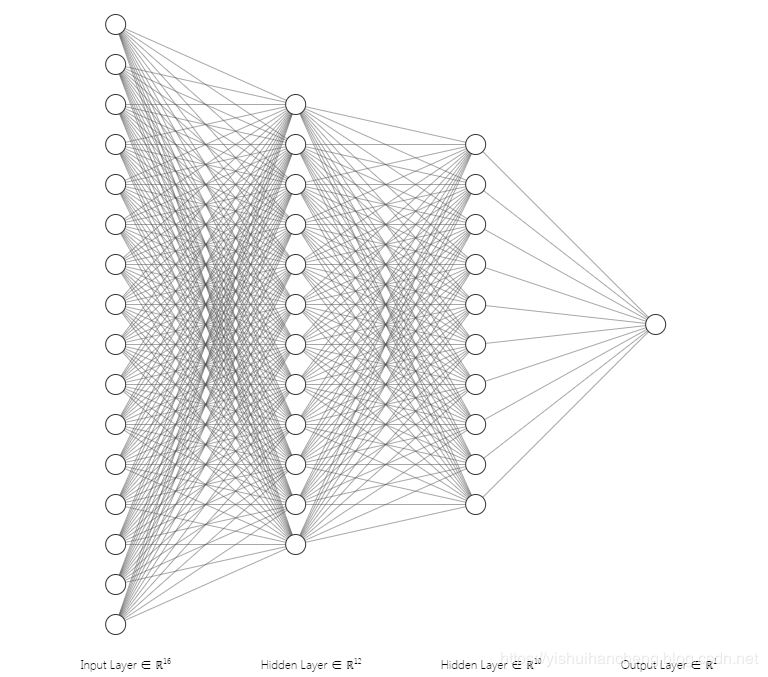
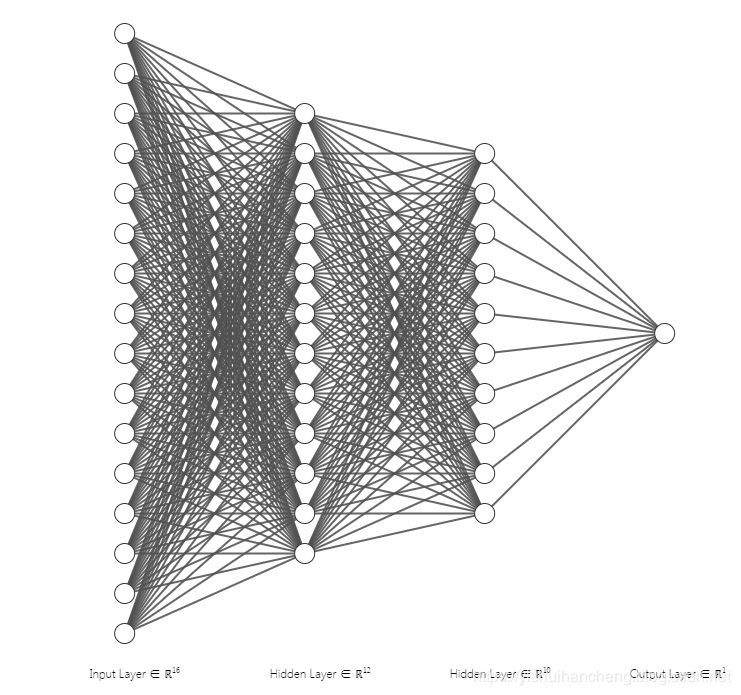
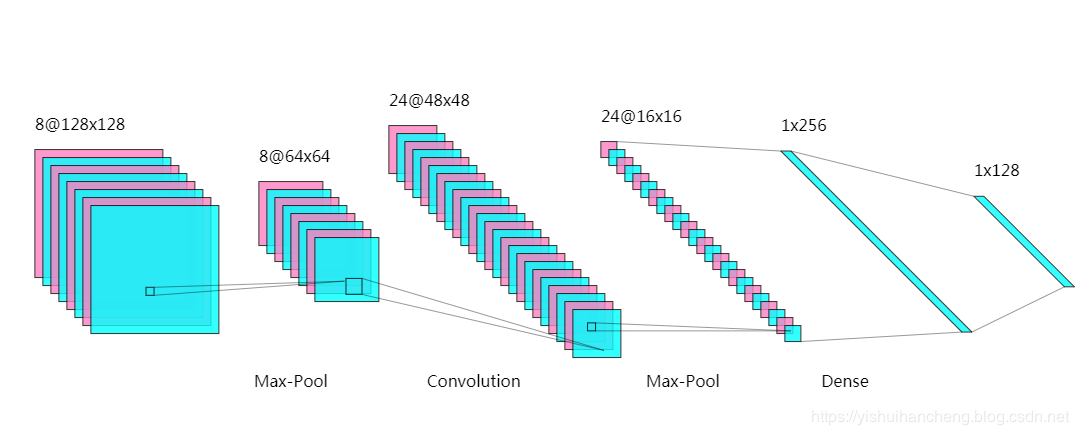
The above images can all be generated with one click, making it feel very powerful. While looking at the network structure visualization, have you guessed which model structure corresponds to each image? 【From top to bottom: FCNN, LeNet, AlexNet】
Do you want to give it a try? This tool is called NN-SVG, and the online address and GitHub link are provided below. Hurry up and try it out.
Website: http://alexlenail.me/NN-SVG/

GitHub: https://github.com/alexlenail/NN-SVG
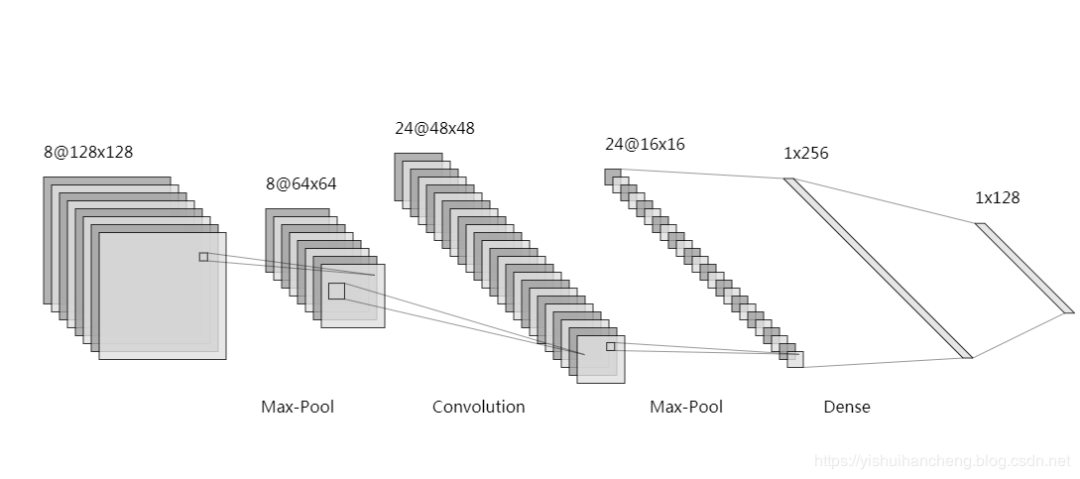
Next, let’s continue to look at the images, as shown below:
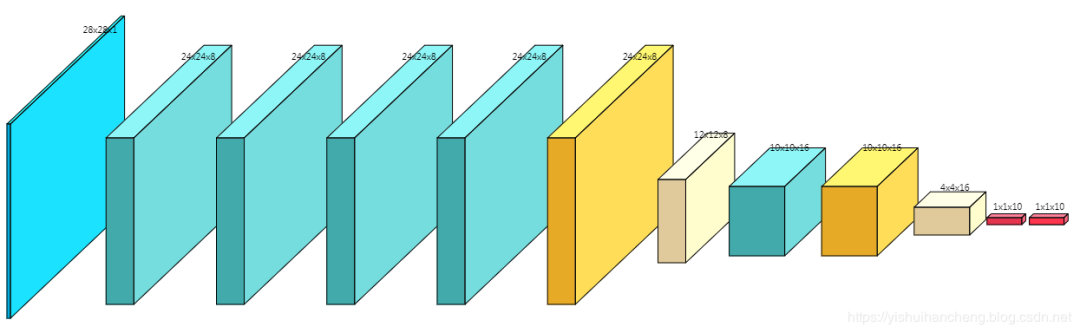
This also supports one-click generation, and it has the advantage of supporting parameter customization for the model structure. For example, the drawing source code for the image above is as follows:
input(28, 28, 1)
conv(24, 24, 8)
conv(24, 24, 8)
conv(24, 24, 8)
conv(24, 24, 8)
relu(24, 24, 8)
pool(12, 12, 8)
conv(10, 10, 16)
relu(10, 10, 16)
pool(4, 4, 16)
fullyconn(1, 1, 10)
softmax(1, 1, 10)
It really is just pure parameters, a very concise structure definition.
This tool is called ConvNetDraw, and the online address and GitHub link are provided below. If you’re interested, feel free to try it out.
Website: https://cbovar.github.io/ConvNetDraw/

GitHub: https://github.com/cbovar/ConvNetDraw
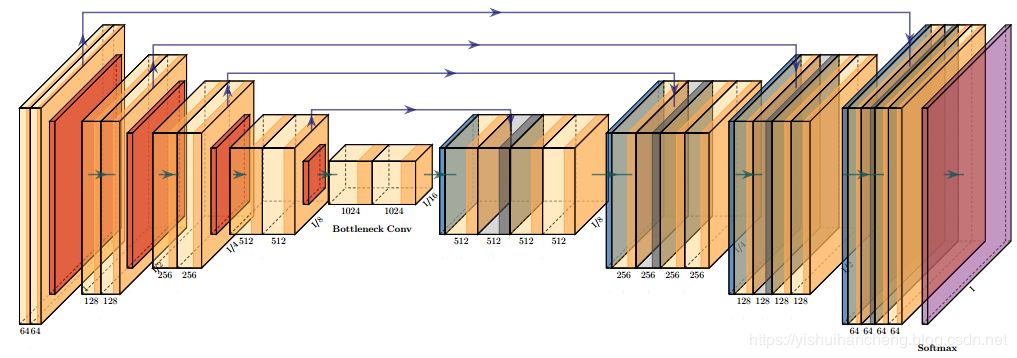
Next, let’s continue to look at the images, as shown below:
A simple drawing example provided by the official is as follows:
import sys
sys.path.append('../')
from pycore.tikzeng import *

# defined your arch
arch = [
    to_head( '..' ),
    to_cor(),
    to_begin(),
    to_Conv("conv1", 512, 64, offset="(0,0,0)", to="(0,0,0)", height=64, depth=64, width=2 ),
    to_Pool("pool1", offset="(0,0,0)", to="(conv1-east)"),
    to_Conv("conv2", 128, 64, offset="(1,0,0)", to="(pool1-east)", height=32, depth=32, width=2 ),
    to_connection( "pool1", "conv2"),
    to_Pool("pool2", offset="(0,0,0)", to="(conv2-east)", height=28, depth=28, width=1),
    to_SoftMax("soft1", 10 ,"(3,0,0)", "(pool1-east)", caption="SOFT"  ),
    to_connection("pool2", "soft1"),
    to_end()
    ]

def main():
    namefile = str(sys.argv[0]).split('.')[0]
    to_generate(arch, namefile + '.tex' )

if __name__ == '__main__':
    main()
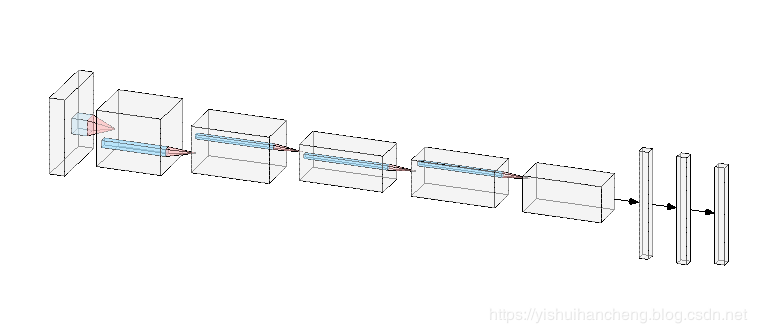
The visualization of the model structure is directly drawn based on the input parameter settings and saved locally. Personally, I think the drawing effect of this tool is more aesthetically pleasing compared to the previous ones. I wonder what everyone else thinks. This tool is called PlotNeuralNet, written by a professional expert, and the effect is quite good. There is currently no online experience address, but here is the GitHub link below.
https://github.com/HarisIqbal88/PlotNeuralNet
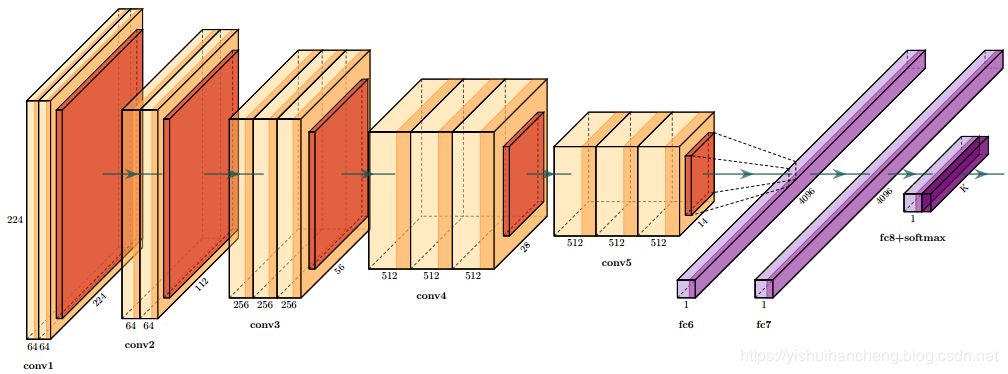
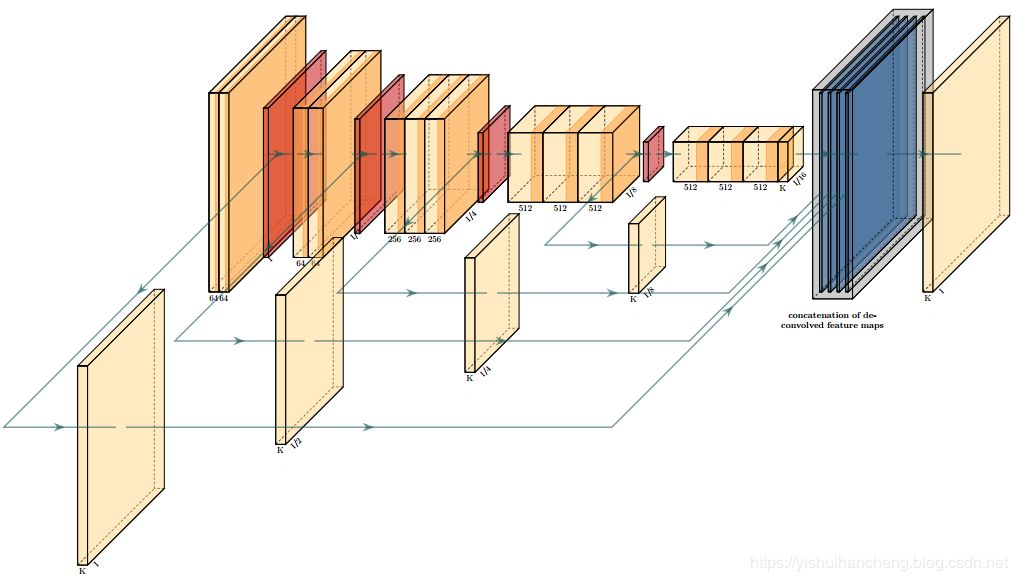
Next, let’s continue to look at the images, as shown below:
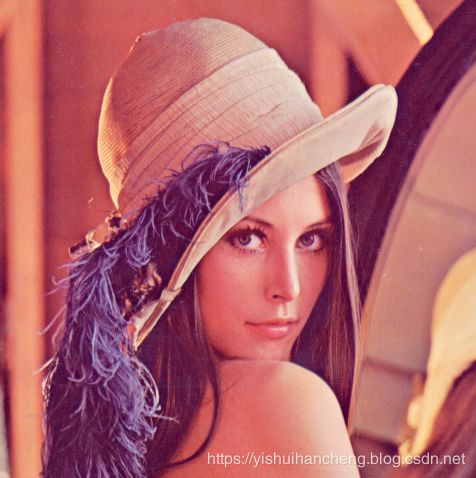

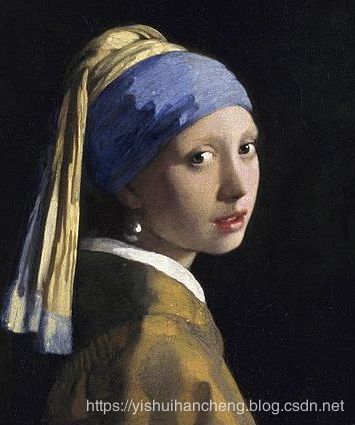
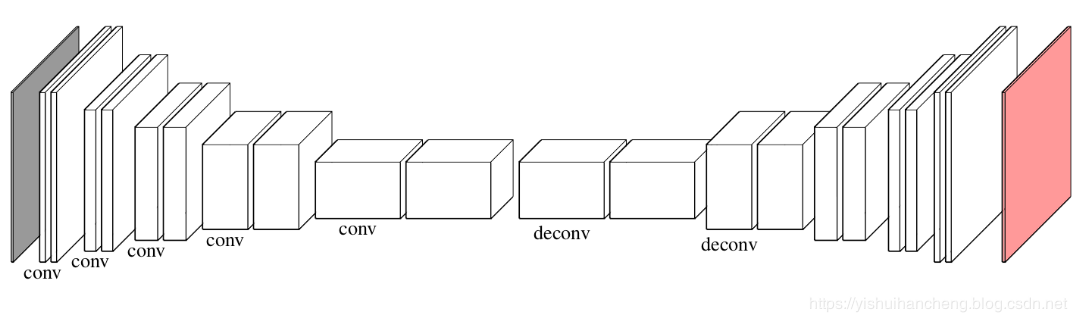

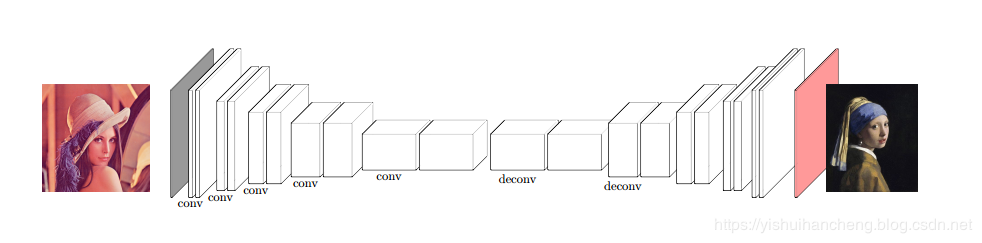
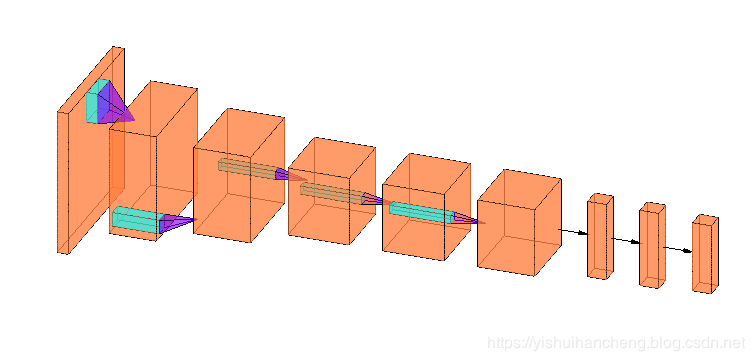
Personally, I feel that this network visualization tool does not have particularly innovative points. The main highlight is that it adds input images and converted result images at the input and output of the network, making it visually more intuitive. The GitHub link for this tool is provided below.
https://github.com/jettan/tikz_cnn
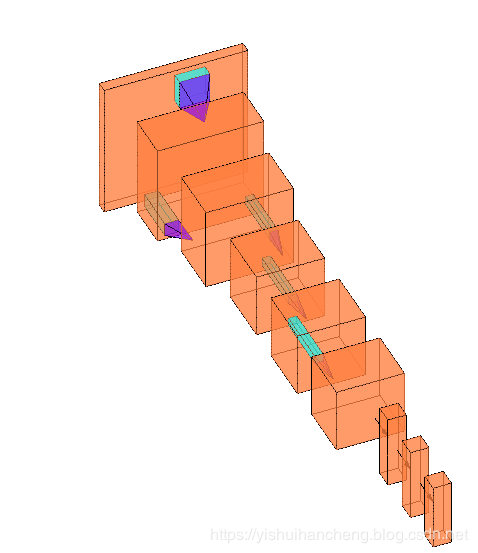
Next, we continue to look at the images, as shown below:
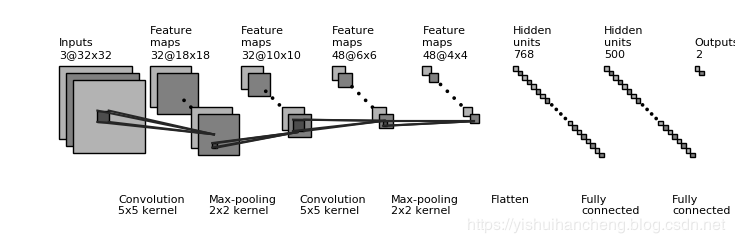
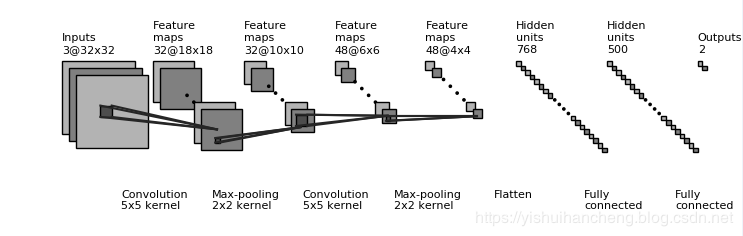
This tool gives me the first impression of being very simple. This is said to be a neural network structure visualization tool completely based on Python. After reading the source code, I found that it is actually a wrapper based on matplotlib, but the effect is still acceptable. After all, it is relatively simple. The GitHub link for this tool is provided below. If you’re interested, you can try it out after installing some basic packages.
https://github.com/gwding/draw_convnet
Next, we continue to look at the images, as shown below:
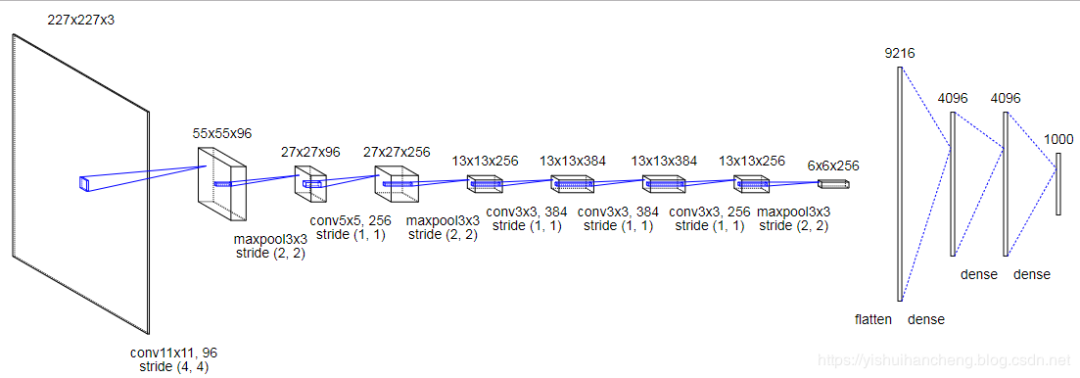
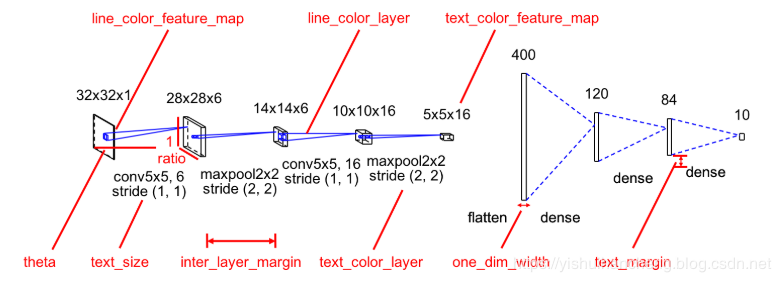
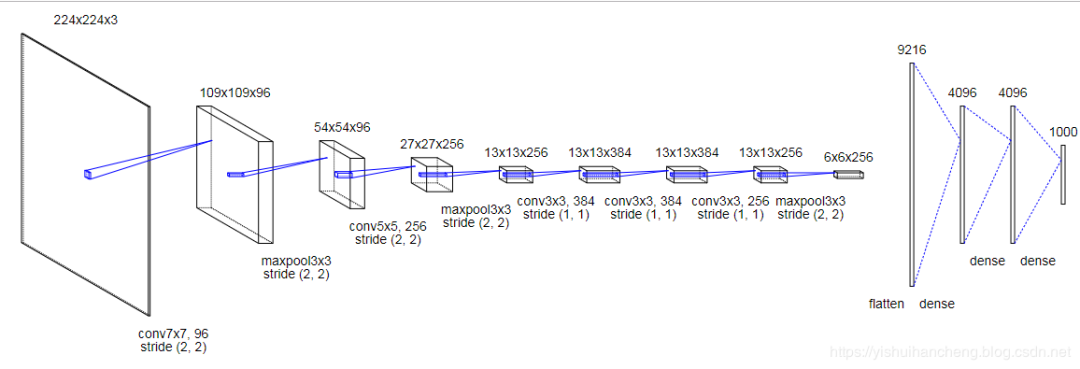
This drawing tool leaves the biggest impression at first glance because of the many parameters in the model structure diagram. I feel it is more suitable for academic papers or presentation PPTs. It provides three types of result saving formats: SVG, PDF, and PPTX, allowing users to choose based on their actual needs. Of course, this tool also offers a hand-drawn style method for visualizing network structures, as shown in the effect diagram below:
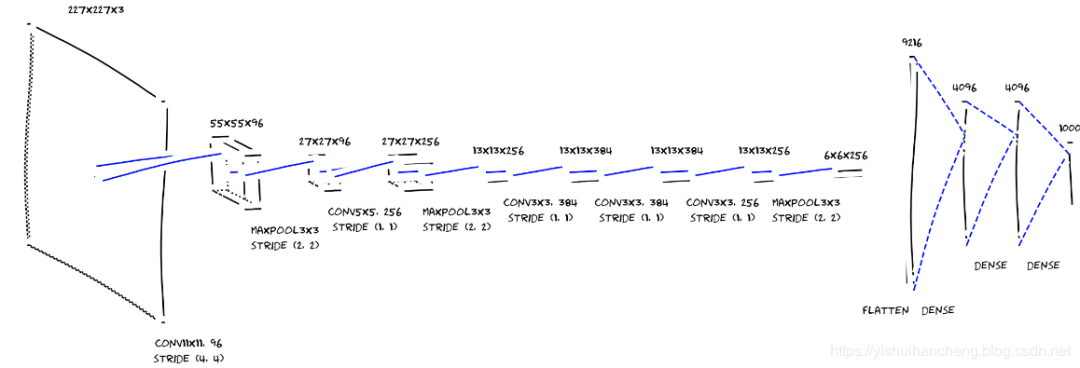
Doesn’t the hand-drawn network structure look interesting? Actually, converting the drawing results of matplotlib into a hand-drawn style is not difficult. The official provides a simple model visualization source code as follows:
from convnet_drawer import Model, Conv2D, MaxPooling2D, Flatten, Dense
from pptx_util import save_model_to_pptx
from matplotlib_util import save_model_to_file
model = Model(input_shape=(227, 227, 3))
model.add(Conv2D(96, (11, 11), (4, 4)))
model.add(MaxPooling2D((3, 3), strides=(2, 2)))
model.add(Conv2D(256, (5, 5), padding="same"))
model.add(MaxPooling2D((3, 3), strides=(2, 2)))
model.add(Conv2D(384, (3, 3), padding="same"))
model.add(Conv2D(384, (3, 3), padding="same"))
model.add(Conv2D(256, (3, 3), padding="same"))
model.add(MaxPooling2D((3, 3), strides=(2, 2)))
model.add(Flatten())
model.add(Dense(4096))
model.add(Dense(4096))
model.add(Dense(1000))
# save as svg file
model.save_fig("example.svg")
# save as pptx file
save_model_to_pptx(model, "example.pptx")
# save via matplotlib
save_model_to_file(model, "example.pdf")
Defining the model based on keras is overall very concise. This tool is called convnet-drawer, and there is currently no online experience address. The GitHub link is provided below.
https://github.com/yu4u/convnet-drawer
Finally, let me introduce a drawing tool, but I won’t post images because it requires you to import the model yourself. The online address and GitHub link are here. The homepage screenshot is as follows:
Website: https://lutzroeder.github.io/netron/

GitHub: https://github.com/lutzroeder/netron
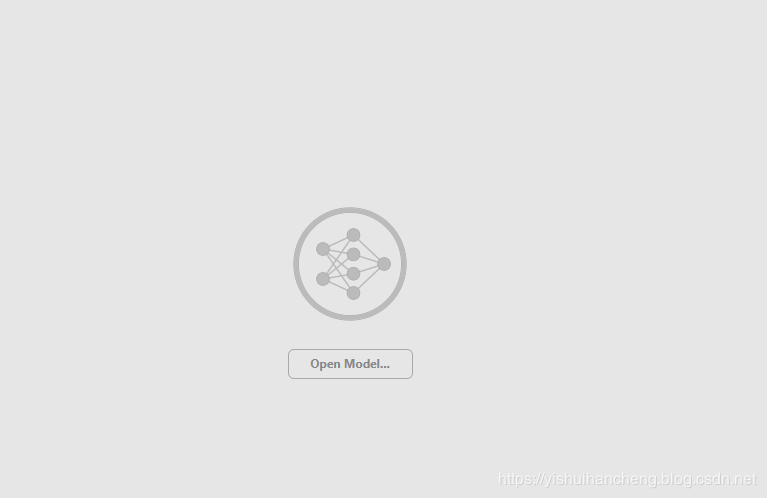
Click on Open Model to load the model. The official also provides files that can be installed and used directly. The download repository is below. The screenshot is as follows:
https://github.com/lutzroeder/netron/releases/tag/v3.5.7
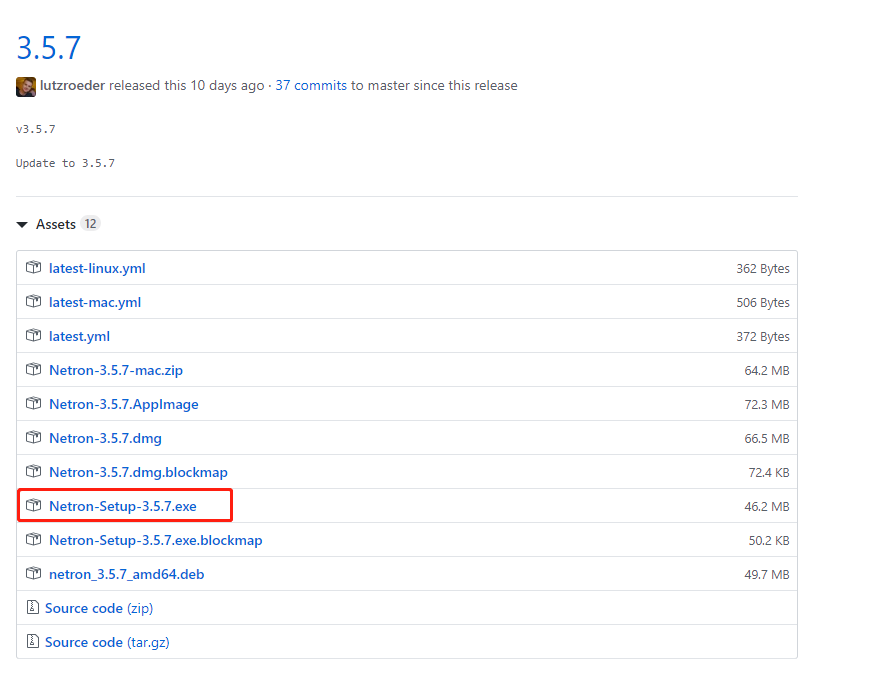
Windows environment can install the above exe file directly.
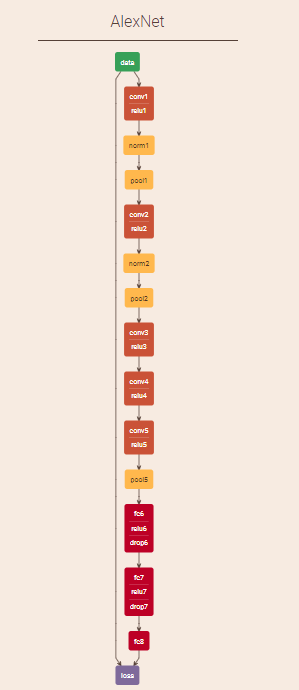
In addition to the general-purpose neural network model structure visualization tools introduced above, there are also some visualization tools specifically for certain libraries, such as NetScope which only supports Caffe drawing. The online address is below, and the effect is shown in the image:
http://ethereon.github.io/netscope/quickstart.html
Of course, in addition to the neural network visualization tools introduced in this article, there are also some other useful tools that the author has hardly or rarely used, so they will not be introduced further. Welcome to communicate.
Support the Author

The Chinese Python community aims to become a decentralized global technical community with a vision of becoming a spiritual tribe of 200,000 Chinese Python developers. It currently covers major mainstream media and collaboration platforms, establishing extensive connections with well-known companies and technical communities such as Alibaba, Tencent, Baidu, Microsoft, Amazon, Open Source China, CSDN, etc. It has tens of thousands of registered members from more than a dozen countries and regions, represented by government agencies, research institutions, financial institutions, and well-known companies at home and abroad, including the Ministry of Industry and Information Technology, Tsinghua University, Peking University, Beijing University of Posts and Telecommunications, the People’s Bank of China, the Chinese Academy of Sciences, Zhongjin, Huawei, BAT, Google, Microsoft, etc., with nearly 200,000 developers across the platform.


▼ Click Read Original to enjoy Tencent Cloud’s new user offer of 99 yuan/year for the first purchase