Recent population-based neuroimaging and behavioral measurement studies have opened up prospects for studying the relationship between individual differences in brain region connectivity and behavioral phenotypes. However, the multivariate nature of connectivity-based predictive models severely limits neuroscience’s insights into brain-behavior patterns. To address this issue, we propose a psychometric prediction framework based on regional connectivity. This article first elucidates two main applications: 1) the predictive ability of a single brain region for a range of psychometric variables; 2) the variability of predictive ability of a single psychometric variable across different brain regions. We compare the brain-behavior patterns provided by these methods with the brain-behavior relationships provided by activation methods. Then, leveraging the transparency afforded by our method, we demonstrate how the impacts of various data processing and analysis directly influence the patterns of brain-behavior relationships, as well as the unique insights into brain-behavior relationships that this method offers.
The relationship between brain regions and behavioral functions is a fundamental question in neuroscience. These relationships can be studied by linking individual variability in brain region connectivity with individual differences in behavioral performance (i.e., psychometric data). Recently available population-based neuroimaging datasets with a wide array of psychometric features have opened up prospects for studying the relationship between brain region connectivity and behavior. In particular, many studies have shown that individual profiles of functional connectivity (FC) between brain regions can predict individual scores on psychometric variables, including cognitive measures such as fluid intelligence and personality traits such as openness. Given the potential of these methods in cognitive and clinical neuroscience, developing a scientifically valid and useful connectivity-based framework to study brain-behavior relationships is an important goal for the neuroimaging community.
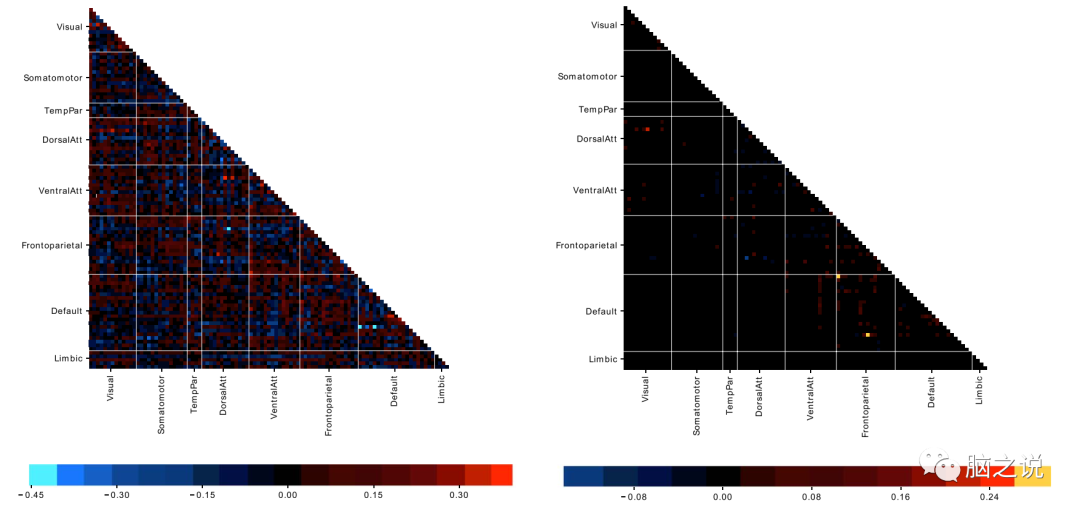
In recent studies, improving the performance of predictive models has been emphasized, evaluated by comparing predicted behavioral scores with observed behavioral scores. For example, across many different studies, the predicted and actual values of fluid intelligence show a Pearson correlation coefficient r of about 0.25, while 58 different measurement methods covering various domains achieve an average correlation of around r = 0.11. This relatively low model performance indicates that the field is still immature, and predicting individual differences in behavioral performance from inter-individual variability in FC remains particularly challenging. Additionally, within cognitive and clinical neuroscience frameworks, not only is predicting performance important, but the neurobiological validity of the model and its associated interpretability are also crucial, which raises a major issue with the current state of technology. Generally, researchers attempt to explain models with some sort of post hoc assessment, observing that brain connectivity features (e.g., region-to-region connectivity values) appear to play an important role in predictions. The relative relevance of features often derives from the weights assigned by regression algorithms. However, because predictive models typically adopt backward (or discriminative) models, such explanations can be extremely misleading, as the relative magnitude of these weights does not reflect the size of regions associated with a given psychometric variable, and may assign larger weights to features that are, in fact, unrelated to any brain processes of interest. The difficulty of interpretation can also be illustrated with an example, as shown in Figure 1, in support vector regression (SVR) and elastic net (EN). A small number of highlighted connection edges indicate that explanations based solely on these edges may not be representative. The inconsistency in weight assignments across regression algorithms also suggests that any interpretation lacks reliability. To address this issue, we propose a connectivity-based psychometric prediction (CBPP) framework. This approach is achieved by evaluating a machine learning model that predicts psychometric data from each brain region’s FC. Then, the predictive performance of psychometric data from each independent brain region model can be used to estimate the relationship between that region’s connectivity and the measured behavioral function.
The relationship between brain FC and behavior is multifaceted, and the degree of complexity prevents any one-to-one mapping between brain regions and behavioral functions. Many global (whole-brain connectivity or network-based connectivity) methods aim to explain this complexity in behavioral predictions. Local methods, while clearly simplifying the complexity of brain functions, provide additional insights into individual brain regions of interest. Such insights are necessary for gradually elucidating brain-behavior relationships, and subsequently investigating the predictive neurobiological validity. For instance, if the partitioning of the visual region best predicts performance in abstract reasoning, it can be expected that this model is partially driven by some confounding factors (e.g., shape of the posterior brain). Furthermore, from these insights, systematic examinations of how different factors influence predictive models can be conducted. Thus, for example, one can study how controlling for estimates of brain shape affects the pattern of relationships between brain regions and behavioral variables. Finally, from a more clinical perspective, region-based approaches can provide specific insights into patterns of brain region dysfunction and behavioral symptoms. In summary, region-based research methods provide complementary insights to currently used whole-brain and network-based research methods through the transparency they offer, thus providing new insights into brain-behavior relationships.
In the current study, we first examine the relationship between brain region connectivity and psychometric variables by observing the predictive profiles of specific regions for psychometric variables, and then describe the distribution profile of predictive performance across brain regions based on given psychometric scores. Subsequently, to better understand how method selection influences our study of brain-behavior relationships, we elucidate the impact of confounding factors that have not been systematically considered in the literature, such as brain size. We also investigate whether the complex denoising of resting-state functional connectivity (RSFC) provides a clear picture of brain-behavior patterns or seems to eliminate relevant signals. Finally, we compare our method with post hoc assessments of nodes or edges that play a role in prediction (as shown in Figure 1). After initially demonstrating the insights our method can provide, we will discuss our results and related open challenges.
2 Method Overview
2.1 Data and Preprocessing
In this study, to conduct extensive evaluations on high-quality data, we utilized data from the Human Connectome Project (HCP) with 1200 subjects released. The subjects were young healthy adults (ages 22-37) from twin and non-twin sibling families. Imaging data were acquired using a customized Siemens 3T Skyra. Each subject visited for two consecutive days, during which two resting-state fMRI tests were conducted with different phase encoding, namely left-right and right-left. Each run lasted 1200 frames (14.4 min), with a repetition time of 720 ms. We only considered subjects who completed all four groups of tests.
All raw rs-fMRI data from HCP underwent preprocessing through the HCP minimal processing pipeline, including motion correction, gradient nonlinearity distortion correction, EPI distortion correction, co-registration of T1-weighted images, and normalization to MNI152 space. The generated data is referred to as minimally processed data. Further noise removal was performed on HCP data using ICA-FIX. We refer to this data as FIX. To further investigate the impact of global signal regression (GSR), we regressed the cortical global signal (i.e., the average signal of all cortical vertices) and its temporal derivative from the FIX data. This data is referred to as FIX+GSR. Additionally, we controlled for 24 motion parameters, white matter (WM), and cerebrospinal fluid (CSF) signals and their derivatives using linear regression. We refer to this data as FIX+WM/CSF.
2.2 Preliminary Evaluation
To preliminarily develop our regional prediction method, we performed extensive preliminary evaluations on the general CBPP framework based on global methods (i.e., whole-brain connectivity information). The general workflow of the CBPP framework follows standard protocols and is illustrated in Supplementary Figure S1. In each step of the framework, various methods and parameter settings can be considered. In our evaluation, we primarily considered previously used methods summarized in Supplementary Table S2. Figure 2 shows the different methods considered at each step of our implementation of whole-brain CBPP. A total of 96 method combinations were evaluated using standard confound control methods. We used surface data from HCP, including all three different preprocessing strategies (minimally processed, FIX, and FIX+GSR).
2.3 Psychometric Prediction
For the prediction step, linear SVR and RR were implemented using the fitrlinear function in Matlab, while EN was implemented using the glmnet package in Matlab. We note that LASSO (Least Absolute Shrinkage and Selection Operator) is also widely applied in neuroscience research. However, since EN has been used in previous CBPP studies, it can be considered the best combination of RR and LASSO, leveraging high predictive performance and sparse representation, which we focus on here for RR and EN.
2.4 Region-Based CBPP
To directly investigate the neurobiological validity and interpretability of brain-behavior patterns, we propose a region-based CBPP framework. The psychometric prediction process based on regions is overall similar to that shown in Figure 2 and Supplementary Figure S1. The main difference is that the input features become the connectivity of individual brain regions, represented by the vector of FC values between that brain region and all other brain regions.
3 Results
3.1 Preliminary Evaluation
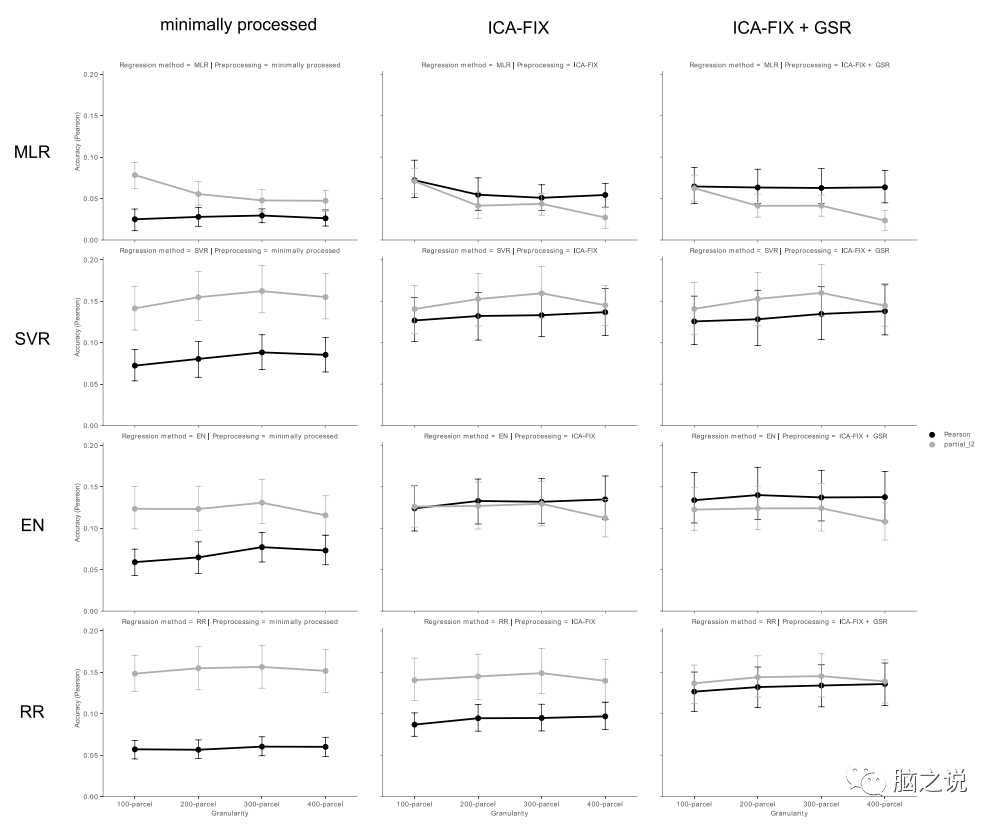
Figures 3 and Supplementary Figure S3 display the whole-brain CBPP results from all 92 different method combinations. Each point on the line graph shows the average predictive accuracy (in terms of Pearson correlation and inverse nRMSD) of 40 psychometric variables for specific combinations of methods. Numerically, at a 300 parcel granularity, the average correlation accuracy of the minimally-partial-SVR combination is the highest, followed by the FIX+GSR-partial-SVR combination and the FIX-partial-SVR combination. The FIX-pearson-EN and FIX+GSR-Pearson-EN combinations achieved the highest average accuracy in nRMSD. More detailed method comparisons, including statistical test results, can be found in the supplementary materials. Overall, machine learning-based denoising (FIX) and a parcel granularity of 300 lead to optimal combinations. After performing FIX or FIX+GSR denoising, similar predictive performance can be achieved using any connectivity computation method or regression method (except for MLR, which performed poorly).

Figure 3 Average predictive accuracy of 40 psychometric variables for each method combination in whole-brain CBPP (Pearson correlation between predicted and observed values).
Figures 4-7 show the psychometric spectra of pairs of surface parcels corresponding to the primary visual cortex, premotor cortex, supramarginal gyrus, and Broca’s area. Overall, the selected parcels displayed similar psychological characteristics across different hemispheres, but different features were shown at different parcel locations. In whole-brain CBPP, psychometric variables describing general cognitive ability were often relatively well predicted across different method combinations, and were also relatively well predicted in parcel-based CBPP. For example, across all four selected parcels, the total cognitive composite score was the fourth best predicted on average among method combinations, and one of the best-predicted variables.
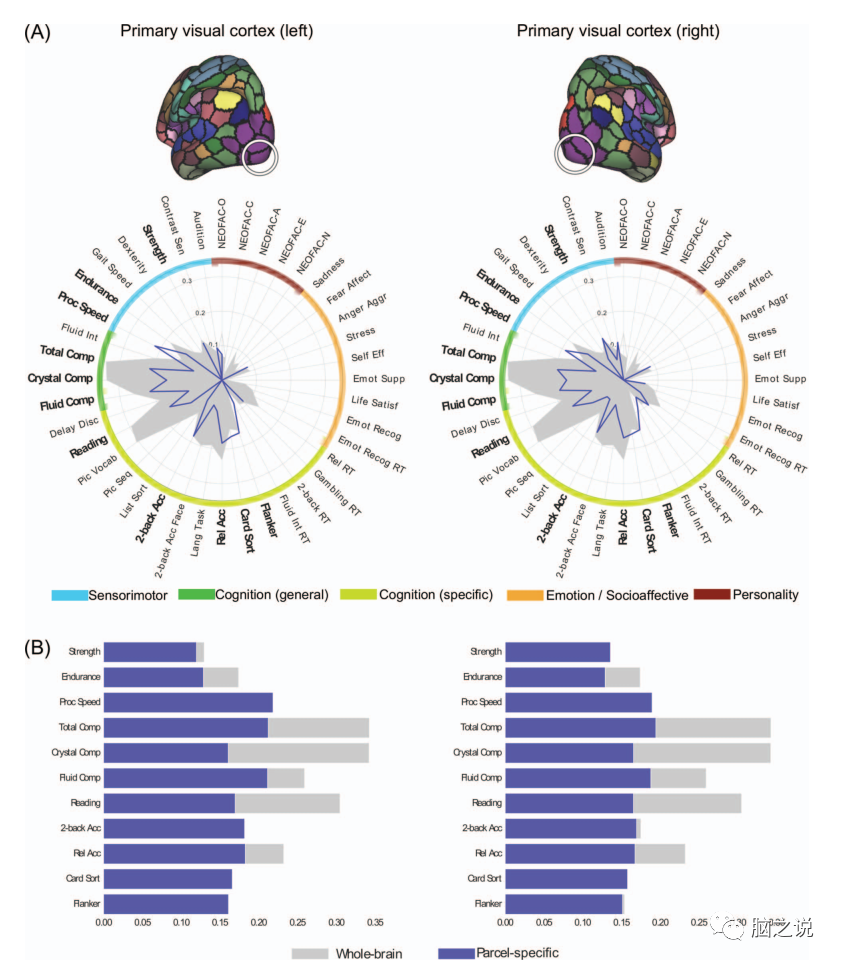
Figure 4 (A) Psychometric profiles for pairs of parcels in the primary visual cortex of the left and right hemispheres based on the FIX-Pearson-SVR combination at a 300 parcel granularity, based on Pearson correlation accuracy. Psychometric variables with significant nRMSD accuracy are highlighted in bold. The gray-filled profile shows the whole-brain predictive profile, while the blue profile shows the local predictive profile. (B) Comparison of parcel specificity (blue) and whole-brain accuracy (gray) for psychometric variables that are significant for both Pearson and nRMSD accuracy.
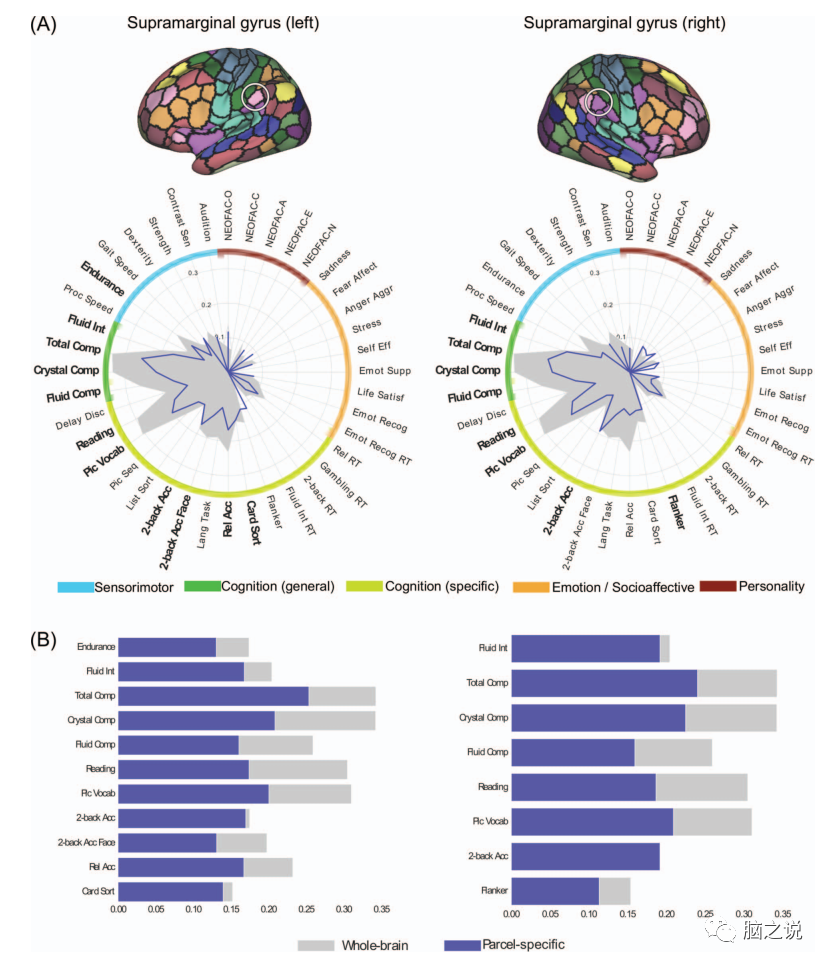

Figure 6 (A) Psychometric spectra for pairs of parcels in the supramarginal gyrus of the left and right hemispheres based on the FIX-Pearson-SVR combination at a 300 parcel granularity, based on Pearson correlation accuracy. (B) Comparison of parcel specificity (blue) and whole-brain accuracy (gray) for psychometric variables that are significant for both Pearson and nRMSD accuracy.
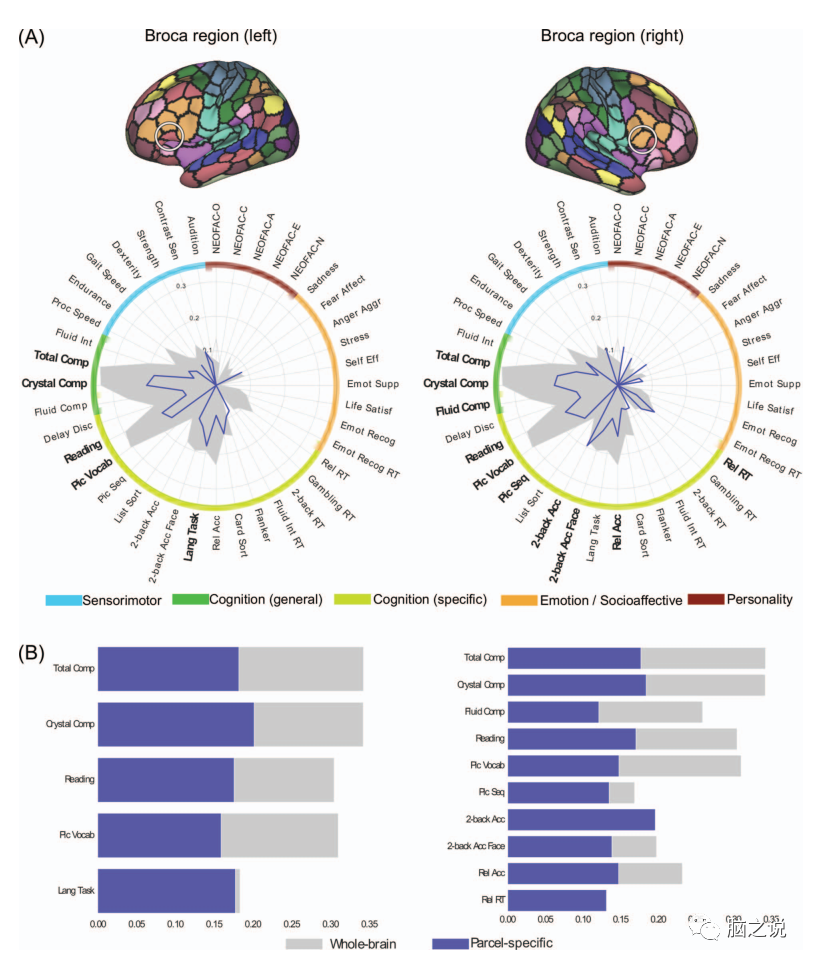
Figure 7 (A) Psychometric spectra for pairs of parcels in Broca’s area based on the FIX-Pearson-SVR combination at a 300 parcel granularity, based on Pearson correlation accuracy. (B) Comparison of parcel specificity (blue) and whole-brain accuracy (gray) for psychometric variables that are significant for both Pearson and nRMSD accuracy.
We note that two predictive performance metrics, Pearson correlation and inverse nRMSD, converge in highlighting similar variables. However, differences can also be observed, as nRMSD measures appear to be much stricter than correlation measures. Therefore, we suggest focusing on patterns where span measures converge, as these patterns may be more reliable than any patterns produced by individual predictive performance metrics.
When analyzing the psychometric characteristics of brain regions, we primarily focus on the relative comparison of predictive accuracy for each parcel among different psychometric variables. Figure 8 displays the psychometric characteristics of a pair of parcels in the anterior hippocampus. Across the whole brain hemisphere, the two parcels exhibit similar psychological characteristics.
Figures 4-8 show comparisons of parcel specificity and whole-brain predictive accuracy for psychometric variables that show statistical significance for both Pearson correlation and nRMSD measures.
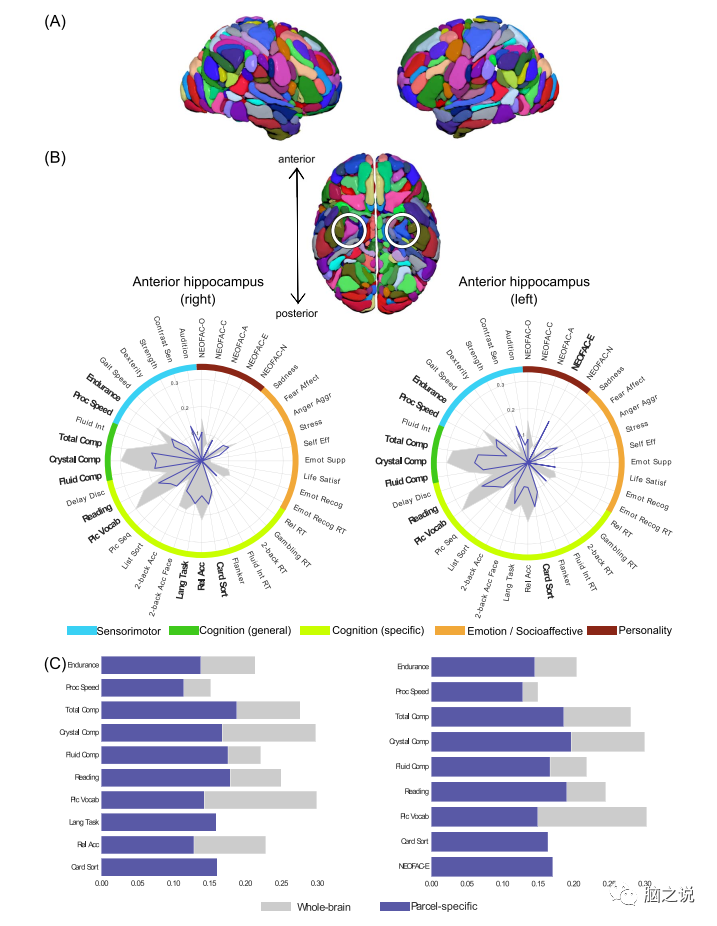
Figure 8 (A) AICHA atlas. (B) Psychometric spectra for pairs of parcels in the right (pink) and left (blue) hemispheres of the anterior hippocampus based on the FIX+WM/CSF-Pearson-SVR combination, based on Pearson correlation accuracy. (C) Comparison of parcel specificity (blue) and whole-brain accuracy (gray) for psychometric variables that are significant for both Pearson and nRMSD accuracy.
3.3 Distribution of Predictive Accuracy for Psychometric Variables
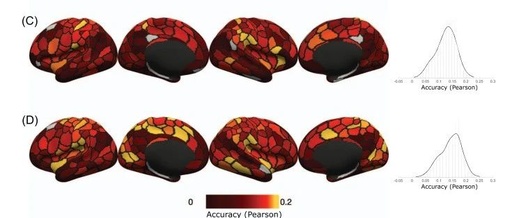
From the perspective of psychometric variables, we present the distribution of predictive accuracy across parcels. Figures 9A-D show the predictive accuracy distributions and histograms for four selected psychometric variables using the FIX-Pearson-SVR combination at a 300 parcel granularity based on Pearson correlation accuracy. Supplementary Figure S5 displays the predictive accuracy and histograms for the same variables and combinations based on nRMSD accuracy. In the brain, the accuracy of predictive strength is generally low.
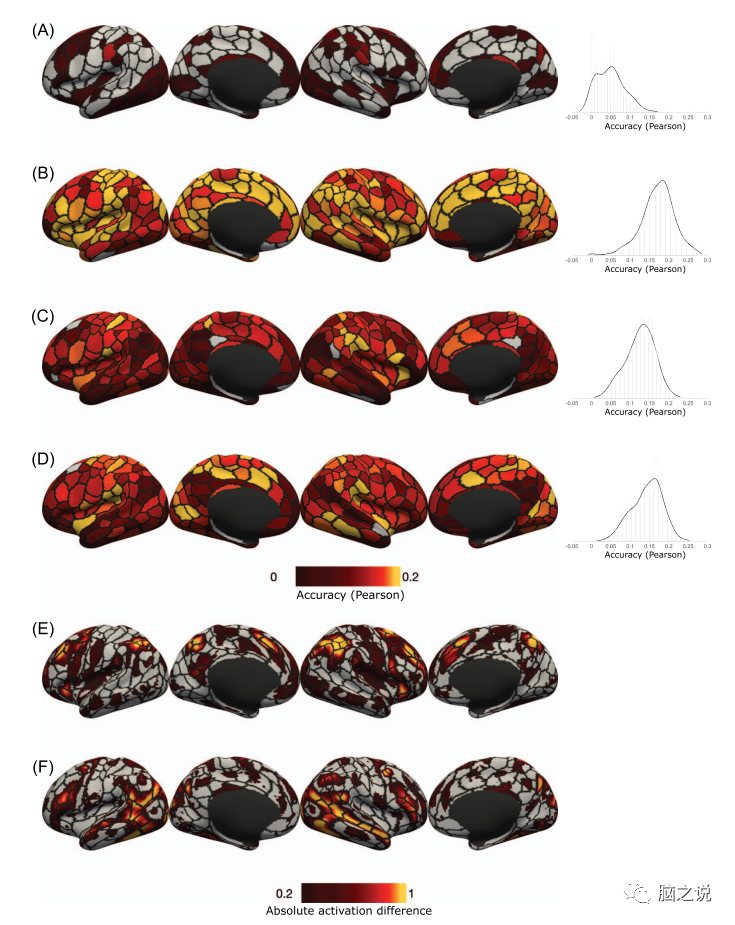
Figure 9 Top: Predictive accuracy distributions for the selected four psychometric variables using the FIX-Pearson-SVR combination at a 300 parcel granularity: (A) strength, (B) crystal cognitive composite score (Crystalline Comp), (C) overall accuracy of working memory task (2-back Acc), (D) accuracy of face condition in working memory task (2-back Acc face). Bottom: (E) Absolute values of HCP group activation maps for working memory tasks (2-back 0-back) and (F) social tasks (theory of mind random) covering the Schaefer atlas at a 300 parcel granularity.
3.4 Distribution of Predictive Accuracy and Regression Weights
Figures 10A-D show the absolute mean values of regression weights per parcel for four selected psychometric variables during cross-validation (top row). As shown in Figure 10, the average regression weight for a parcel is at most 0.04 (for a whole-brain predictive model that can only explain 1-10% of the variance in psychometric variables). Therefore, it is unreasonable to claim that any parcel is found to have a significant relationship with the predicted psychometric variable.
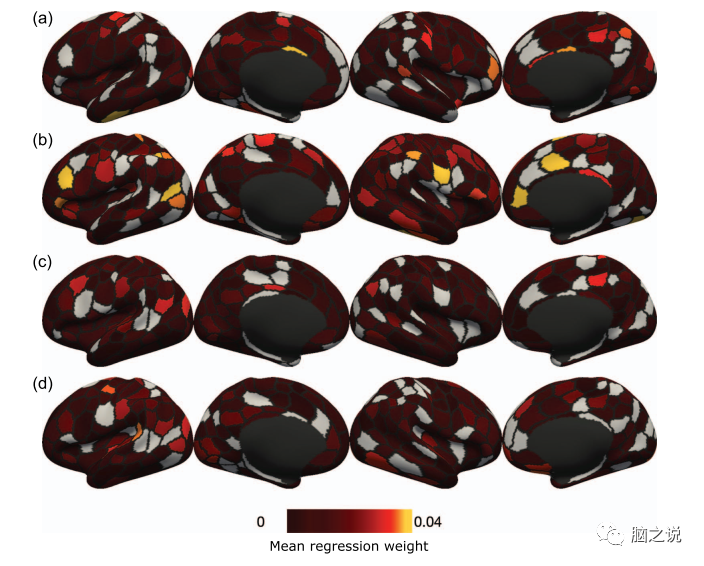
Figure 10 Evaluation of parcel relevance using regression weights at a 300 parcel granularity, using the FIX-Pearson-SVR combination.
3.5 Denoising Effects
Figure 11 shows the distribution and histogram of predictive accuracy for four selected psychometric variables in the brain by parcel, using the minimally-Pearson-SVR combination at a 300 parcel granularity based on Pearson correlation accuracy.
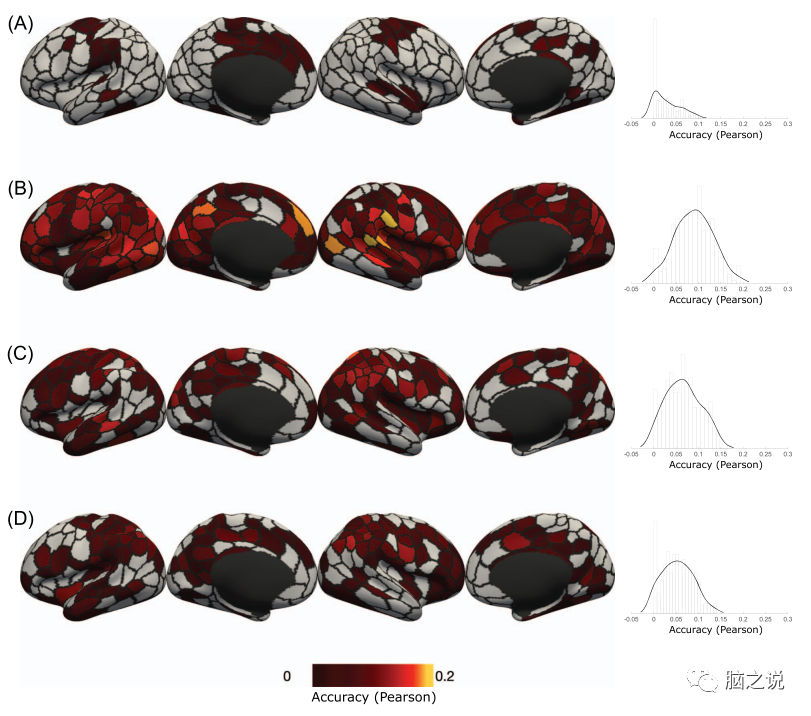
Figure 11 Predictive accuracy distribution of the minimally-Pearson-SVR combination at a 300 parcel granularity.
3.6 Confounding Effects
Figure 12 shows the confounding and non-confounding predictive results for pairs of parcels in the supramarginal gyrus and Broca’s area, respectively.
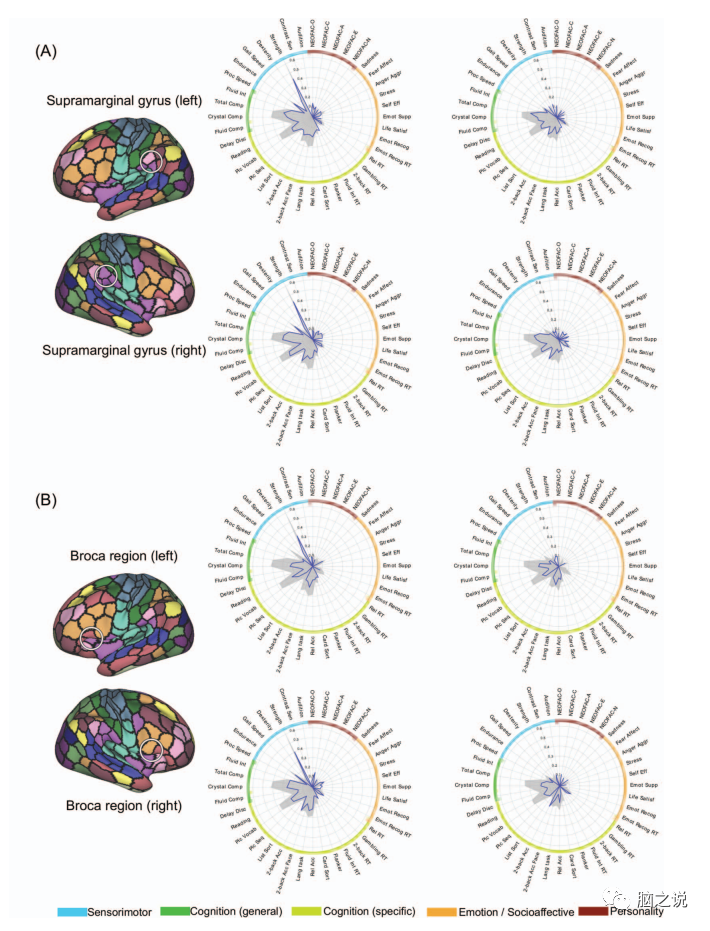
Figure 12 (A) Supramarginal gyrus and (B) psychological measurement characteristics of parcel pairs in the left and right Broca’s area.
To construct the optimal framework for connectivity-based psychometric predictive variables (CBPP) in cognitive neuroscience, we first evaluated the effects of different methods and parameters used in previous whole-brain or network-based approaches. In summary, our results demonstrate the relevance of complex denoising methods for resting-state functional magnetic resonance data, as well as the good performance of standard regression-based predictive algorithms. Utilizing this preliminary investigation, we demonstrate the effectiveness of our regional CBPP approach from the psychometric profiles of individual brain regions and the distribution of predictive accuracy for individual psychometric variables.
Our findings highlight the benefits of complex machine learning-based denoising (here FIX denoising) not only at the quantitative level of predictive performance but also at the qualitative level of studying brain-behavior relationships.
Our qualitative examination of the psychometric prediction profiles for each parcel generally aligns with our expectations based on the literature of brain mapping.
Finally, by using high-quality data that includes a wide range of psychometric methods in a healthy adult cohort, we developed a region connectivity-based psychometric prediction framework that connects resting-state FC of brain regions with behavior based on supervised learning methods. To facilitate the application of our specific regional approach in cognitive neuroscience research, we demonstrate two main applications: 1) psychometric profiles of brain regions and 2) brain maps of predictive accuracy distribution for specific psychometric variables. Materials for implementing our method are publicly available at https://github.com/inm7/cbpp. To illustrate the potential contributions of our region-based approach based on increased transparency, we elucidate how complex denoising can provide a clear image of the associations between brain and behavior. We also illustrate the false influences of confounding factors such as brain size on predictive models. Future work should investigate the potential benefits of personalized parceling. The developed framework also aids in a better understanding of the relationship between brain region connectivity and behavioral phenotypes in older adults and clinical populations. In this context, the portability of our framework should be explored in future studies.
EEG Training Courses
7th EEG and Machine Learning Practical Class (Python Version, Online Class, 2022.7.23-26)
22nd EEG Data Analysis Technology Practical Class (Online Live, 2022.8.10-14)
MRI Training Courses
6th Multimodal Magnetic Resonance Brain Network Analysis Technology Practical Class (Online Live, 2022.6.25-28)
3rd Brain Imaging Machine Learning Practical Class (Online Live, 2022.7.16-19)
11th Basic Class for Magnetic Resonance Data Analysis Technology (Online Live, 2022.8.15-18)
7th Multimodal Magnetic Resonance Brain Network Analysis Technology Practical Class (Online Live, 2022.8.25-28)
1st Task-Based fMRI Data Analysis Technology Practical Class (Online Live, 2022.8.18-25, Limited Spots Available)
fNIRS Training Courses
2nd Near-Infrared Brain Function Imaging Data Analysis Practical Class (Online Class, 2022.7.8-12)
EEG/MRI/fNIRS Data Processing
Top Journal New Method Reproduction Services – Edge-Centric Brain Network Model
Top Journal New Method Reproduction Services – Brain Temporal Scale Gradient
Staying True to Our Original Intention, Yueying Technology Helps Clients Publish High-Level SCI Papers One
Staying True to Our Original Intention, Yueying Technology Helps Clients Publish High-Level SCI Papers Two
Staying True to Our Original Intention, Yueying Technology Helps Clients Publish High-Level SCI Papers Three
Equipment Sales/Rental
Smarting: The First Truly Portable EEG Device
MRI and EEG Equipment Sharing Services