Source: Deephub Imba
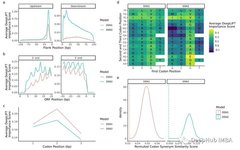
Feature importance analysis is used to understand the usefulness or value of each feature (variable or input) in making predictions. The goal is to identify the most important features that have the greatest impact on model output, which is a frequently used method in machine learning.
Why Is Feature Importance Analysis Important?
If there is a dataset containing dozens or even hundreds of features, each feature may contribute to the performance of your machine learning model. However, not all features are the same. Some may be redundant or irrelevant, which increases the complexity of modeling and can lead tooverfitting. Feature importance analysis can identify and focus on the most informative features, bringing several advantages:
- Improved model performance
- Reduced overfitting
- Faster training and inference
- Enhanced interpretability
Below, we delve into some methods for feature importance analysis in Python.
Methods for Feature Importance Analysis
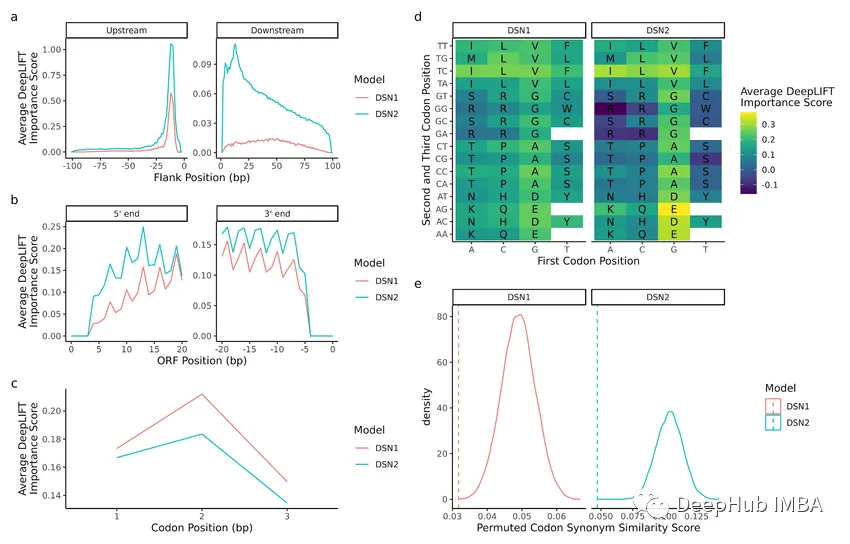
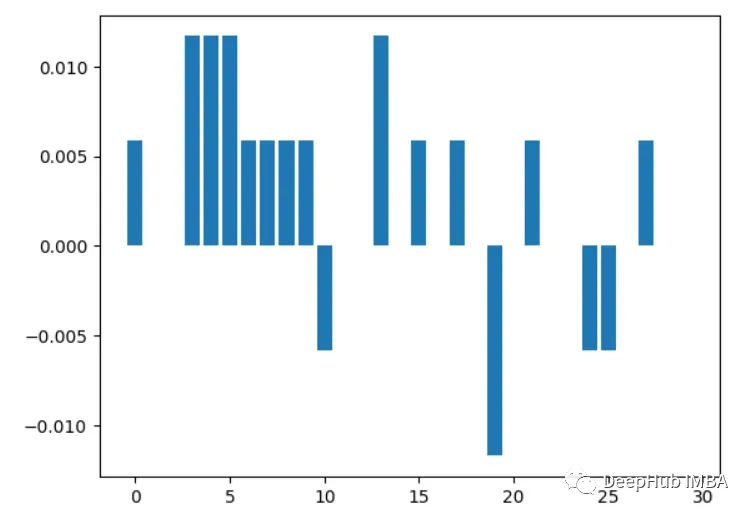
1. Permutation ImportanceThis method randomly permutes the values of each feature and monitors the degree of performance drop in the model. A larger drop indicates that the feature is more important.
from sklearn.datasets import load_breast_cancer
from sklearn.ensemble import RandomForestClassifier
from sklearn.inspection import permutation_importance
from sklearn.model_selection import train_test_split
import matplotlib.pyplot as plt

cancer = load_breast_cancer()
X_train, X_test, y_train, y_test = train_test_split(cancer.data, cancer.target, random_state=1)
rf = RandomForestClassifier(n_estimators=100, random_state=1)
rf.fit(X_train, y_train)
baseline = rf.score(X_test, y_test)
result = permutation_importance(rf, X_test, y_test, n_repeats=10, random_state=1, scoring='accuracy')
importances = result.importances_mean

# Visualize permutation importances
plt.bar(range(len(importances)), importances)
plt.xlabel('Feature Index')
plt.ylabel('Permutation Importance')
plt.show()
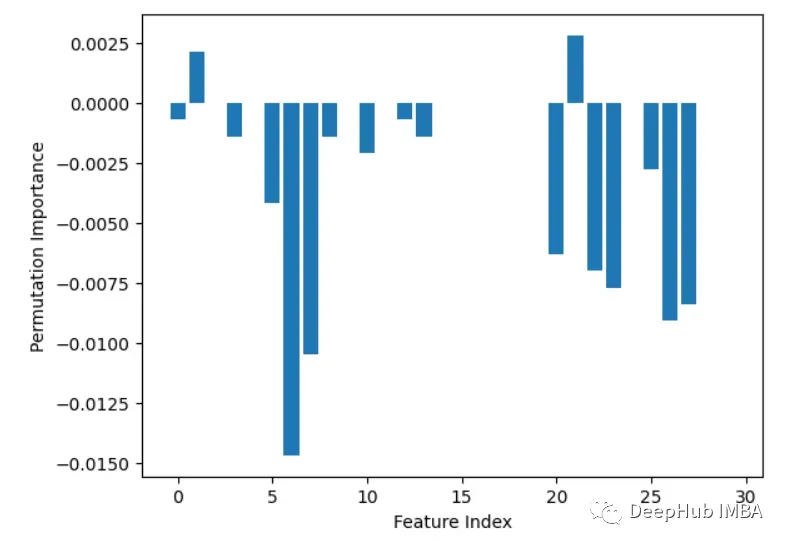 2. Built-in Feature Importance (coef_ or feature_importances_)Some models, such aslinear regression and random forests, can directly output feature importance scores. These show the contribution of each feature to the final prediction.
from sklearn.datasets import load_breast_cancer
from sklearn.ensemble import RandomForestClassifier

X, y = load_breast_cancer(return_X_y=True)
rf = RandomForestClassifier(n_estimators=100, random_state=1)
rf.fit(X, y)
importances = rf.feature_importances_

# Plot importances
plt.bar(range(X.shape[1]), importances)
plt.xlabel('Feature Index')
plt.ylabel('Feature Importance')
plt.show()
 3. Leave-One-OutIteratively remove one feature at a time and evaluate accuracy.
from sklearn.datasets import load_breast_cancer
from sklearn.model_selection import train_test_split
from sklearn.ensemble import RandomForestClassifier
from sklearn.metrics import accuracy_score
import matplotlib.pyplot as plt
import numpy as np

# Load sample data
X, y = load_breast_cancer(return_X_y=True)

# Split data into train and test sets
X_train, X_test, y_train, y_test = train_test_split(X, y, test_size=0.3, random_state=1)

# Train a random forest model
rf = RandomForestClassifier(n_estimators=100, random_state=1)
rf.fit(X_train, y_train)

# Get baseline accuracy on test data
base_acc = accuracy_score(y_test, rf.predict(X_test))

# Initialize empty list to store importances
importances = []

# Iterate over all columns and remove one at a time
for i in range(X_train.shape[1]):
    X_temp = np.delete(X_train, i, axis=1)
    rf.fit(X_temp, y_train)
    acc = accuracy_score(y_test, rf.predict(np.delete(X_test, i, axis=1)))
    importances.append(base_acc - acc)

# Plot importance scores
plt.bar(range(len(importances)), importances)
plt.show()
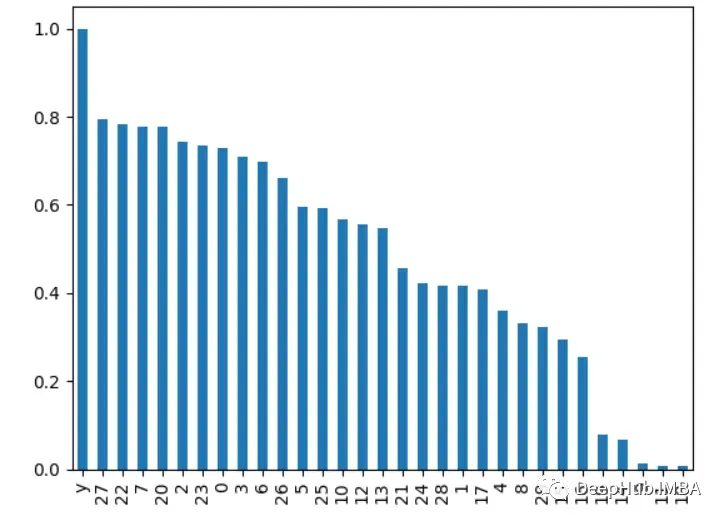
 4. Correlation AnalysisCalculate the correlation between each feature and the target variable. Features with higher correlation are more important.
import pandas as pd
from sklearn.datasets import load_breast_cancer

X, y = load_breast_cancer(return_X_y=True)
df = pd.DataFrame(X, columns=range(30))
df['y'] = y
correlations = df.corrwith(df.y).abs()
correlations.sort_values(ascending=False, inplace=True)
correlations.plot.bar()
5. Recursive Feature EliminationRecursively remove features and see how it affects model performance. Features that lead to a larger drop when removed are more important.
from sklearn.ensemble import RandomForestClassifier
from sklearn.feature_selection import RFE
import pandas as pd
from sklearn.datasets import load_breast_cancer
import matplotlib.pyplot as plt

X, y = load_breast_cancer(return_X_y=True)
df = pd.DataFrame(X, columns=range(30))
df['y'] = y
rf = RandomForestClassifier()
rfe = RFE(rf, n_features_to_select=10)
rfe.fit(X, y)
print(rfe.ranking_)  # Output is [6 4 11 12 7 11 18 21 8 16 10 3 15 14 19 17 20 13 11 11 12 9 11 5 11]
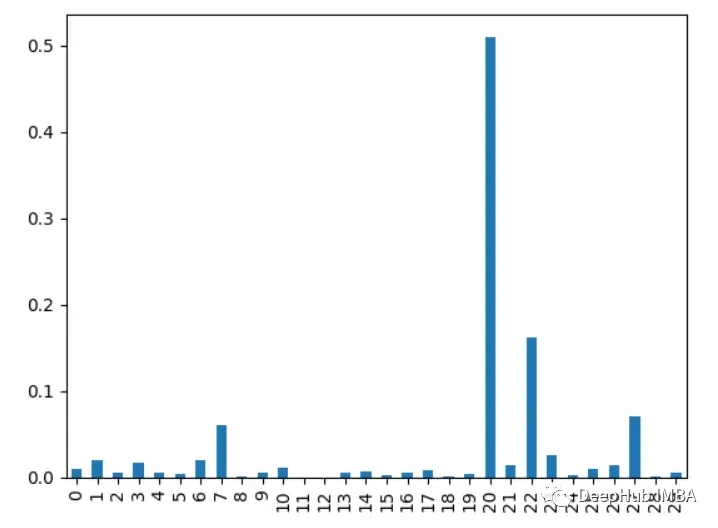
6. XGBoost Feature ImportanceCalculate how many times a feature is used to split data across all trees. More splits mean more importance.
import xgboost as xgb
import pandas as pd
from sklearn.datasets import load_breast_cancer
import matplotlib.pyplot as plt

X, y = load_breast_cancer(return_X_y=True)
df = pd.DataFrame(X, columns=range(30))
df['y'] = y
model = xgb.XGBClassifier()
model.fit(X, y)
importances = model.feature_importances_
importances = pd.Series(importances, index=range(X.shape[1]))
importances.plot.bar()
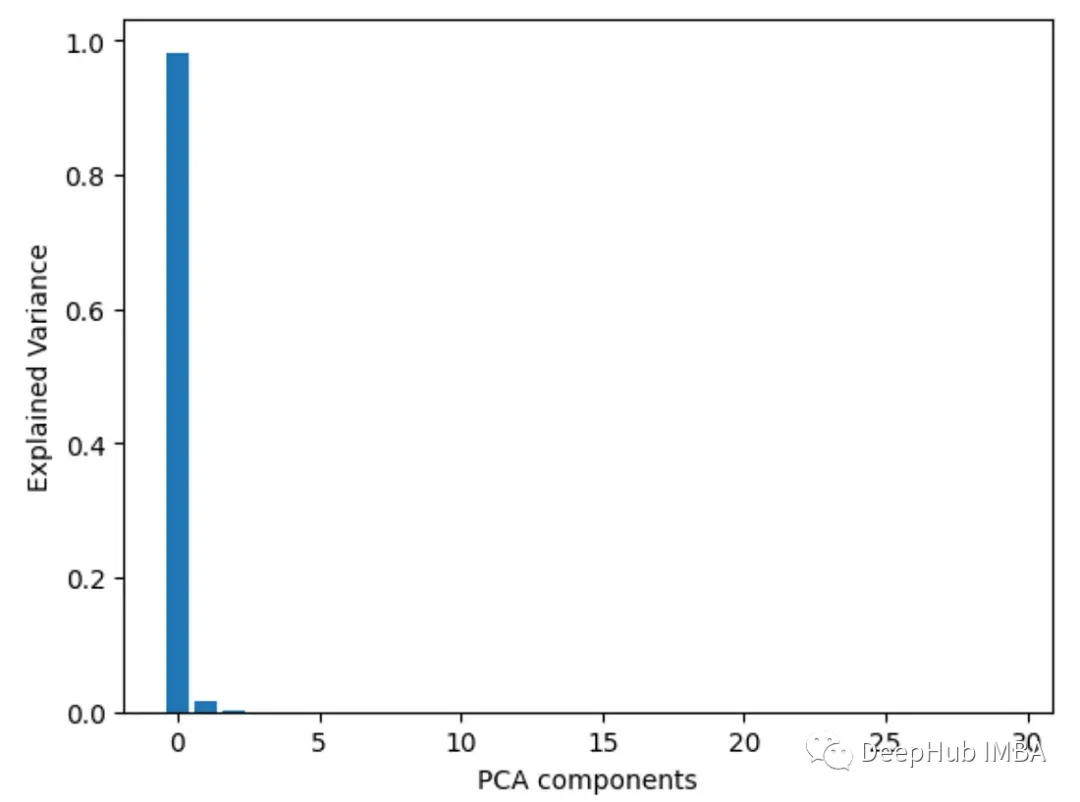
 7. Principal Component Analysis (PCA)Perform principal component analysis on the features and view the explained variance ratio of each principal component. Features with higher loadings on the first few components are more important.
from sklearn.decomposition import PCA
import pandas as pd
from sklearn.datasets import load_breast_cancer
import matplotlib.pyplot as plt

X, y = load_breast_cancer(return_X_y=True)
df = pd.DataFrame(X, columns=range(30))
df['y'] = y
pca = PCA()
pca.fit(X)
plt.bar(range(pca.n_components_), pca.explained_variance_ratio_)
plt.xlabel('PCA components')
plt.ylabel('Explained Variance')
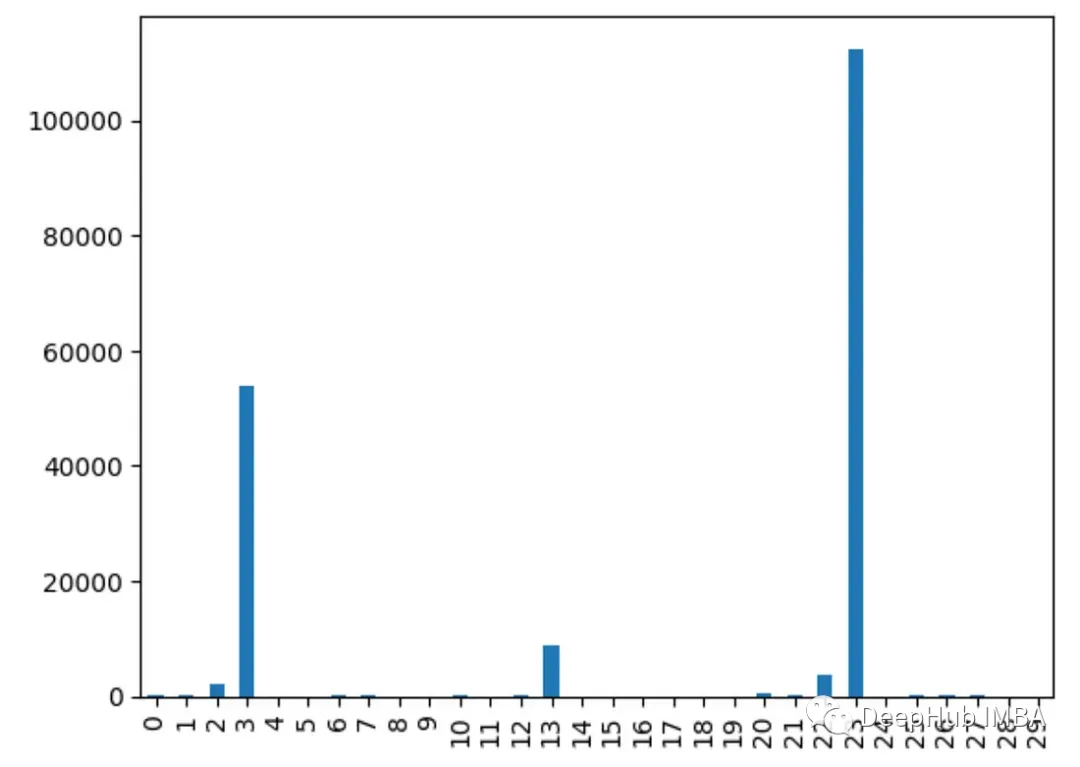
 8. Analysis of Variance (ANOVA)Use f_classif() to obtain the ANOVA f-values for each feature. A higher f-value indicates a stronger correlation between the feature and the target.
from sklearn.feature_selection import f_classif
import pandas as pd
from sklearn.datasets import load_breast_cancer
import matplotlib.pyplot as plt

X, y = load_breast_cancer(return_X_y=True)
df = pd.DataFrame(X, columns=range(30))
df['y'] = y
fval = f_classif(X, y)
fval = pd.Series(fval[0], index=range(X.shape[1]))
fval.plot.bar()
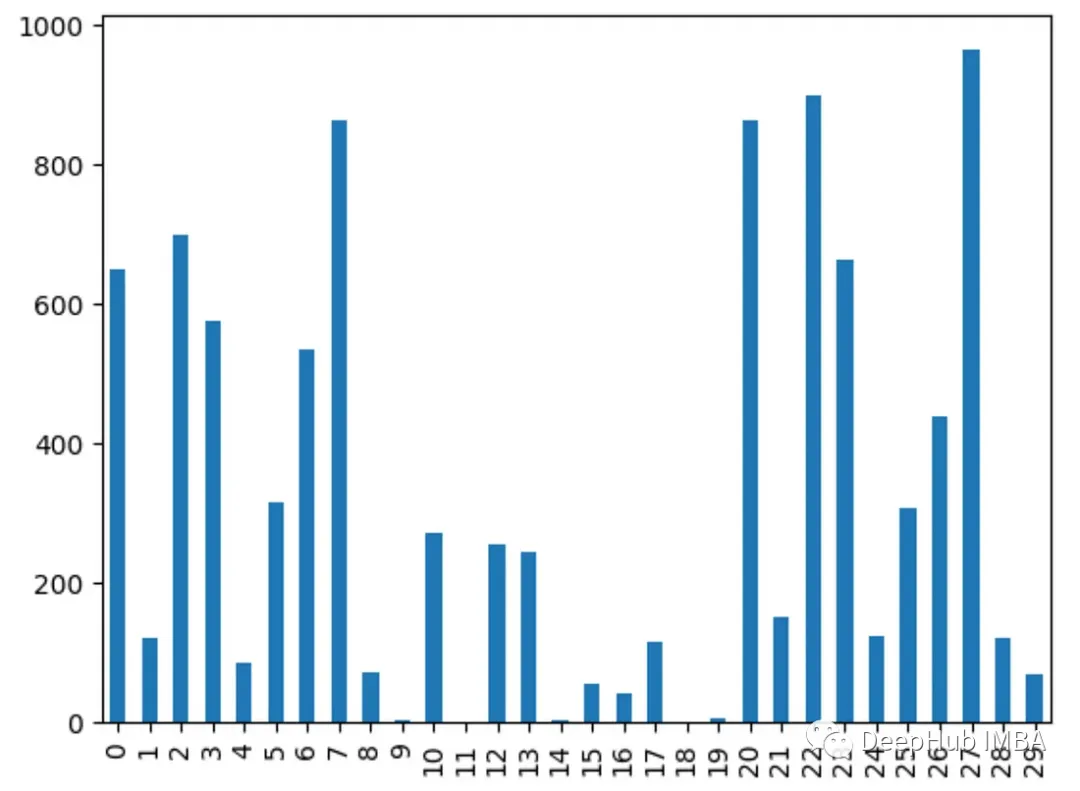 9. Chi-Squared TestUse chi2() to obtain the chi-squared statistics for each feature. Features with higher scores are more likely to be independent of the target.
from sklearn.feature_selection import chi2
import pandas as pd
from sklearn.datasets import load_breast_cancer
import matplotlib.pyplot as plt

X, y = load_breast_cancer(return_X_y=True)
df = pd.DataFrame(X, columns=range(30))
df['y'] = y
chi_scores = chi2(X, y)
chi_scores = pd.Series(chi_scores[0], index=range(X.shape[1]))
chi_scores.plot.bar()
Why Do Different Methods Detect Different Features?
Different feature importance methods can sometimes identify different features as the most important because:1. They measure importance in different ways: Some use different features for prediction and monitor accuracy drops. Methods like XGBOOST or regression models use built-in importance for feature ranking. PCA focuses on variance explanation.2. Different models have different methodologies: Linear models tend to favor linear relationships, while tree models tend to favor features closer to the root.3. Interactions: Some methods can capture interactions between features, while others cannot, leading to differences in results.4. Instability: Using different subsets of data, the importance values may differ across different runs of the same method due to data variations.5. Hyperparameters: Adjusting hyperparameters, such as PCA components or tree depth, also affects results. Therefore, different assumptions, biases, data processing, and method variability mean they do not always agree on the most important features.
Best Practices for Choosing Feature Importance Analysis Methods
- Try multiple methods for a more robust view;
- Aggregate results using ensemble methods;
- Focus more on relative order rather than absolute values;
- Differences do not necessarily indicate problems; examining the reasons for differences can provide deeper insights into the data and model.
Editor / Fan Ruiqiang
Reviewer / Fan Ruiqiang
Verification / Fan Ruiqiang
Click below
Follow us