
We have scaled our Kubernetes cluster to 7500 nodes, creating a scalable infrastructure for large models like GPT-3, CLIP, and DALL·E, while also creating a scalable infrastructure for rapid small-scale iterative research, such as the scaling laws of neural language models.
Scaling a single Kubernetes cluster to this size is rare, but the benefit is the ability to provide a simple infrastructure that allows our machine learning research teams to advance and scale faster without changing code.
Since our last post about scaling to 2500 nodes, we have continued to expand our infrastructure to meet researchers’ needs, learning many lessons along the way. This article summarizes these lessons so that others in the Kubernetes community can benefit from them, and finally we will introduce the issues we still face and will continue to address.
Before delving deeper, we should describe our workloads. The applications and hardware we run on Kubernetes may be quite different from what you encounter in a typical company. Therefore, our problems and solutions may or may not match your own setup!
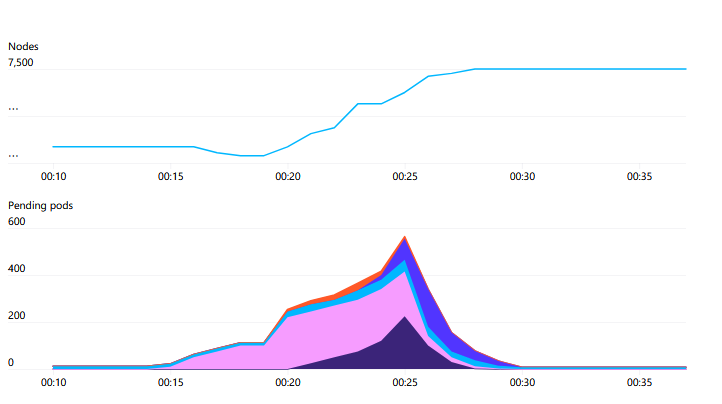
A large machine learning job spans many nodes, and it runs most efficiently when it can access all hardware resources on each node. This allows GPUs to communicate cross-node directly via NVLink or for GPUs to communicate directly with NICs using GPUDirect. Thus, for many of our workloads, a single Pod occupies an entire node. There are no scheduling factors for NUMA, CPU, or PCIE resource contention. Packing or fragmentation is not a common concern. Our current cluster has full bipartite bandwidth, so we do not consider rack or network topology. All of this means that, while we have many nodes, the load on the scheduler is relatively low.
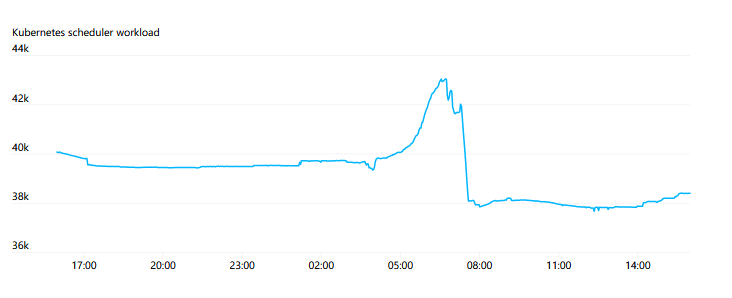
That said, the load on the kube-scheduler does fluctuate. A new job may consist of hundreds of Pods being created simultaneously, then return to a relatively low churn rate.
Our largest jobs run MPI, where all Pods in the job participate in a single MPI communicator. If any participating Pod fails, the entire job stops and needs to be restarted. Jobs are regularly checkpointed, and upon restart, they recover from the last checkpoint. Therefore, we consider Pods to be semi-stateful—deleted Pods can be replaced and work can continue, but doing so causes disruption and should be minimized.
We do not rely heavily on Kubernetes’s load balancing. Our HTTPS traffic is minimal, and we do not need to perform A/B testing, blue/green, or canary deployments. Pods communicate directly with MPI via Pod IP addresses using SSH, rather than through service endpoints. Service discovery is limited; we only perform a lookup once at job startup to find which Pods participate in MPI.
Most jobs interact with some form of Blob storage. They often stream shards or checkpoints of some datasets directly from Blob storage or cache them onto fast local temporary disks. We have some PersistentVolumes for cases that require POSIX semantics, but Blob storage is more scalable and does not require slow detach/attach operations.
Lastly, the nature of our work is essentially research, meaning the workloads themselves are constantly changing. While the supercomputing team strives to provide a computing infrastructure that we believe meets a ‘production’ quality level, the applications running on that cluster have short lifespans and their developers iterate quickly. Therefore, new usage patterns may emerge at any time that challenge our assumptions about trends and appropriate trade-offs. We need a sustainable system that allows us to respond quickly when things change.
As the number of nodes and Pods within the cluster increases, we found that Flannel struggled to meet the required throughput. Therefore, we turned to the native Pod networking technology and related CNI plugins from Azure VMSS to configure IPs. This allows our Pods to achieve host-level network throughput.
Another reason we turned to alias IP addresses is that in our largest cluster, approximately 200,000 IP addresses may be used simultaneously. After testing a routing-based Pod network, we found that the number of routes available was significantly limited.
Avoiding encapsulation increases the demand on the underlying SDN or routing engine, though this simplifies our network setup. Adding a VPN or tunnel can be done without requiring any additional adapters. We do not need to worry about packet fragmentation due to a portion of the network having a lower MTU. Network policies and traffic monitoring are straightforward; there is no ambiguity about packet sources and destinations.
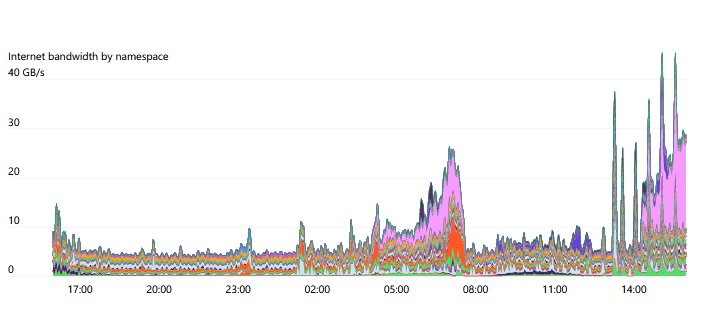
We use iptables marking on the host to track network resource usage for each Namespace and Pod, allowing researchers to visualize their network usage patterns. In particular, since many of our experiments have different Internet and Pod-to-Pod communication patterns, being able to investigate where any bottlenecks occur is often very meaningful.
iptables mangle rules can be used to mark packets that meet specific conditions. Here are the rules we use to detect whether traffic is internal or Internet traffic. The FORWARD rules cover traffic from Pods, while INPUT and OUTPUT rules cover traffic on the host:
iptables -t mangle -A INPUT ! -s 10.0.0.0/8 -m comment --comment "iptables-exporter openai traffic=internet-in"iptables -t mangle -A FORWARD ! -s 10.0.0.0/8 -m comment --comment "iptables-exporter openai traffic=internet-in"iptables -t mangle -A OUTPUT ! -d 10.0.0.0/8 -m comment --comment "iptables-exporter openai traffic=internet-out"iptables -t mangle -A FORWARD ! -d 10.0.0.0/8 -m comment --comment "iptables-exporter openai traffic=internet-out"Once marked, iptables will begin counting to track the number of bytes and packets matching that rule. You can use iptables itself to view these counters:
% iptables -t mangle -L -vChain FORWARD (policy ACCEPT 50M packets, 334G bytes) pkts bytes target prot opt in out source destination....1253K 555M all -- any any anywhere !10.0.0.0/8 /* iptables-exporter openai traffic=internet-out */1161K 7937M all -- any any !10.0.0.0/8 anywhere /* iptables-exporter openai traffic=internet-in */We use an open-source Prometheus exporter called iptables-exporter to track this data in our monitoring system. This is a simple way to track packets that match various different types of conditions.

One unique aspect of our network model is that we fully expose the node, Pod, and Service network CIDR ranges to researchers. We adopt a hub-and-spoke network model and route that traffic using the native node and Pod CIDR ranges. Researchers connect to the central hub and can access any individual cluster (spoke). However, these clusters themselves cannot communicate with each other. This ensures that the clusters remain isolated, with no cross-cluster dependencies, preventing fault propagation in fault isolation.
We use a “NAT” host to translate traffic from the service network CIDR range coming in from outside the cluster. This setup provides our researchers with a lot of flexibility to experiment with various different types of network configurations.
The Kubernetes API Server and etcd are key components for keeping the cluster healthy, so we pay special attention to the pressure on these systems. We use Grafana dashboards provided by kube-prometheus along with additional internal dashboards. We find it useful to alert on the rate of HTTP status codes 429 (Too Many Requests) and 5xx (Server Errors) as high-level signals.
While some run the API servers inside kube, we have always run them outside the cluster. Both etcd and API servers run on their own dedicated nodes. Our largest cluster runs 5 API servers and 5 etcd nodes to distribute the load and minimize the impact of failures as much as possible. Since we mentioned splitting Kubernetes events into their own etcd cluster in our last blog post, we have not encountered any notable issues with etcd. The API servers are stateless and typically easy to run in self-healing instance groups or autoscaling sets. We have not yet tried to automate the construction of any self-healing etcd clusters, as incidents are very rare.
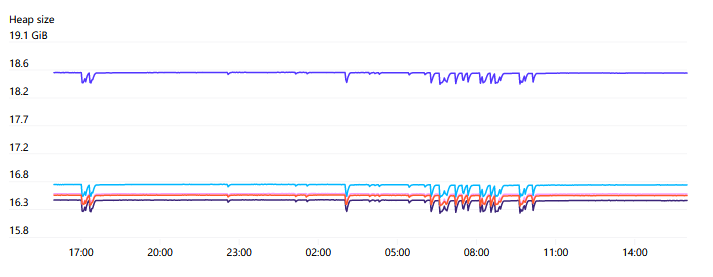
API servers can consume quite a bit of memory and tend to scale linearly with the number of nodes in the cluster. For our cluster with 7500 nodes, we observe each API server using up to 70GB of heap memory, so fortunately this should still be within hardware capabilities for the future.
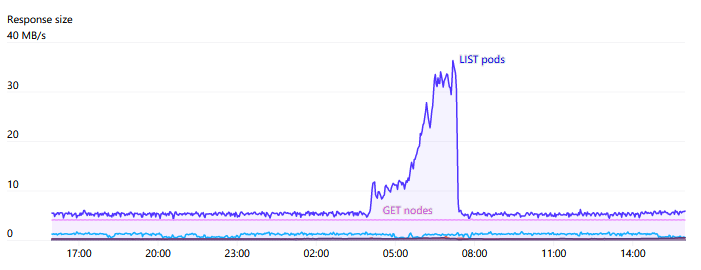
One of the main sources of pressure on API servers is the WATCH on Endpoints. There are some services across the cluster, such as “kubelet” and “node-exporter”, where each node is a member. When a node is added or removed from the cluster, this WATCH is triggered. Typically, since each node itself monitors the kubelet service via kube-proxy, the number of responses required and the bandwidth for these can be very large, sometimes reaching 1GB/s or more. The EndpointSlices introduced in Kubernetes 1.17 greatly reduced this load by a factor of 1000.
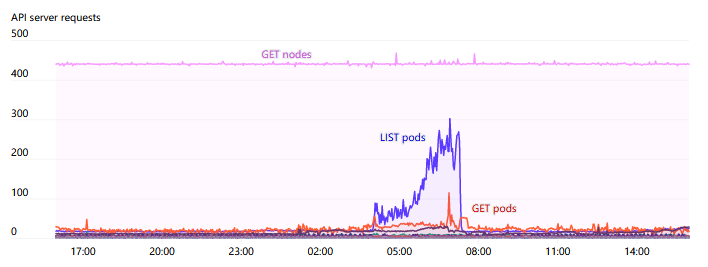
Overall, we pay very close attention to the increased API Server requests as the cluster scales. We try to avoid any DaemonSets interacting with the API Server. In cases where each node needs to monitor changes, introducing a caching service (like the Datadog Cluster Agent) as an intermediary seems to be a good pattern to avoid cluster-wide bottlenecks.
As the cluster grows, we find that we are doing less actual autoscaling of the cluster. However, we occasionally encounter issues when too many nodes are auto-scaled at once. When new nodes join the cluster, it generates a large number of requests, and adding hundreds of nodes at once can exceed the load capacity of the API servers. Smoothing this process out, even by just a few seconds, helps avoid outages.
We use Prometheus to collect time series metrics and Grafana for graphs, dashboards, and alerts. We started collecting a wide variety of metrics from the kube-prometheus deployment and used some good dashboards for visualization. As the number of nodes continues to increase, we began to encounter issues with the sheer volume of metrics collected by Prometheus. Although kube-prometheus exposes many useful metrics, we do not actually look at all the metrics, and some data is too granular to be effectively collected, stored, and queried. Therefore, we use Prometheus rules to “delete” some data from the ingested metrics.
For a while, we encountered increasing memory consumption issues with Prometheus, which ultimately led to container crashes and Out-Of-Memory errors (OOM). Even when a large memory capacity is allocated to the application, this situation seems to occur. Worse yet, when it crashes, it spends a lot of time replaying the write-ahead log files at startup until it is available again. Eventually, we discovered that the source of these OOMs was the interaction between Grafana and Prometheus, where Grafana queries the /api/v1/series API with {le!=""} (basically, “give me all histogram metrics”). The implementation of /api/v1/series has no limits in time or space, and for queries with a large number of results, this will continuously consume more memory and time. Even if the requester has given up and closed the connection, it will continue to grow. For us, memory is never enough, and Prometheus eventually crashes. Therefore, we patched Prometheus to include this API in context to enforce timeouts, which completely resolved the issue.
While the number of crashes of Prometheus has been significantly reduced, WAL replay is still an issue when we need to restart it. It typically takes several hours to replay all WAL logs until Prometheus starts collecting new metrics and serving again. With the help of Robust Perception, we found that applying GOMAXPROCS=24 to the server can significantly improve performance. During WAL replay, Prometheus attempts to use all cores, and for servers with many cores, contention can degrade overall performance.
We are exploring new options to increase our monitoring capabilities, which will be described in the “Unresolved Issues” section below.
For such a large cluster, we certainly rely on automation to detect and remove misbehaving nodes from the cluster. Over time, we have built many health check systems.
Some health checks are passive and always run on all nodes. These checks monitor basic system resources such as network reachability, bad disks or full disks, or GPU errors. GPUs can fail in many different ways, but a common failure is “uncorrectable ECC errors.” Nvidia’s Data Center GPU Manager (DCGM) tool makes it easy to query this issue and many other “Xid” errors. One way we track these errors is by collecting metrics into our monitoring system Prometheus through dcgm-exporter. This appears as DCGM_FI_DEV_XID_ERRORS metrics and is set to the most recent error code that occurred. Additionally, the NVML device query API exposes more detailed information about the health and operation of GPUs.
Once detected, errors can often be fixed by resetting the GPU or the system, but in some cases, it may require replacing the underlying GPU.
Another health check is tracking maintenance events from upstream cloud providers. Each major cloud provider exposes a way to understand whether a current VM requires an upcoming maintenance event that will ultimately lead to an interruption. VMs may need to be rebooted to apply underlying hypervisor patches or to replace physical nodes with other hardware.
These passive health checks run continuously on all nodes. If a health check begins to fail, the node will be automatically tainted so that no new Pods are scheduled on it. For more severe health check failures, we will also attempt Pod eviction to require all currently running Pods to exit immediately. This still depends on the Pods themselves and can be configured through Pod disruption budgets to determine whether this eviction is allowed to occur. Ultimately, either after all Pods terminate, or after 7 days have passed (part of our service level agreement), we will forcibly terminate the VM.
Unfortunately, not all GPU issues manifest through visible error codes via DCGM. We have built our own testing suite to capture other issues by testing GPUs and ensuring that hardware and driver behavior meets expectations. These tests cannot run in the background—they require exclusive access to the GPU for several seconds or minutes.
We first run these tests at node startup, using a system we call “preflight.” All nodes come with a “preflight” taint and label when joining the cluster. This taint prevents regular Pods from being scheduled onto the node. We configure a DaemonSet to run preflight test Pods on all nodes with this label. Once the tests complete successfully, the tests themselves will remove the taint and label, and the node will be available for general use.
We also regularly run these tests during the node’s lifecycle. We run it as a CronJob, allowing it to land on any available node in the cluster. Which nodes get tested may be somewhat random and uncontrolled, but we find that over time it provides sufficient coverage while minimizing coordination or interference.
As the cluster scales, researchers have begun to find it difficult to access the full capacity allocated to them. Traditional job scheduling systems have many different features to fairly run jobs among competing teams, which Kubernetes does not have. Over time, we have drawn inspiration from these job scheduling systems and built several features in a Kubernetes-native way.
We have a service called “team-resource-manager” in each cluster with multiple functions. Its data source is a ConfigMap that specifies tuples of (node selectors, applied team labels, allocation amounts) for all research teams with capacity in a given cluster. It compares the current nodes against these tuples and taints the appropriate number of nodes with openai.com/team=teamname:NoSchedule.
The “team-resource-manager” also has an inbound webhook service, so the appropriate tolerances are applied based on the submitter’s team membership when each job is submitted. Using taints allows us to flexibly restrict the Kubernetes Pod scheduler, for example, allowing lower-priority Pods to have “any” tolerance, so teams can borrow each other’s capacity without extensive coordination.
In addition to dynamically scaling our VM-based cluster with the cluster autoscaler, we also use it to correct (remove and re-add) unhealthy members in the cluster. We achieve this by setting the cluster’s “min” to zero and “max” to available capacity. However, if the cluster-autoscaler finds idle nodes, it will try to shrink to only the needed capacity. Due to various reasons (VM startup delays, pre-allocation costs, the API server impacts mentioned above), this idle scaling is not ideal.
Thus, we introduced “balloon” deployments for both CPU and GPU hosts. This deployment contains a low-priority Pod replica set with a “max” number of Pods. These Pods occupy resources within the node, so the autoscaler does not see them as idle. But since they are low-priority, the scheduler can evict them immediately to free up space for actual work. (We choose to use Deployment instead of DaemonSet to avoid treating DaemonSets as idle workloads on nodes.)
It is worth noting that we use pod anti-affinity to ensure Pods are evenly distributed across nodes. Earlier versions of the Kubernetes scheduler had a performance issue of O(N^2) related to pod anti-affinity. This issue has been corrected since Kubernetes version 1.18.
Our experiments typically involve one or more StatefulSets, each StatefulSet operating different parts of the training task. For the optimizer, researchers need to schedule all members of the StatefulSet before any training can occur (as we typically coordinate between optimizer members using MPI, which is sensitive to changes in group membership).
However, by default, Kubernetes does not necessarily prioritize fulfilling all requests for a given StatefulSet. For example, if two experiments request 100% of the cluster capacity, Kubernetes may only schedule half of the Pods needed for each experiment, leading to deadlock and preventing both experiments from proceeding.
We have tried some methods that require custom schedulers but encountered some edge cases that conflicted with normal Pod scheduling behavior. Kubernetes 1.18 introduced a plugin architecture for the core Kubernetes scheduler, making it easier to add such functionality natively. We recently chose the Coscheduling plugin as a solution to this problem.
As the Kubernetes cluster scales, we still have many issues to address. Some of these issues include:
At the current scale, the built-in TSDB storage engine of Prometheus struggles with compression, and it takes a long time to replay WAL (write-ahead log) on each restart. Queries often lead to errors like “query processing will load too many samples.” We are migrating to a different, Prometheus-compatible storage and query engine. Stay tuned for our future blog posts to see how it performs!
As the cluster scales, the Internet bandwidth per Pod has been calculated. The aggregate Internet bandwidth demand for everyone has become very large, and our researchers now have the capability to unintentionally impose significant resource pressure on other locations on the Internet, such as datasets to download and packages to install.
Kubernetes is a very flexible platform that meets our research needs. It has the capability to handle the most demanding workloads we face. Although there are still many improvements to be made, OpenAI’s supercomputing team will continue to explore the scalability of Kubernetes.
Author Bio:
This article was authored by OpenAI employees Eric Sigler and Benjamin Chess.
Original Link:
https://openai.com/research/scaling-kubernetes-to-7500-nodes
Disclaimer: This article is a translation by InfoQ and reproduction is prohibited without permission.
Starting from 8000 yuan to an annual output value of over 80 billion, a digital explorer hidden in the suburbs
Employees of Wenxin Yiyan jump ship for double salaries; Twitter’s algorithm “programming for the boss”; Jack Ma is back, Alibaba has split|Q Information
Just now! Elon Musk open-sourced the Twitter algorithm, GitHub Stars have exceeded 10,000
Say goodbye to K8s and Docker Swarm! The father of Ruby on Rails after leaving the cloud: the system is easy to use and cheap, and has cleaned up thousands of lines of code
From May 26 to 27, the QCon Global Software Development Conference will soon be held in Guangzhou, discussing from the perspectives of next-generation software architecture, improving R&D efficiency, DevOps vs. platform engineering, AIGC, data-driven business, industrial internet, thoughts on going global, financial distributed core systems, and frontend architecture, welcome you to check in and communicate on site~
Click Read Original to go directly to the conference official website, buy tickets now for an 8% discount, and group purchases have more discounts. Interested students can contact the ticket manager: 15600537884 (phone same as WeChat).