To date, a major concern regarding neural networks is that they are difficult to interpret black boxes. This article primarily aims to understand theoretically why neural networks perform so well in pattern recognition and classification. The essence lies in the fact that they distort and transform the original input through layers of affine transformations and nonlinear transformations, until different categories can be easily distinguished. In reality, the backpropagation algorithm (BP) fine-tunes this distortion effect continuously based on training data. This article uses multiple dynamic images to vividly explain the working principles of neural networks, and related content can also be referenced in discussions by Zhihu users:https://www.zhihu.com/question/65403482/answer/2490040491
Author | Christopher Olah Source | Datawhale Translation | Liu Yang Proofreading | Hu Yanjun (OneFlow)
About ten years ago, deep neural networks began to achieve breakthrough results in fields such as computer vision, attracting great interest and attention.
However, there are still some concerns. One reason is that neural networks are black boxes: if a neural network is well-trained, it can yield high-quality results, but it is difficult to understand how it works. If a neural network fails, it is also hard to pinpoint the problem.
Although it is challenging to understand deep neural networks as a whole, we can start with low-dimensional deep neural networks, which have only a few neurons in each layer and are much easier to comprehend. We can utilize visualization methods to understand the behavior and training of low-dimensional deep neural networks. Visualization techniques allow us to intuitively grasp the behavior of neural networks and observe the connections between neural networks and topology.
Next, I will discuss many interesting topics, including the lower bounds of the complexity of neural networks capable of classifying specific datasets.
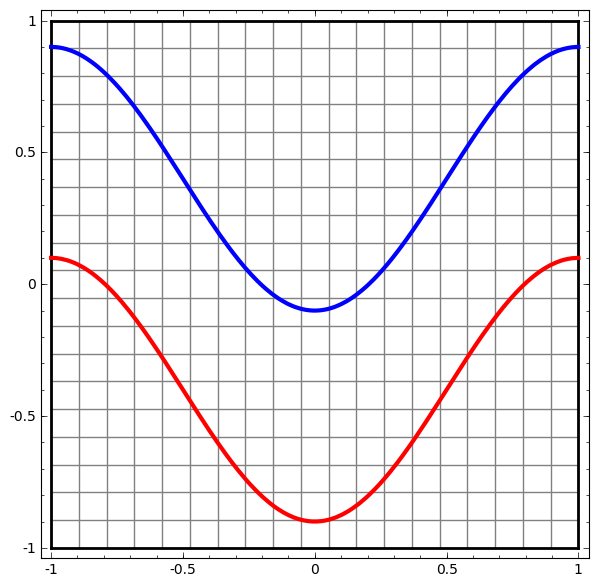
Let’s start with a very simple dataset. In the figure below, two curves on the plane consist of countless points. The neural network will attempt to distinguish which points belong to which line.
To observe the behavior of a neural network (or any classification algorithm), the most direct method is to see how it classifies each data point.
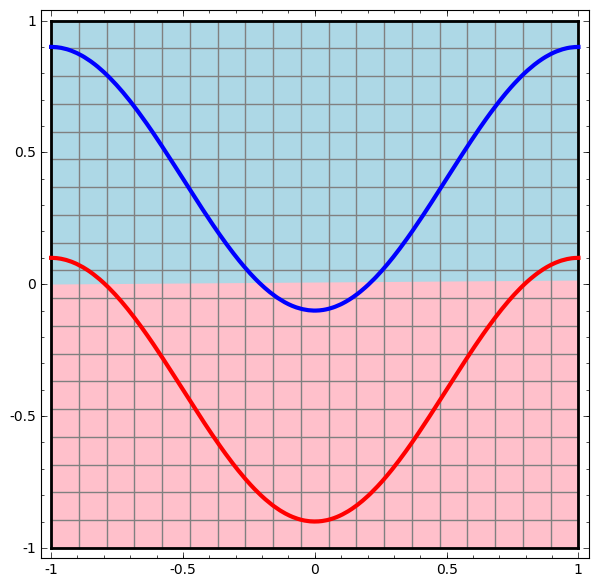
We start by observing the simplest neural network, which has only an input layer and an output layer. Such a neural network simply separates the two classes of data points with a straight line.
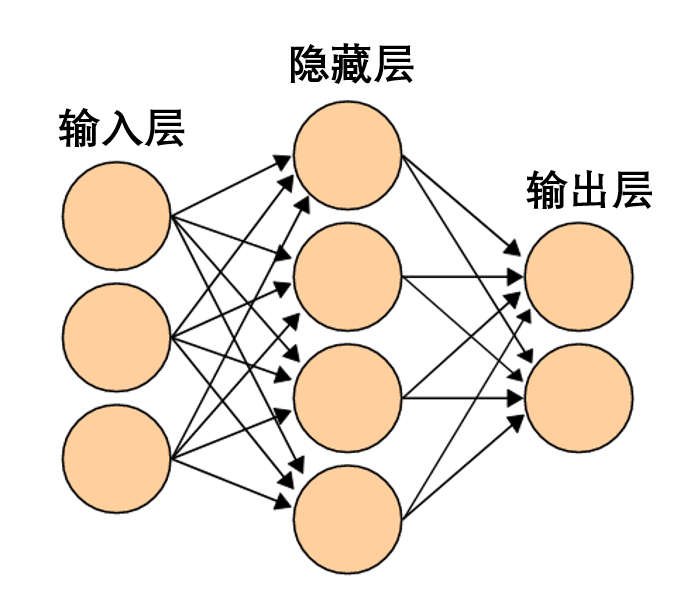
This neural network is too simplistic. Modern neural networks typically have multiple layers between the input layer and the output layer, known as hidden layers. Even the simplest modern neural networks have at least one hidden layer.
A simple neural network, image source Wikipedia
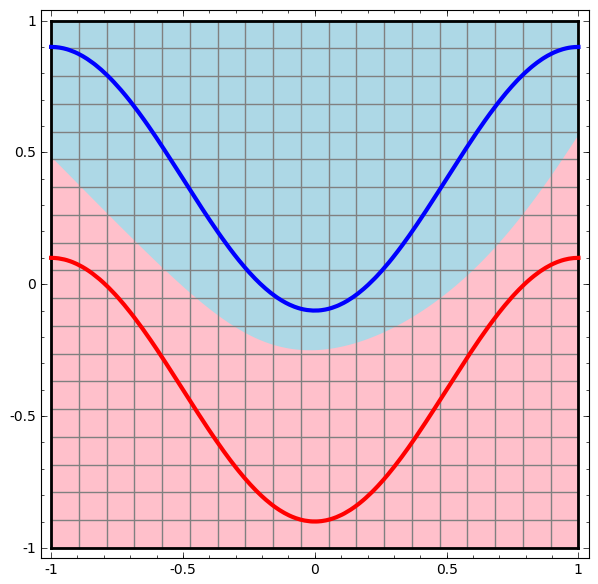
Similarly, we observe the operations performed by the neural network on each data point. It is evident that this neural network separates the data points with a curve rather than a straight line. Clearly, a curve is more complex than a straight line.
Each layer of the neural network represents the data using a new representation. We can observe how the data transforms into new representations and how the neural network classifies them. In the representation of the last layer, the neural network will draw a line between the two classes of data to separate them (if in higher dimensions, it will draw a hyperplane).
In the previous visualization, we saw the original representation of the data. You can think of it as how the data looks at the “input layer.” Now let’s see how the data looks after transformation; you can think of it as how the data appears in the “hidden layer.”
Each dimension of the data corresponds to the activation of a neuron in the neural network layer.
The hidden layer represents the data in such a way that it can be separated by a straight line (i.e., linearly separable).
Continuous Visualization of Layers
In the previous method, each layer of the neural network represents the data with different representations. As a result, the representations between each layer are discrete, not continuous.
This creates difficulty in our understanding. How does the transformation occur from one representation to another? Fortunately, the properties of the layers in neural networks make this understanding quite easy.
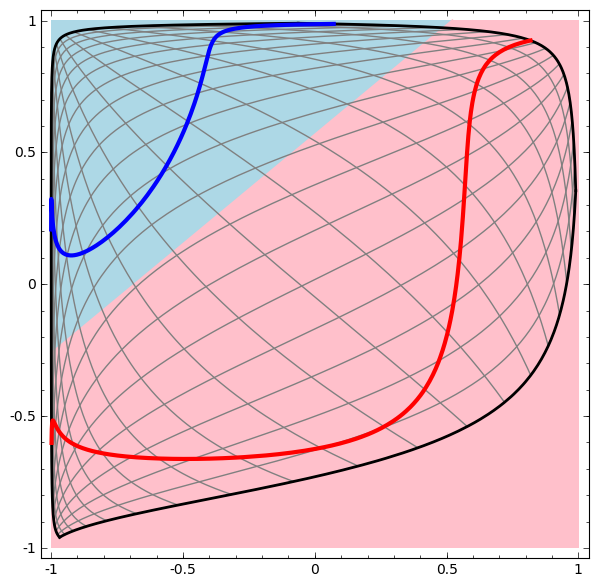
There are various types of layers in neural networks. Below we will discuss a tanh layer as a specific example. A tanh layer:
We can view it as a continuous transformation, as shown below:
The situation is similar for other standard layers, which consist of affine transformations and the pointwise application of monotonic activation functions.
We can use this method to understand more complex neural networks. For example, the neural network below uses four hidden layers to classify two slightly intertwined helical lines. It can be seen that to classify the data, the representation of the data is continuously transformed. The two helical lines are initially tangled together, but by the end, they can be separated by a straight line (linearly separable).
On the other hand, the following neural network, although it also uses multiple hidden layers, cannot separate two more deeply intertwined helical lines.
It should be noted that the classification tasks of the two helical lines above are somewhat challenging because we are currently using only low-dimensional neural networks. If we use a wider neural network, everything would be much easier.
(Andrej Karpathy created a great demo based on ConvnetJS that allows users to explore neural networks interactively through this visualization.)
Topology of the Tanh Layer
Each layer of the neural network stretches and compresses space, but it does not shear, tear, or fold space. Intuitively, neural networks do not destroy the topological properties of the data. For example, if a set of data is continuous, then it remains continuous after transformation into a new representation (and vice versa).
Transformations that do not affect topological properties are called homeomorphisms. Formally, they are bijections of continuous functions.
Theorem: If the weight matrix W is non-singular, and a layer of the neural network has N inputs and N outputs, then the mapping of this layer is homeomorphic (for specific domains and ranges).
Proof: Let’s go step by step:
1. Assume W has a non-zero determinant. Then it is a bijective linear function with a linear inverse. Linear functions are continuous. Therefore, a transformation like “multiplying by W” is homeomorphic;
2. The “translation” transformation is homeomorphic;
3. Tanh (as well as sigmoid and softplus, but not including ReLU) is a continuous function with continuous inverses (for specific domains and ranges). They are bijections, and their pointwise applications are homeomorphic.
Thus, if W has a non-zero determinant, this layer of the neural network is homeomorphic.
If we combine such layers arbitrarily, the result still holds.
Topology and Classification
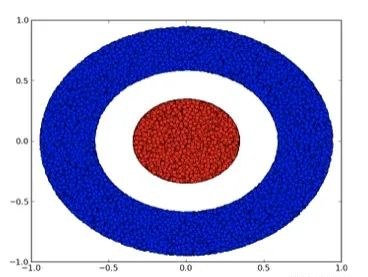
Let’s look at a two-dimensional dataset, which contains two classes of data A and B:
Note: To classify this dataset, the neural network (regardless of depth) must have a layer containing 3 or more hidden units.
As mentioned earlier, using sigmoid units or softmax layers for classification is equivalent to finding a hyperplane (in this case, a line) in the representation of the last layer to separate A and B. If there are only two hidden units, the neural network cannot topologically separate the data in this way, and thus cannot classify the above dataset.
In the visualization below, the transformations of the hidden layer alter the representation of the data, with the line as the dividing line. It can be seen that the dividing line continuously rotates and moves but never effectively separates classes A and B.
This neural network will not successfully complete the classification task no matter how it is trained.
In the end, it can only barely achieve a local minimum, reaching 80% classification accuracy.
The above example has only one hidden layer, and since there are only two hidden units, it will fail to classify regardless.
Proof: If there are only two hidden units, either the transformation of this layer is homeomorphic, or the weight matrix of the layer has a determinant of 0. If it is homeomorphic, A is still surrounded by B, and cannot be separated by a line. If the determinant is 0, then the dataset will fold along some axis. Since A is surrounded by B, any folding of A along any axis will lead to some A data points mixing with B, making it impossible to distinguish A and B.
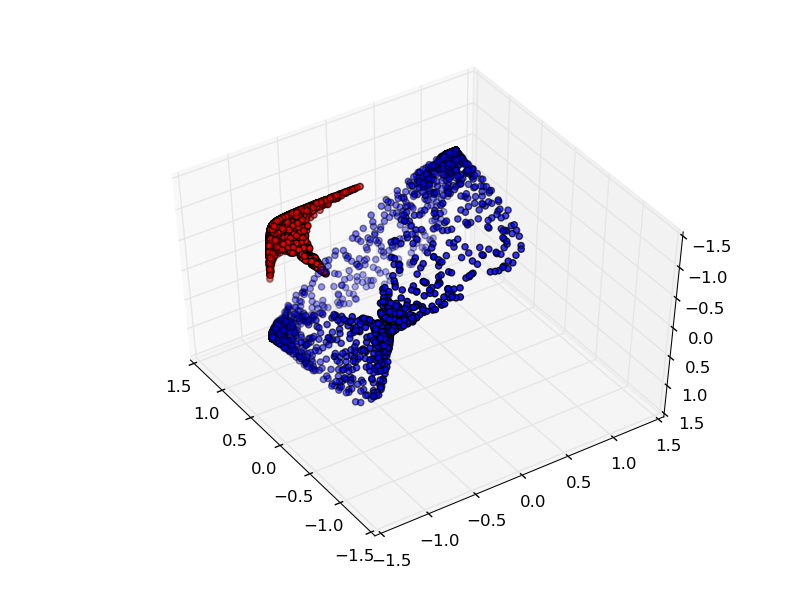
However, if we add a third hidden unit, the problem will be solved. At this point, the neural network can transform the data into the following representation:
At this point, a hyperplane can be used to separate A and B.
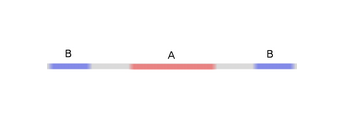
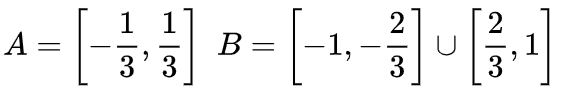
To better explain the principle, let’s use a simpler one-dimensional dataset as an example:
To classify this dataset, a layer composed of two or more hidden units must be used. If two hidden units are used, a beautiful curve can represent the data, allowing a line to separate A and B:
How is this achieved? When one of the hidden units is activated, the other hidden unit is not activated. When the first hidden unit is activated while the second hidden unit is not, it can be determined that this is a data point belonging to A.
Does the manifold hypothesis make sense for handling real-world datasets (e.g., image data)? I believe it does.
The manifold hypothesis states that natural data forms low-dimensional manifolds in their embedded space. This hypothesis is supported by both theoretical and experimental evidence. If you believe in the manifold hypothesis, then the task of classification algorithms can be reduced to separating a set of intertwined manifolds.
In the previous examples, one class completely surrounds another class. However, in real-world data, the manifold of dog images is unlikely to be completely surrounded by the manifold of cat images. Nevertheless, other more reasonable topological situations may still pose challenges, which will be discussed in the next section.
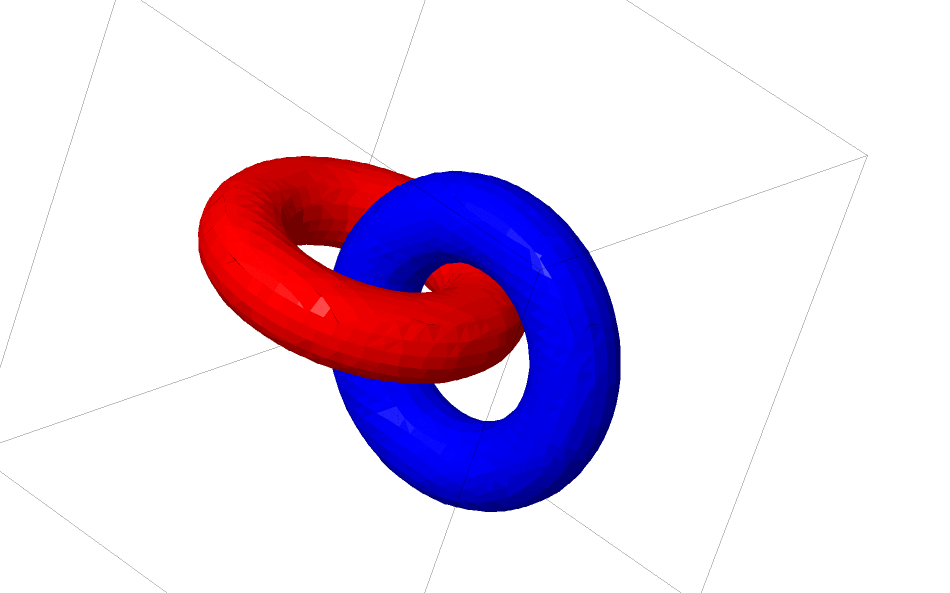
Next, I will talk about another interesting dataset: two linked tori, A and B.
Similar to the datasets we discussed earlier, if we do not use n+1 dimensions, we cannot separate an n-dimensional dataset (where n+1 dimension in this case is the fourth dimension).
The linking problem belongs to knot theory in topology. Sometimes, when we see a link, we cannot immediately determine whether it is an unlink (unlink means that although they are entangled, they can be separated through continuous deformation).
If a neural network with three hidden units can classify a dataset, then that dataset is an unlink (the question arises: theoretically, can all unlinks be classified by a neural network with only three hidden units?).
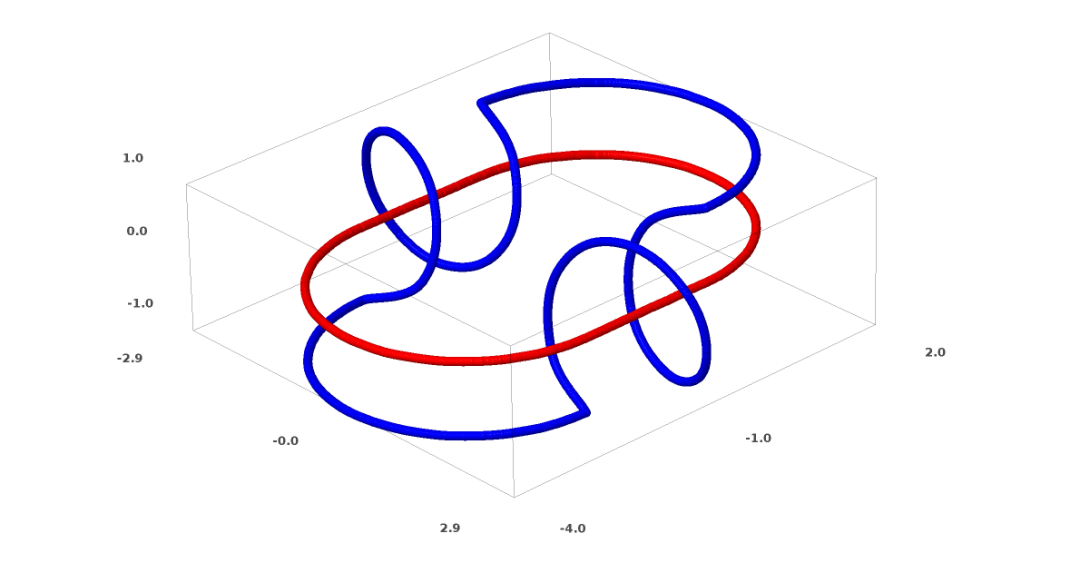
From the perspective of knot theory, the continuous visualization of the data representations produced by the neural network is not only a great animation but also a process of untying links. In topology, we refer to this as the ambient isotopy between the original link and the separated link.
The ambient isotopy between manifolds A and B is a continuous function:
Each
one of the hidden units is activated, the other hidden unit is not activated. When the first hidden unit is activated while the second hidden unit is not, it can be determined that this is a data point belonging to A.
Does the manifold hypothesis make sense for handling real-world datasets (e.g., image data)? I believe it does.
The manifold hypothesis states that natural data forms low-dimensional manifolds in their embedded space. This hypothesis is supported by both theoretical and experimental evidence. If you believe in the manifold hypothesis, then the task of classification algorithms can be reduced to separating a set of intertwined manifolds.
In the previous examples, one class completely surrounds another class. However, in real-world data, the manifold of dog images is unlikely to be completely surrounded by the manifold of cat images. Nevertheless, other more reasonable topological situations may still pose challenges, which will be discussed in the next section.
Next, I will talk about another interesting dataset: two linked tori, A and B.
Similar to the datasets we discussed earlier, if we do not use n+1 dimensions, we cannot separate an n-dimensional dataset (where n+1 dimension in this case is the fourth dimension).
The linking problem belongs to knot theory in topology. Sometimes, when we see a link, we cannot immediately determine whether it is an unlink (unlink means that although they are entangled, they can be separated through continuous deformation).
If a neural network with three hidden units can classify a dataset, then that dataset is an unlink (the question arises: theoretically, can all unlinks be classified by a neural network with only three hidden units?).
From the perspective of knot theory, the continuous visualization of the data representations produced by the neural network is not only a great animation but also a process of untying links. In topology, we refer to this as the ambient isotopy between the original link and the separated link.
The ambient isotopy between manifolds A and B is a continuous function:
Each is homeomorphic to X.
 is the characteristic function,
 mapping A to B. That is,
  continuously transitions from mapping A to itself to mapping A to B.
Theorem: If the following three conditions are met simultaneously: (1) W is non-singular; (2) the order of the neurons in the hidden layer can be manually arranged; (3) the number of hidden units is greater than 1, then there is an ambient isotopy between the input of the neural network and the representations produced by the neural network layer.
Proof: Let’s also go step by step:
1. The hardest part is the linear transformation. To achieve a linear transformation, we need W to have a positive determinant. Our premise is that the determinant is non-zero; if the determinant is negative, we can convert it to positive by swapping two hidden neurons. The space of positive determinant matrices is path-connected, thus there exists
continuously transitions from mapping A to itself to mapping A to B.
Theorem: If the following three conditions are met simultaneously: (1) W is non-singular; (2) the order of the neurons in the hidden layer can be manually arranged; (3) the number of hidden units is greater than 1, then there is an ambient isotopy between the input of the neural network and the representations produced by the neural network layer.
Proof: Let’s also go step by step:
1. The hardest part is the linear transformation. To achieve a linear transformation, we need W to have a positive determinant. Our premise is that the determinant is non-zero; if the determinant is negative, we can convert it to positive by swapping two hidden neurons. The space of positive determinant matrices is path-connected, thus there exists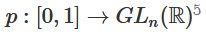 , and therefore,
 through the function
 we can continuously transition the characteristic function to the W transformation, multiplying x with the continuously transitioning matrix
 .
2. The transition from the characteristic function to the b translation can be achieved through the function
.
2. The transition from the characteristic function to the b translation can be achieved through the function .
3. The transition from the characteristic function to the
.
3. The transition from the characteristic function to the can be achieved through pointwise application.
I suspect some may be interested in the following question: Is it possible to develop a program that can automatically discover such ambient isotopies and also automatically prove the equivalence of certain different links or the separability of certain links? I am also curious whether neural networks can outperform the current SOTA techniques in this regard.
Although the forms of links we are discussing now are unlikely to appear in real-world data, real data may exist in higher-dimensional generalizations.
Links and knots are both 1-dimensional manifolds, but they require 4 dimensions to be separated. Similarly, to separate n-dimensional manifolds, higher-dimensional space is needed. All n-dimensional manifolds can be separated using 2n+2 dimensions.
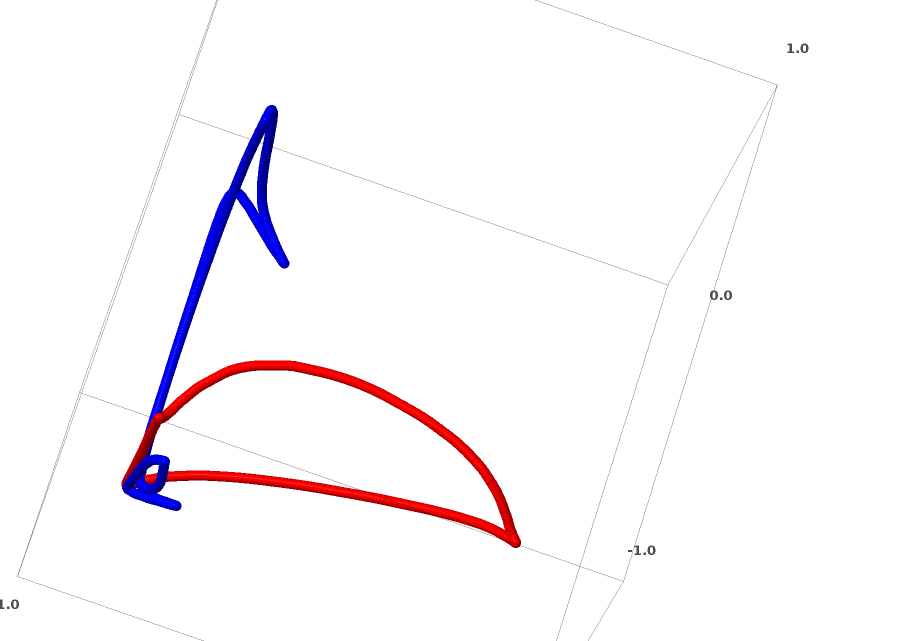
The simplest method for neural networks is to directly pull apart intertwined manifolds and to stretch the parts that are tangled together as much as possible. While this is not the fundamental solution we seek, it can achieve relatively high classification accuracy, reaching a relatively ideal local minimum.
This method will lead to very high derivatives in the regions being stretched. Addressing this requires using a contraction penalty, which penalizes the derivatives of the layers of data points.
Local minima are of no use in solving topological problems; however, topological issues may provide good insights into exploring solutions to the aforementioned problems.
On the other hand, if we only care about achieving good classification results, then if a small part of the manifold is intertwined with another manifold, is that a problem for us? If we only care about classification results, this does not seem to be an issue.
(My intuition suggests that shortcut methods like this are not good, as they can easily lead to dead ends. Especially in optimization problems, seeking local minima does not truly solve the problem, and if a solution is chosen that does not genuinely resolve the issue, good performance will ultimately not be achieved.)
Selecting More Suitable Neural Network Layers for Manipulating Manifolds?
I believe standard neural network layers are not suitable for manipulating manifolds because they use affine transformations and pointwise activation functions.
Perhaps we can use a completely different type of neural network layer?
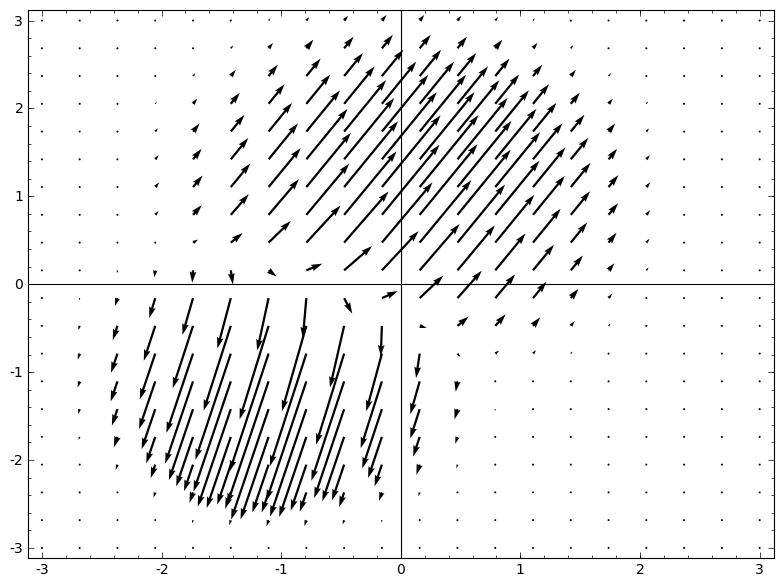
One idea that comes to mind is to first let the neural network learn a vector field, where the direction of the vector field is the direction we wish to move the manifold:
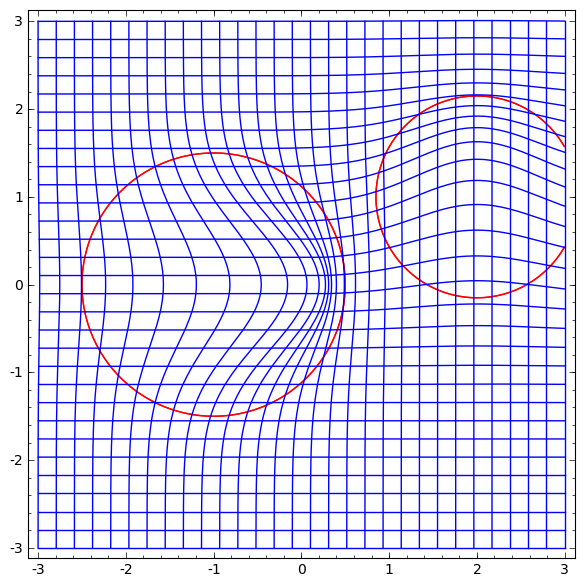
Then deform the space based on this:
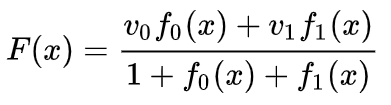
We can learn the vector field at fixed points (just select some fixed points from the training set as anchors) and interpolate in some way. The form of the above vector field is as follows:
where and are vectors, and and are n-dimensional Gaussian functions. This idea is inspired by radial basis functions.
K-Nearest Neighbors Layer
Another perspective I have is that linear separability may be an overly high and unreasonable requirement for neural networks; perhaps using k-nearest neighbors (k-NN) would be better. However, the k-NN algorithm heavily relies on the representation of the data, so a good data representation is needed for k-NN to yield good results.
In the first experiment, I trained some MNIST neural networks (two-layer CNN, no dropout), achieving an error rate of less than 1%. Then, I discarded the final softmax layer and used the k-NN algorithm, which repeatedly showed a reduction in the error rate by 0.1-0.2%.
However, I feel that this approach is still not correct. The neural network is still attempting linear classification, but due to using the k-NN algorithm, it can slightly correct some of the errors it makes, thus reducing the error rate.
Due to the weighting of (1/distance), k-NN is differentiable for the representations it acts upon. Therefore, we can directly train the neural network for k-NN classification. This can be viewed as a “nearest neighbor” layer, which functions similarly to the softmax layer.
We do not want to feedback the entire training set for every mini-batch, as this is too costly. I think a good method is to classify each element in the mini-batch based on the classes of other elements in the mini-batch, assigning each element a weight of (1/(distance to the classification target)).
Unfortunately, even with complex architectures, using the k-NN algorithm can only reduce the error rate to 4-5%, while simpler architectures yield even higher error rates. However, I have not put much effort into hyperparameters.
But I still like the k-NN algorithm because it is more suitable for neural networks. We want points on the same manifold to be closer to each other, rather than being fixated on separating the manifolds with hyperplanes. This simplifies the problem by shrinking individual manifolds while enlarging the space between different categories of manifolds.
Certain topological properties of data may prevent these data from being linearly separable using low-dimensional neural networks (regardless of the depth of the neural network). Even in technically feasible cases, such as spirals, it is very difficult to achieve separation with low-dimensional neural networks.
To achieve precise classification of data, neural networks sometimes require wider layers. Additionally, traditional neural network layers are not suitable for manipulating manifolds; even with manually set weights, it is difficult to obtain ideal data transformation representations. New neural network layers may provide good auxiliary functions, especially those derived from a manifold perspective to understand machine learning.
can be achieved through pointwise application.
I suspect some may be interested in the following question: Is it possible to develop a program that can automatically discover such ambient isotopies and also automatically prove the equivalence of certain different links or the separability of certain links? I am also curious whether neural networks can outperform the current SOTA techniques in this regard.
Although the forms of links we are discussing now are unlikely to appear in real-world data, real data may exist in higher-dimensional generalizations.
Links and knots are both 1-dimensional manifolds, but they require 4 dimensions to be separated. Similarly, to separate n-dimensional manifolds, higher-dimensional space is needed. All n-dimensional manifolds can be separated using 2n+2 dimensions.
The simplest method for neural networks is to directly pull apart intertwined manifolds and to stretch the parts that are tangled together as much as possible. While this is not the fundamental solution we seek, it can achieve relatively high classification accuracy, reaching a relatively ideal local minimum.
This method will lead to very high derivatives in the regions being stretched. Addressing this requires using a contraction penalty, which penalizes the derivatives of the layers of data points.
Local minima are of no use in solving topological problems; however, topological issues may provide good insights into exploring solutions to the aforementioned problems.
On the other hand, if we only care about achieving good classification results, then if a small part of the manifold is intertwined with another manifold, is that a problem for us? If we only care about classification results, this does not seem to be an issue.
(My intuition suggests that shortcut methods like this are not good, as they can easily lead to dead ends. Especially in optimization problems, seeking local minima does not truly solve the problem, and if a solution is chosen that does not genuinely resolve the issue, good performance will ultimately not be achieved.)
Selecting More Suitable Neural Network Layers for Manipulating Manifolds?
I believe standard neural network layers are not suitable for manipulating manifolds because they use affine transformations and pointwise activation functions.
Perhaps we can use a completely different type of neural network layer?
One idea that comes to mind is to first let the neural network learn a vector field, where the direction of the vector field is the direction we wish to move the manifold:
Then deform the space based on this:
We can learn the vector field at fixed points (just select some fixed points from the training set as anchors) and interpolate in some way. The form of the above vector field is as follows:
where and are vectors, and and are n-dimensional Gaussian functions. This idea is inspired by radial basis functions.
K-Nearest Neighbors Layer
Another perspective I have is that linear separability may be an overly high and unreasonable requirement for neural networks; perhaps using k-nearest neighbors (k-NN) would be better. However, the k-NN algorithm heavily relies on the representation of the data, so a good data representation is needed for k-NN to yield good results.
In the first experiment, I trained some MNIST neural networks (two-layer CNN, no dropout), achieving an error rate of less than 1%. Then, I discarded the final softmax layer and used the k-NN algorithm, which repeatedly showed a reduction in the error rate by 0.1-0.2%.
However, I feel that this approach is still not correct. The neural network is still attempting linear classification, but due to using the k-NN algorithm, it can slightly correct some of the errors it makes, thus reducing the error rate.
Due to the weighting of (1/distance), k-NN is differentiable for the representations it acts upon. Therefore, we can directly train the neural network for k-NN classification. This can be viewed as a “nearest neighbor” layer, which functions similarly to the softmax layer.
We do not want to feedback the entire training set for every mini-batch, as this is too costly. I think a good method is to classify each element in the mini-batch based on the classes of other elements in the mini-batch, assigning each element a weight of (1/(distance to the classification target)).
Unfortunately, even with complex architectures, using the k-NN algorithm can only reduce the error rate to 4-5%, while simpler architectures yield even higher error rates. However, I have not put much effort into hyperparameters.
But I still like the k-NN algorithm because it is more suitable for neural networks. We want points on the same manifold to be closer to each other, rather than being fixated on separating the manifolds with hyperplanes. This simplifies the problem by shrinking individual manifolds while enlarging the space between different categories of manifolds.
Certain topological properties of data may prevent these data from being linearly separable using low-dimensional neural networks (regardless of the depth of the neural network). Even in technically feasible cases, such as spirals, it is very difficult to achieve separation with low-dimensional neural networks.
To achieve precise classification of data, neural networks sometimes require wider layers. Additionally, traditional neural network layers are not suitable for manipulating manifolds; even with manually set weights, it is difficult to obtain ideal data transformation representations. New neural network layers may provide good auxiliary functions, especially those derived from a manifold perspective to understand machine learning.
Source: Machine Learning Algorithms and Related Topics