↑Click “Shanghai Financial Information Industry Association” to follow us
From the early days of Google search to today’s chatbots, big data risk control, securities investment, smart healthcare, adaptive education, and recommendation systems, all are related to knowledge graphs. Its popularity in the technical field has also been increasing year by year. This article explains the knowledge related to knowledge graphs in an easy-to-understand manner, especially the steps that need to be taken to build a knowledge graph from scratch and the issues that need to be considered at each stage.
What is a Knowledge Graph?
A knowledge graph is a new concept proposed by Google in 2012. From an academic perspective, we can define a knowledge graph as: “A knowledge graph is essentially a knowledge base of a semantic network”. However, this is somewhat abstract, so from a practical application perspective, a knowledge graph can simply be understood as a multi-relational graph.
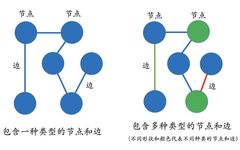
So what is a multi-relational graph? Those who have studied data structures should know what a graph is. A graph is composed of nodes (Vertex) and edges (Edge), but these graphs usually only contain one type of node and edge. In contrast, multi-relational graphs generally contain multiple types of nodes and multiple types of edges. For example, the left diagram represents a classic graph structure, while the right diagram represents a multi-relational graph because it contains multiple types of nodes and edges, marked by different colors.
Representation of Knowledge Graphs
The premise of applying knowledge graphs is that the knowledge graph has been built, which can also be considered a knowledge base. This is why it can be used to answer some search-related questions. For example, when you enter “Who is the wife of Bill Gates?” in the Google search engine, we can directly get the answer – “Melinda Gates”. This is because we have created a knowledge base at the system level that contains the entities “Bill Gates” and “Melinda Gates” and the relationship between them. Therefore, when we perform a search, we can directly obtain the final answer through keyword extraction (“Bill Gates”, “Melinda Gates”, “wife”) and matching on the knowledge base. This search method is different from traditional search engines, which return web pages rather than the final answer, adding an extra layer for users to filter and sift through information.

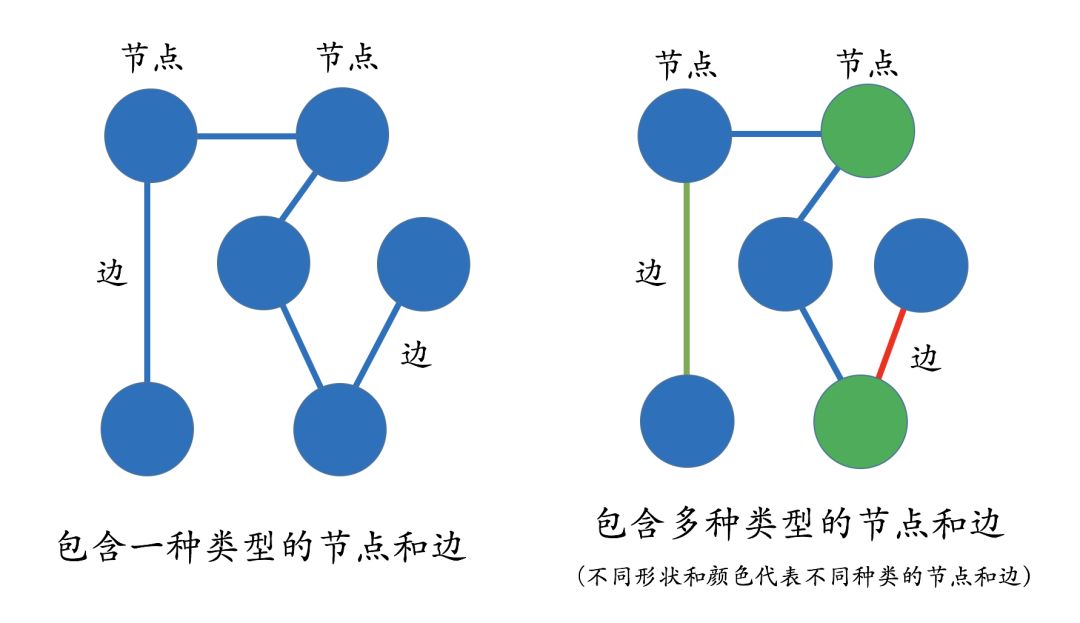
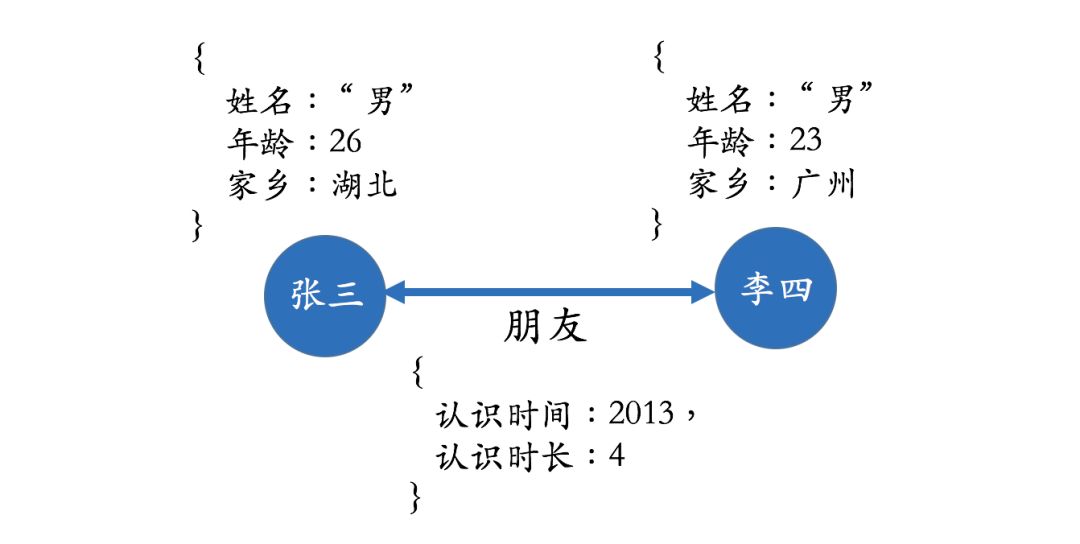
In the real world, entities and relationships also have their own attributes. For example, a person can have “name” and “age”.When a knowledge graph has attributes, we can use a property graph to represent it. The diagram below represents a simple property graph. Li Ming and Li Fei are in a father-son relationship, and Li Ming has a phone number starting with 138, which was activated in 2018, where 2018 can be considered an attribute of the relationship. Similarly, Li Ming himself also has some attribute values, such as age 25 and position as general manager, etc.
Knowledge Extraction
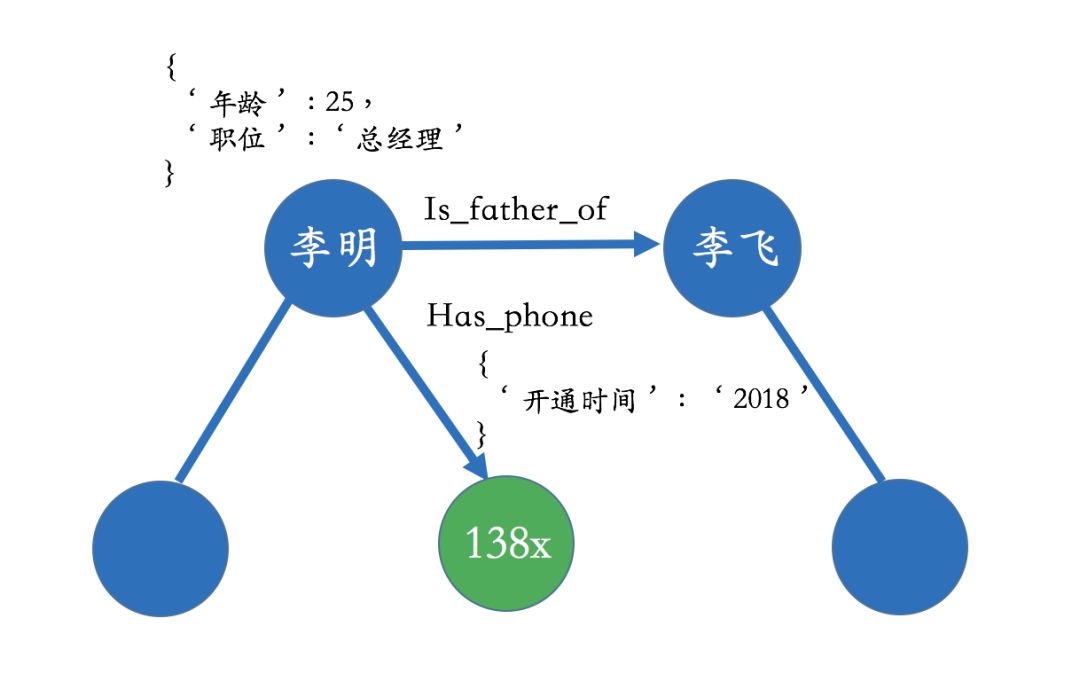
The construction of knowledge graphs is the foundation for subsequent applications, and the premise of construction is to extract data from different data sources. For vertical domain knowledge graphs,their data sources mainly come from two channels: one is the data of the business itself, which is usually contained in the company’s internal database tables and stored in a structured manner; the other is publicly available, scraped data on the web, which usually exists in the form of web pages and is unstructured data.
The former generally only requires simple preprocessing to serve as input for subsequent AI systems, but the latter generally requires the use of natural language processing and other technologies to extract structured information. For example, in the above search example, the relationship between Bill Gates and Melinda Gates can be extracted from unstructured data, such as Wikipedia and other data sources.
The difficulty of information extraction lies in processing unstructured data. In the diagram below, we provide an example. The left side shows a piece of unstructured English text, and the right side shows the entities and relationships extracted from this text. The construction of similar graphs involves several aspects of natural language processing technology:
a. Named Entity Recognition
b. Relation Extraction
c. Entity Resolution
d. Coreference Resolution
Storage of Knowledge Graphs
Knowledge graphs primarily have two storage methods: one is RDF-based storage; the other is graph database-based storage. The differences between them are shown in the diagram below. An important design principle of RDF is the ease of publishing and sharing data, while graph databases focus on efficient graph querying and searching. Additionally, RDF stores data in the form of triples and does not include attribute information, while graph databases generally use property graphs as the basic representation form, meaning entities and relationships can contain attributes, making it easier to express real business scenarios.
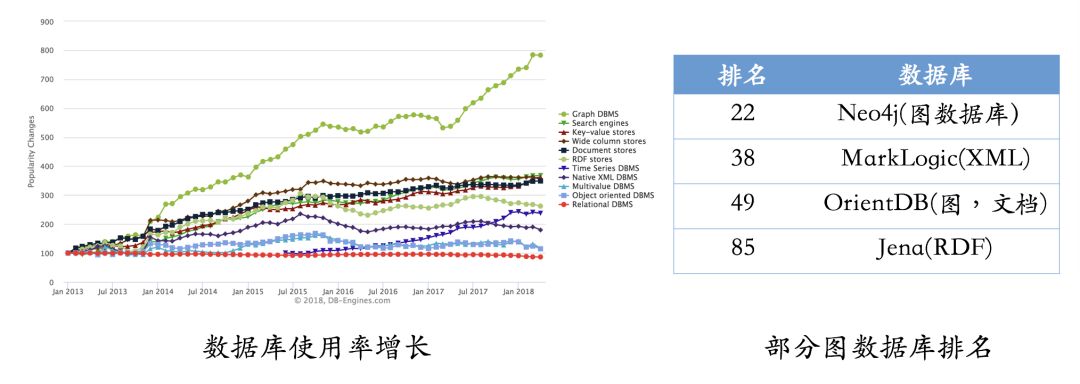
According to the latest statistics (first half of 2018), graph databases remain the fastest-growing storage systems. In contrast, the growth of relational databases has remained stable. At the same time, we have listed commonly used graph database systems and their latest usage rankings. Among them, Neo4j remains the most widely used graph database, with an active community and high query efficiency, but its only drawback is that it does not support quasi-distributed systems. In contrast, OrientDB and JanusGraph (formerly Titan) support distributed systems, but these systems are relatively new, and their communities are not as active as Neo4j, which means that users will inevitably encounter some tricky problems during the usage process. If you choose to use an RDF storage system, Jena may be a good choice.

Construction of Financial Knowledge Graphs
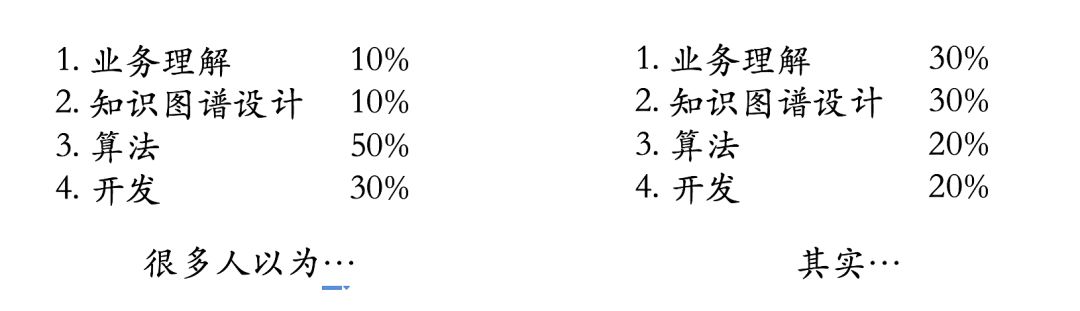
Next, we will look at a specific practical case, explaining how to build a deployable knowledge graph system in the field of financial risk control step by step. One point to clarify is that many people may think that the focus of building a knowledge graph system lies in algorithms and development. However, this is not as imagined; the most important core lies in understanding the business and designing the knowledge graph itself, which is similar to a business system where the design of database tables is crucial, and this design absolutely cannot be separated from a deep understanding of the business and an estimation of future changes in business scenarios. Of course, we will not discuss the importance of data here.
The construction of a complete knowledge graph includes the following steps: 1. Define specific business problems 2. Data collection & preprocessing 3. Design of the knowledge graph 4. Store data in the knowledge graph 5. Development of upper-layer applications and evaluation of the system. Now we will discuss what needs to be done and the issues that need to be considered at each step according to this process.
Define Specific Business Problems
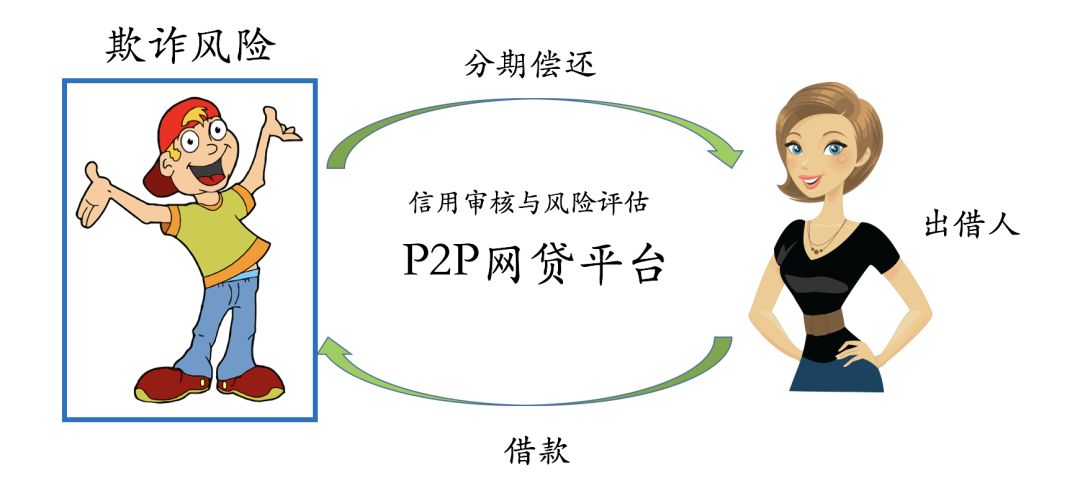
In the P2P online lending environment, the core issue is risk control, which is how to assess the risk of a borrower. In the online environment, fraud risk is particularly severe, and many of these risks are hidden in complex relationship networks, and knowledge graphs are precisely designed for such problems, so we may expect it to bring some value in addressing fraud.
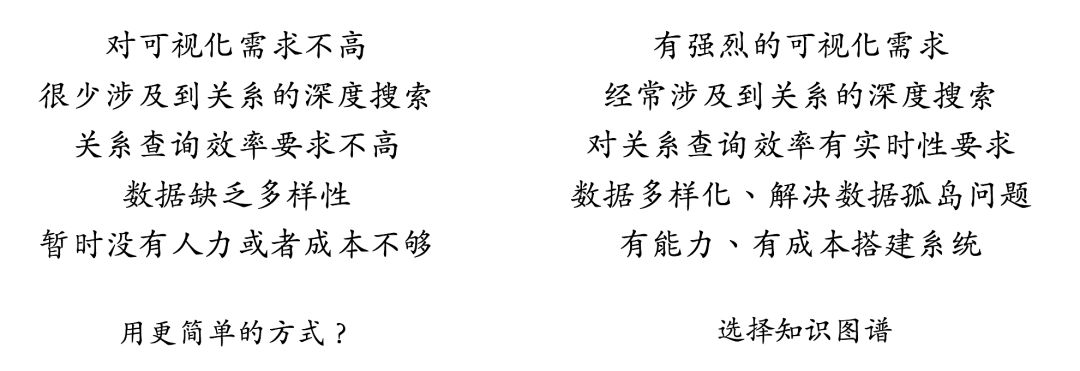
Before discussing the next topic,it is important to clarify whether the knowledge graph system is necessary for one’s own business problem. Because in many practical scenarios, even if there is a certain demand for relationship analysis, traditional databases can actually complete the analysis. Therefore, to avoid choosing a knowledge graph for the sake of it and to better select the technology, the following summarizes a few points for reference.
Data Collection & Preprocessing
The next step is to determine data sources and carry out necessary data preprocessing. Regarding data sources, we need to consider the following points: 1. What data do we already have? 2. What data might we be able to obtain in the future, even if we do not have it now? 3. Which part of the data can be used to reduce risk? 4. Which part of the data can be used to build the knowledge graph? It should be noted that not all data related to anti-fraud must enter the knowledge graph; some decision principles regarding this part will be introduced in more detail in the following sections.
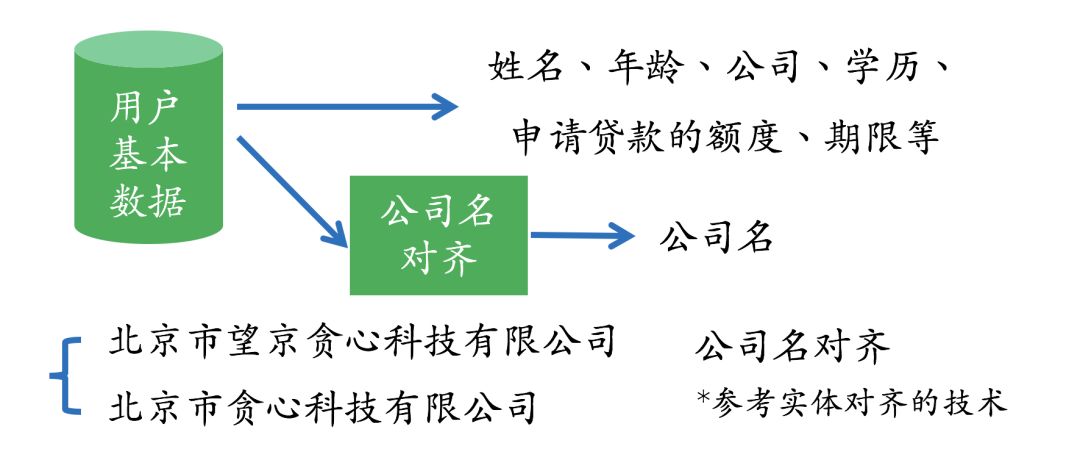
For anti-fraud, there are several data sources that we can easily think of, including users’ basic information, behavioral data, operator data, publicly available information on the internet, etc. Assuming we already have a list of data sources, the next step is to see which data requires further processing. For example, for unstructured data, we will need to use natural language processing-related technologies to some extent. Users’ basic information will generally be stored in business tables, where only a few fields require further processing, while many fields can be directly used for modeling or added to the knowledge graph system. For behavioral data, we need to perform some simple processing and extract valid information, such as “the duration a user stays on a certain page”, etc. For publicly available web data, we will need some information extraction-related technologies.
For example, regarding users’ basic information, we may need the following operations. On one hand, user information such as name, age, and education can be directly extracted from structured databases and used. On the other hand, for company names filled in by users, we may need to perform further processing. For instance, some users fill in “Beijing Greedy Technology Co., Ltd.” while others write “Beijing Wangjing Greedy Technology Co., Ltd.”, referring to the same company. Therefore, we need to align the company names, and the technical details used can refer to the entity alignment technology mentioned earlier.
Design of the Knowledge Graph
The design of the graph is an art; it requires a deep understanding of the business and some estimation of possible future changes in the business to design the most relevant and efficient system. In terms of knowledge graph design, we will certainly face several common questions:1. What entities, relationships, and attributes are needed? 2. What attributes can serve as entities, and which entities can serve as attributes? 3. What information does not need to be included in the knowledge graph?
Based on these common questions, we have abstracted a series of design principles from past design experiences. These design principles are similar to the paradigms in traditional database design, guiding related personnel to design more reasonable knowledge graph systems while ensuring system efficiency.
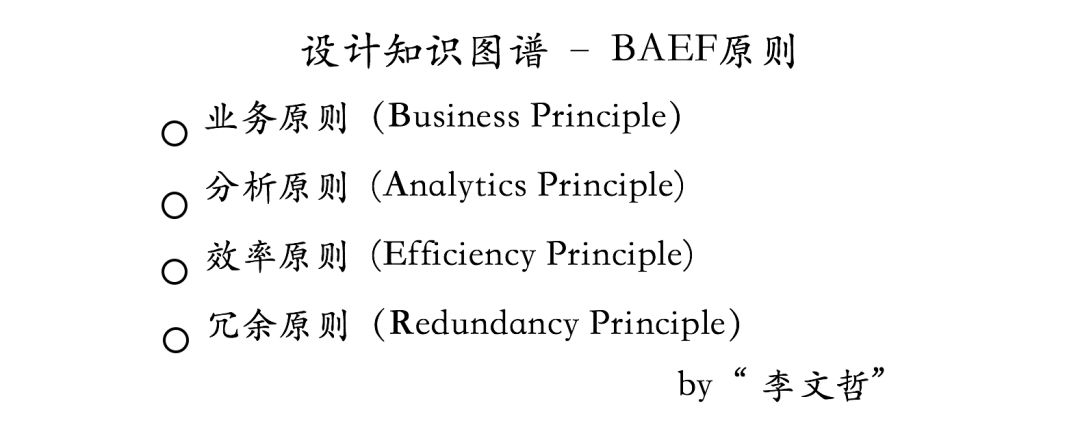
Next, let’s illustrate some of these principles with simple examples. First is the business principle (Business Principle), which means “everything should start from business logic, and by observing the design of the knowledge graph, one can easily infer the underlying business logic, and it is necessary to consider possible future changes in business during the design process”.
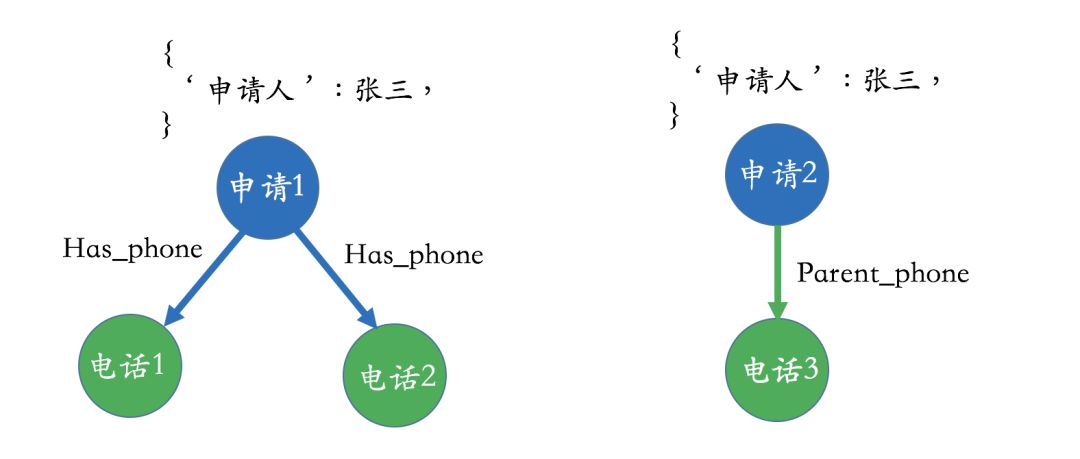
For example, one can observe the graph below and ask oneself what the underlying business logic is. After some observation, it is actually difficult to see what the business process looks like. To make a simple explanation, the entity here – “application” means application; if one is familiar with this field, it is actually the entity of the application. In the diagram below, what do the relationships “has_phone” and “parent phone” between the application and phone entities mean?
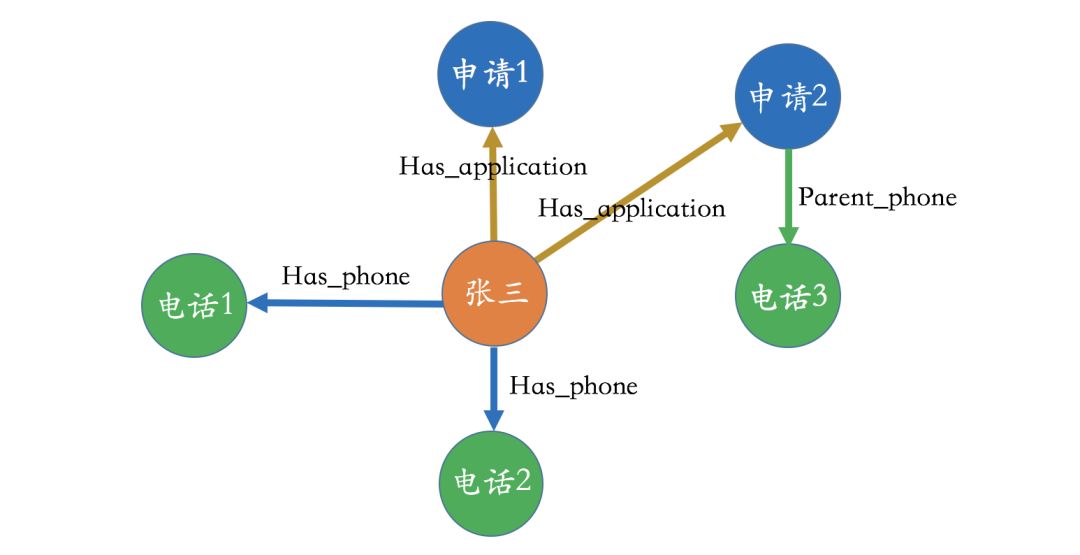
Next, let’s look at the diagram below, which differs from the previous one in that we extracted the applicant from the original attributes and set it as a separate entity. In this case, the entire business logic becomes very clear; we can easily see that Zhang San applied for two loans, and he has two phone numbers, one of which he filled in his parents’ phone number when applying for one of the loans. In summary, a good design makes it easy to see the logic of the business itself.
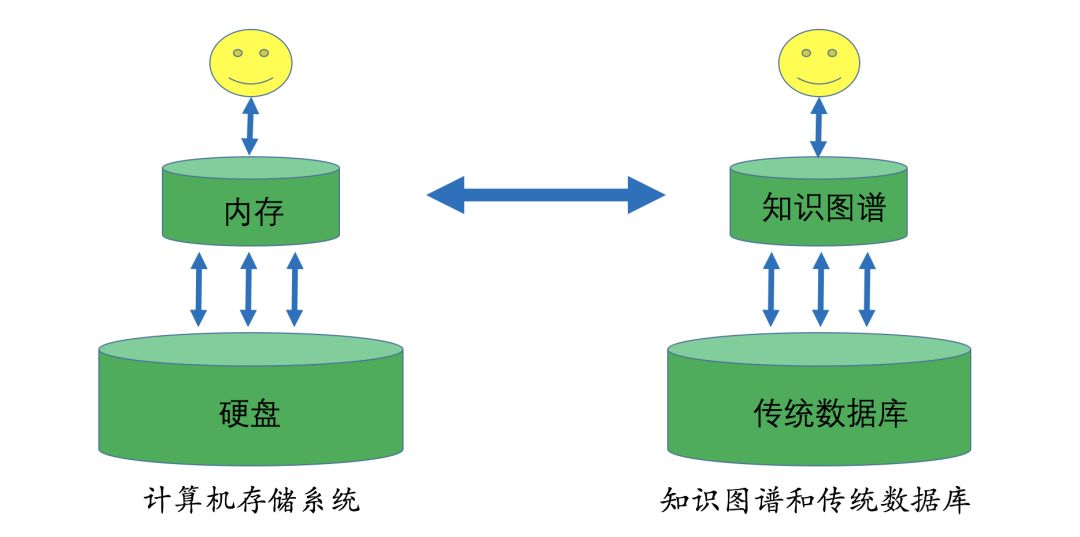
Next, let’s look at a principle called the efficiency principle (Efficiency Principle). The efficiency principle aims to make the knowledge graph as lightweight as possible and determines which data to include in the knowledge graph and which data is unnecessary. Here is a simple analogy: in classic computer storage systems, we often discuss memory and hard drives. Memory, as an efficient access medium, is crucial for the operation of all programs. This layered design in storage comes from the locality of data – “locality”, meaning that frequently accessed data tends to cluster in a specific block, so this data can be stored in memory to improve access efficiency. A similar logic can be applied to the design of knowledge graphs: we store commonly used information in the knowledge graph and keep infrequently accessed, irrelevant information in traditional relational databases.The core of the efficiency principle is to design the knowledge graph as a small and lightweight storage medium.
For example, in the knowledge graph below, we can completely store some information such as “age” and “hometown” in traditional relational databases because this data is: a. Not very useful for relationship analysis b. Low access frequency, and storing it in the knowledge graph would hinder efficiency.
Additionally, from the perspective of the analytics principle (Analytics Principle), we do not need to include entities unrelated to relationship analysis in the graph; from the redundancy principle (Redundancy Principle), some repetitive information and high-frequency information can be stored in traditional databases.
Storing Data in the Knowledge Graph
In terms of storage, we need to face the choice of storage systems, but since our designed knowledge graph has attributes, graph databases can be the first choice. However, which graph database to choose also depends on the business volume and efficiency requirements. If the data volume is particularly large, Neo4j may not meet the business needs, and we would have to choose systems that support quasi-distributed systems like OrientDB, JanusGraph, etc., or reduce the amount of information stored in the knowledge graph by following efficiency and redundancy principles. Generally speaking, for graphs with fewer than one billion nodes, Neo4j is sufficient.
Development of Upper-layer Applications
Once we have constructed the knowledge graph, the next step is to use it to solve specific problems. For the risk control knowledge graph, the primary task is to uncover hidden fraud risks within the relationship network.From an algorithmic perspective, there are two different scenarios: one is rule-based; the other is probability-based. Given the current state of AI technology, rule-based methodologies still dominate applications in vertical fields, but as data volume increases and methodologies improve, probability-based models will gradually bring greater value.
6.5.1 Rule-Based Methodology
First, let’s look at several rule-based applications, which include inconsistency verification, rule-based feature extraction, and pattern-based judgments.
Inconsistency Verification
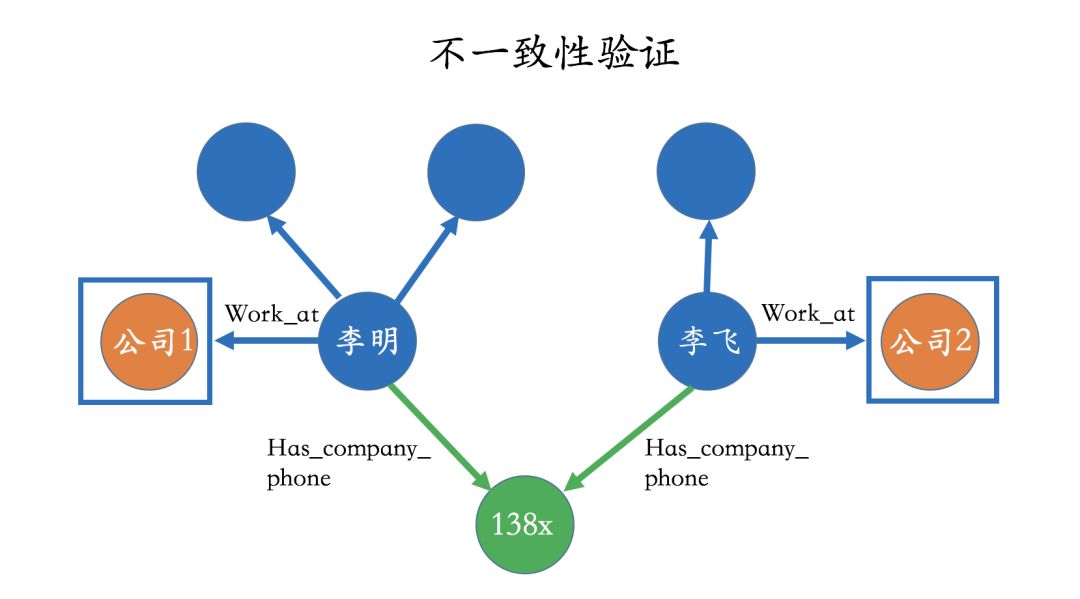
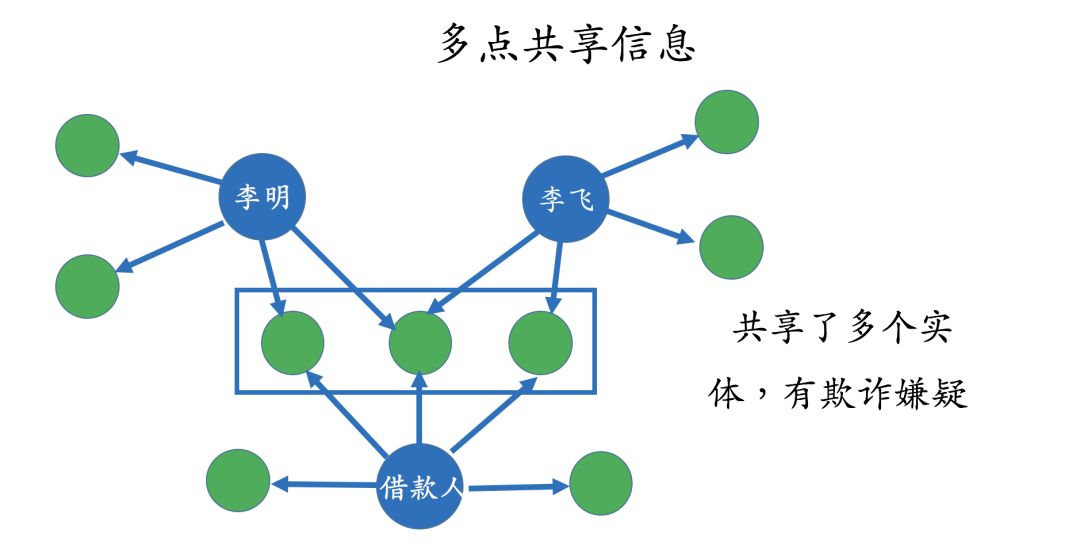
A simple method to identify risks in the relationship network is to perform inconsistency verification, which means using some rules to find potential contradictions. These rules are predefined in a human way, so designing the rules requires some business knowledge. For example, in the diagram below, Li Ming and Li Fei both indicated the same company phone number, but in reality, from the database, it can be determined that they actually work for different companies, which is a contradiction. Similar rules can be numerous and are not listed here.
Rule-Based Feature Extraction
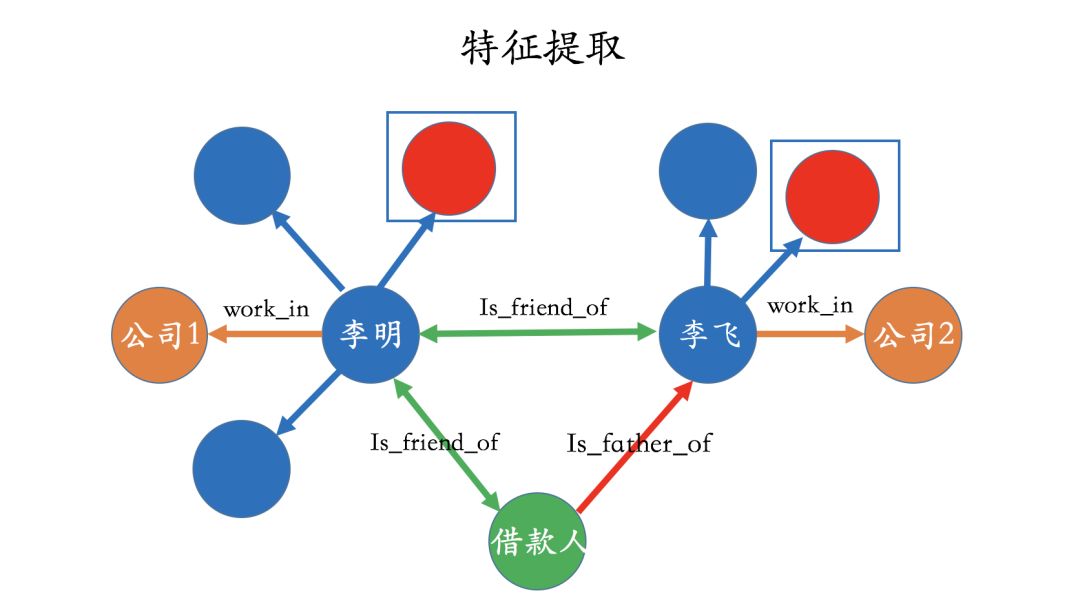
We can also extract features from the knowledge graph based on rules, and these features are generally based on deep searches, such as 2-degree, 3-degree, or even higher dimensions. For example, we can ask a question like: “How many entities in the second-degree relationship of the applicant have touched the blacklist?” From the graph, we can easily observe that two entities in the second-degree relationship have touched the blacklist (marked in red). Once these features are extracted, they can generally serve as inputs for risk models. Here, it is worth noting that if the features do not involve deep relationships, traditional relational databases are sufficient.
Pattern-Based Judgments
This method is more suitable for identifying group fraud; its core is to find groups or sub-graphs that may have risks through some patterns and then conduct further analysis on these sub-graphs. There are many types of patterns; here are a few simple examples. For instance, in the diagram below, three entities share a lot of other information, which we can consider as a group and conduct further analysis.
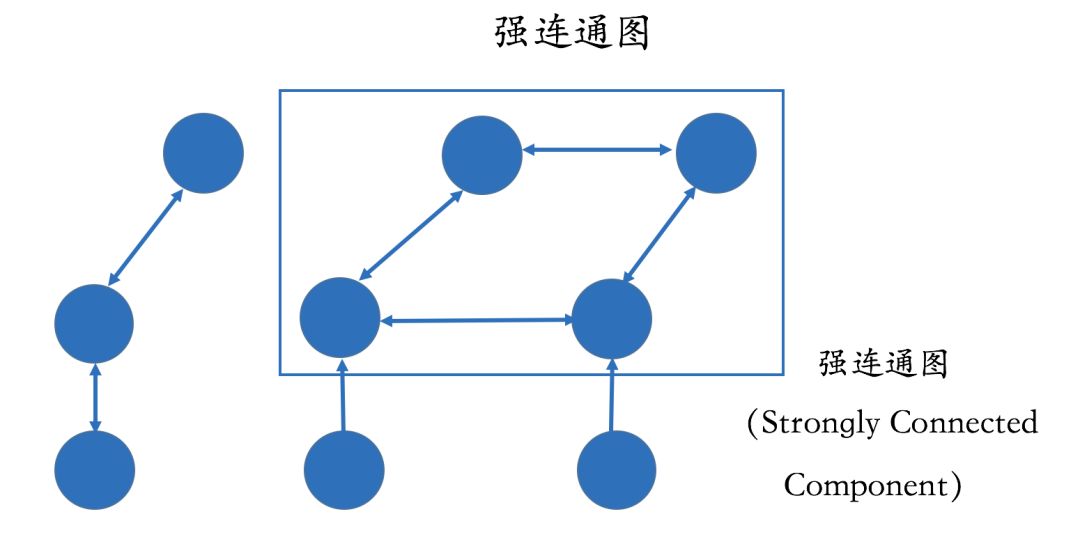
For example, we can also identify strongly connected subgraphs from the knowledge graph and mark them for further risk analysis. A strongly connected subgraph means that every node can reach other points through some path, indicating a strong relationship among these nodes.
6.5.2 Probability-Based Methodology
In addition to rule-based methods, probability statistical methods can also be used. Techniques such as community mining, label propagation, clustering, etc., fall into this category. This article will not delve into these techniques; interested readers can refer to relevant literature.
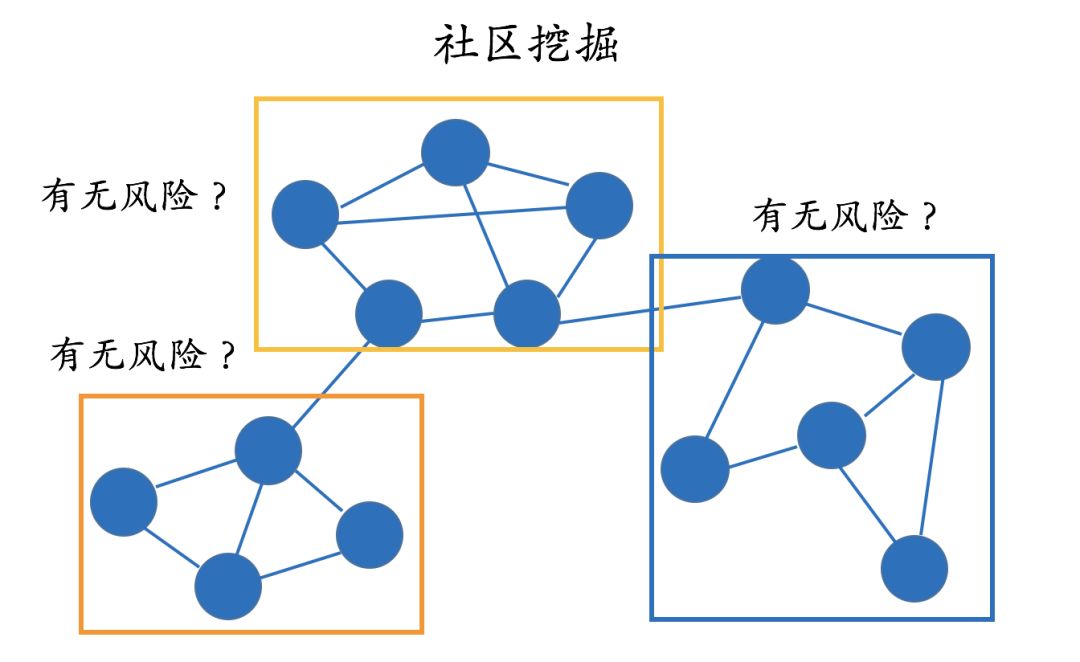
The purpose of community mining algorithms is to identify communities within the graph. There are various definitions of communities, but intuitively, one can understand that the density of relationships among nodes within a community is significantly greater than the density of relationships between communities. The diagram below shows the results after community discovery, where a total of three different communities are marked. Once we identify these communities, we can conduct further risk analysis.
Since community mining is based on probability methodologies, its advantage is that it does not require manual definition of rules, which is particularly complex for a large relationship network.
 The core idea of the label propagation algorithm is the transmission of information between nodes. This is similar to the principle that being with excellent individuals will gradually make oneself better. Through this relationship, one continuously absorbs high-quality information, ultimately leading to an unconscious enhancement of oneself. Specific details are not further explained here.
Compared to rule-based methodologies, the downside of probability-based methodologies is that they require a sufficiently large dataset. If the data volume is small and the entire graph is relatively sparse, rule-based methods can become our first choice. Especially in the financial field, data labels tend to be scarce, which is why rule-based methodologies are still more commonly applied in the financial sector.
Analysis Based on Dynamic Networks
All the above analyses are based on static relationship graphs. A static relationship graph means that we do not consider changes in the graph structure over time; we focus solely on the current structure of the knowledge graph. However, we also know that the structure of the graph changes over time, and these changes can be associated with risks.
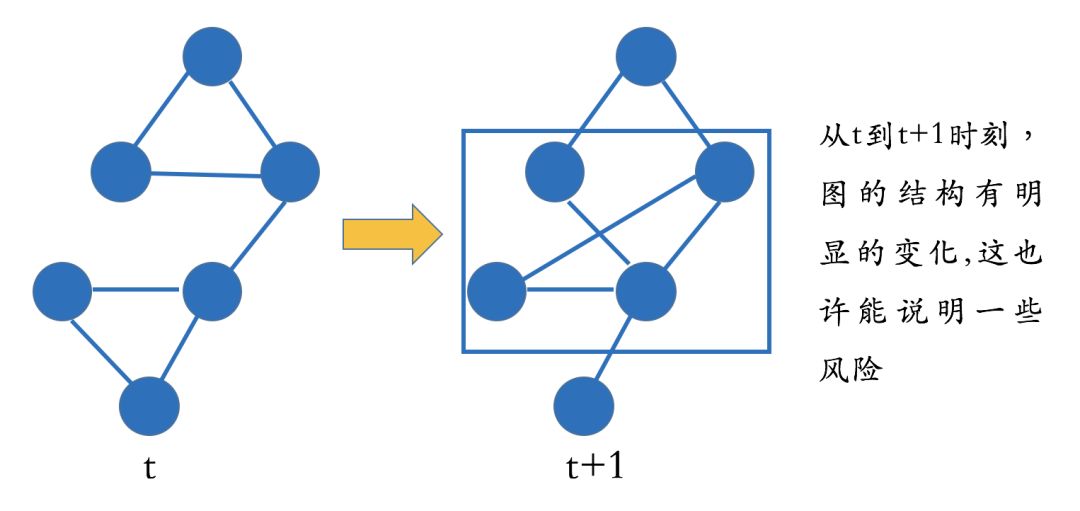
In the diagram below, we present the structure of a knowledge graph at time T and at time T+1, and we can easily see that there have been significant changes in the graph structure (or part of the structure) between these two moments, which actually suggests potential risks. So how do we judge these structural changes? Interested readers can refer to literature related to “dynamic network mining”.
Applications of Knowledge Graphs in Other Industries
In addition to the financial sector, the application of knowledge graphs can extend to many other industries, including healthcare, education, securities investment, recommendations, etc. In fact, as long as relationships exist, there are places where knowledge graphs can provide value. Here are a few examples of applications in vertical industries.
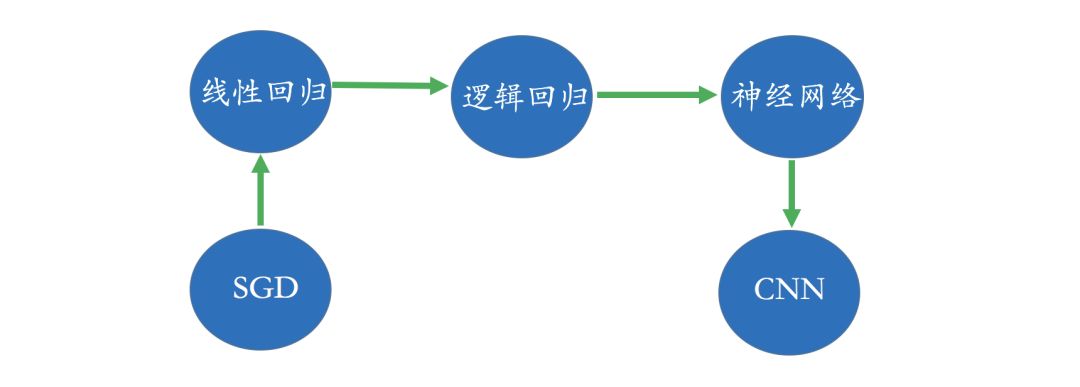
For example, in the education sector, we often discuss personalized education and tailored teaching concepts. The core lies in understanding the current knowledge system of students, which relies on the data we obtain, such as interaction data, assessment data, interaction data, etc. To analyze learning paths and knowledge structures, we need a conceptual knowledge graph for a specific field, simply put, a conceptual topology. In the diagram below, we present a very simple conceptual graph: for example, to learn logistic regression, one must first understand linear regression; to learn CNN, one must have an understanding of neural networks, etc. All assessments and interaction analyses of students are inextricably linked to this underlying data of the conceptual graph.
In the securities field, we often care about questions like “What impact does an event have on which companies?” For example, if there is negative news about an executive of Company 1, and we know that Company 1 has a close cooperative relationship with Company 2, and Company 2 has a main product made from raw materials provided by Company 3.
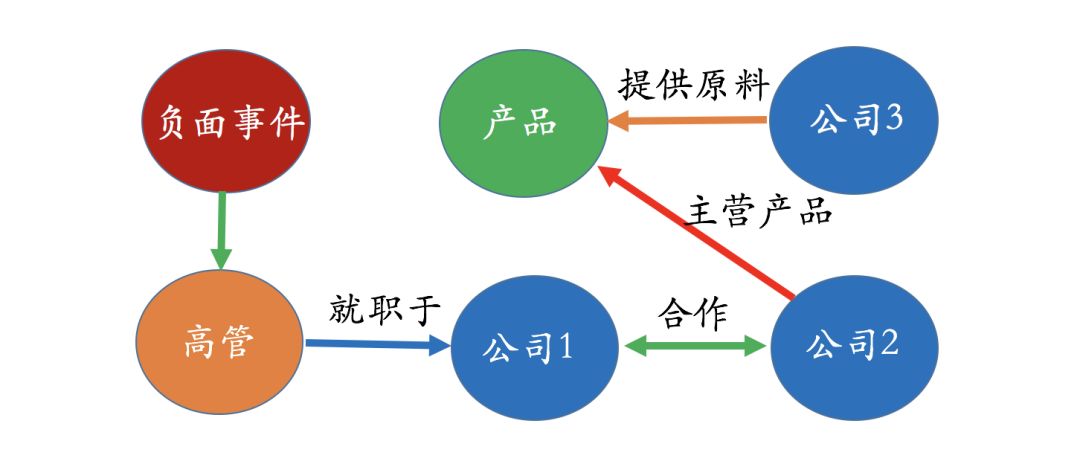
With such a knowledge graph, we can easily answer which companies may be affected by this negative event. Of course, it is only “possible”; whether there is a strong correlation must be verified by data. Thus, the benefit of the knowledge graph is that it quickly delineates the scope we need to focus on. The next question becomes more complex; for instance, since we know that Company 3 may be affected by this event, how significant is the impact? This question cannot be answered solely by the knowledge graph; it requires an impact model and some historical data for further reasoning and calculation within the knowledge graph.
Practical Suggestions
First, knowledge graphs are relatively new tools, and their main role lies in analyzing relationships, especially deep relationships. Therefore, in business, it is essential to ensure its necessity; many problems can be solved without using knowledge graphs.
One of the most important topics in the field of knowledge graphs is knowledge reasoning. Moreover, knowledge reasoning is a necessary path towards strong artificial intelligence. However, it is regrettable that many reasoning techniques discussed from the perspective of semantic networks (such as deep learning, probability statistics) are challenging to implement in practical vertical applications. In fact, the most effective approach currently remains rule-based methodologies, unless we have a very large dataset.
Finally, it is crucial to emphasize that the engineering of knowledge graphs should still center on the business and be data-centric. Do not underestimate the importance of business and data.
Conclusion
Knowledge graphs are a field that is both challenging and fascinating. As long as there are appropriate application scenarios, we can expect the value that knowledge graphs can provide. I believe that within the next two to three years, knowledge graph technology will be popularized across various fields.


Inclusive and Pursuing Excellence
Open-minded and Wise, Magnanimous and Humble
Shanghai Financial Information Industry Association
Official Website: http://sfia.org.cn/
We welcome everyone to scan the QR code to follow us