Skip to content
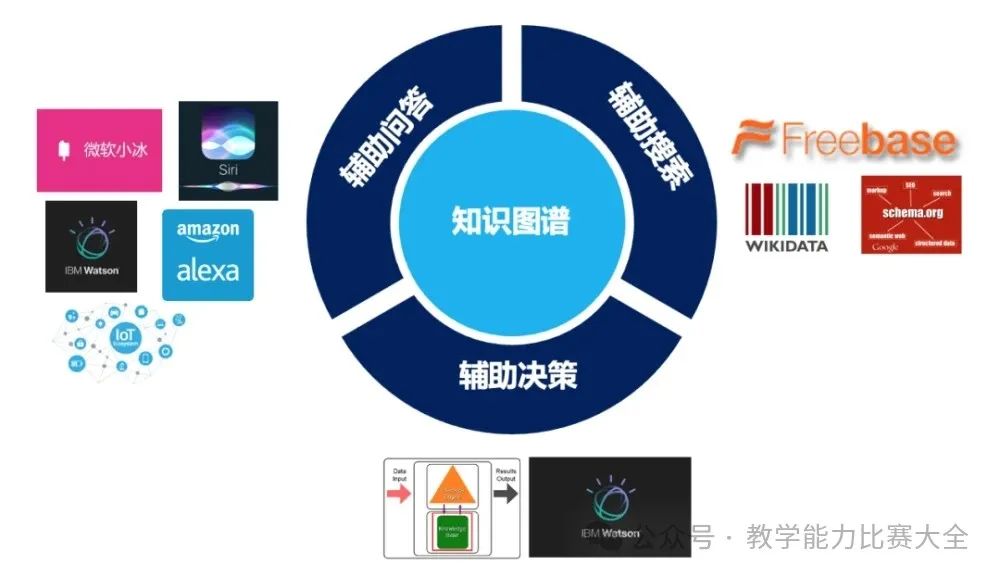
Knowledge graphs have many applications, such as intelligent search, question-answering systems, recommendation systems, and information extraction. They can help people better organize and utilize vast amounts of knowledge, providing smarter and more personalized services. The concept of knowledge graphs originated in the field of artificial intelligence and is a technique used to represent and organize knowledge. Its development can be traced back to the 1960s. Below is an overview of the origin and development of knowledge graphs and their applications in the education sector:
1. Origin and Development:
1960s: The concept of knowledge graphs was first proposed by computer scientist John F. Sowa. He defined knowledge graphs as a representation method for structuring entities, concepts, and relationships in the real world to support computer reasoning and problem-solving.
1990s: With the development of semantic networks and ontologies, the concept of knowledge graphs gradually deepened. Researchers began to explore how to construct more complex and expressive knowledge graphs using more precise semantic representations.
2000s: With the popularity of the internet, the accumulation of large amounts of data made the construction of knowledge graphs more feasible. Google’s Knowledge Graph project was launched in 2012, marking the entry of knowledge graphs into the public eye.
Late 2010s: With the rapid development of artificial intelligence and natural language processing technologies, knowledge graphs have been further enhanced and expanded. OpenAI’s GPT series models (such as GPT-3) also encompass the concept of knowledge graphs to a certain extent.
As a technique for representing and organizing knowledge, knowledge graphs have played an important role in the education sector. With the continuous development of artificial intelligence technologies, they will continue to play a greater role in education, supporting innovations in personalized learning, intelligent tutoring, and educational management.
Applications in the Education Sector:
– Early Applications: Knowledge graphs were first used to build education systems based on textbook knowledge, helping students better understand course content. These systems attempted to map course knowledge onto a hierarchical knowledge graph, facilitating students’ learning at their own pace.
– Personalized Learning: With technological advancements, knowledge graphs are used to achieve personalized learning. By analyzing students’ learning histories, interests, and abilities, systems can recommend suitable learning resources and paths based on students’ needs and characteristics.
– Learning Resource Management: Knowledge graphs are also used in education to manage learning resources. Educational institutions can label textbooks, courses, and other learning resources with specific concepts and relationships, making it easier for students to search, access, and understand these resources.
– Intelligent Tutoring and Q&A: Intelligent tutoring systems based on knowledge graphs can answer students’ questions and provide explanations and guidance. These systems can retrieve relevant knowledge points and answers from the knowledge graph based on students’ inquiries.
– Educational Assessment and Monitoring: Knowledge graphs can be used for educational assessment and monitoring of students’ learning progress and performance. Educators can assess students’ knowledge mastery based on their learning trajectories on the knowledge graph.
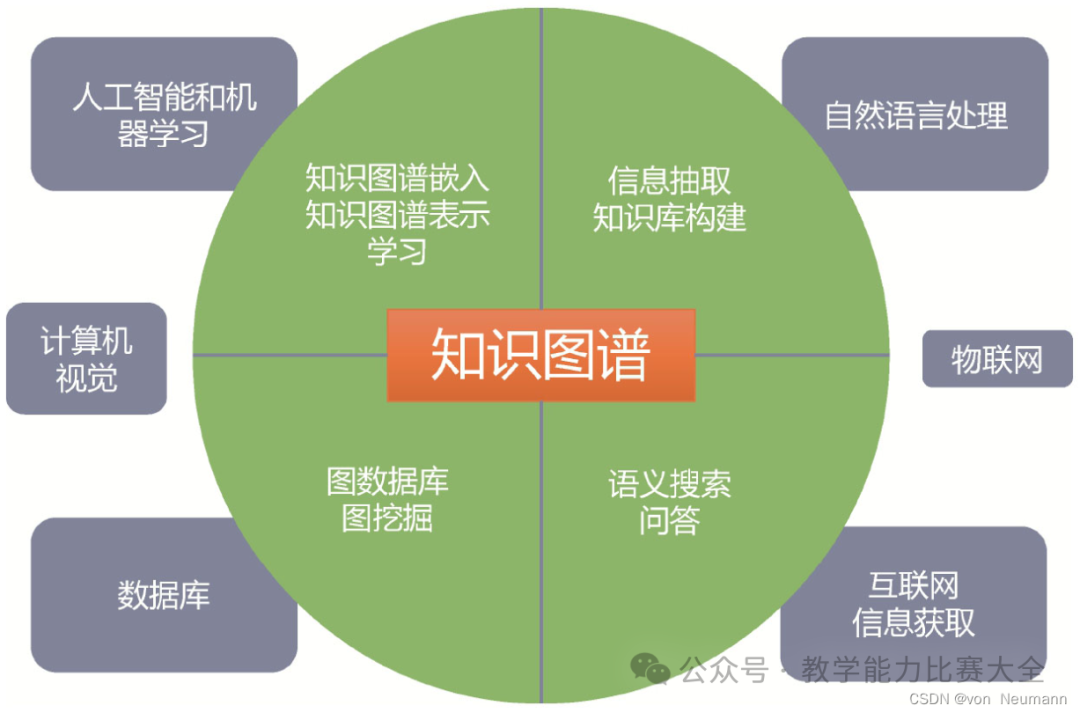
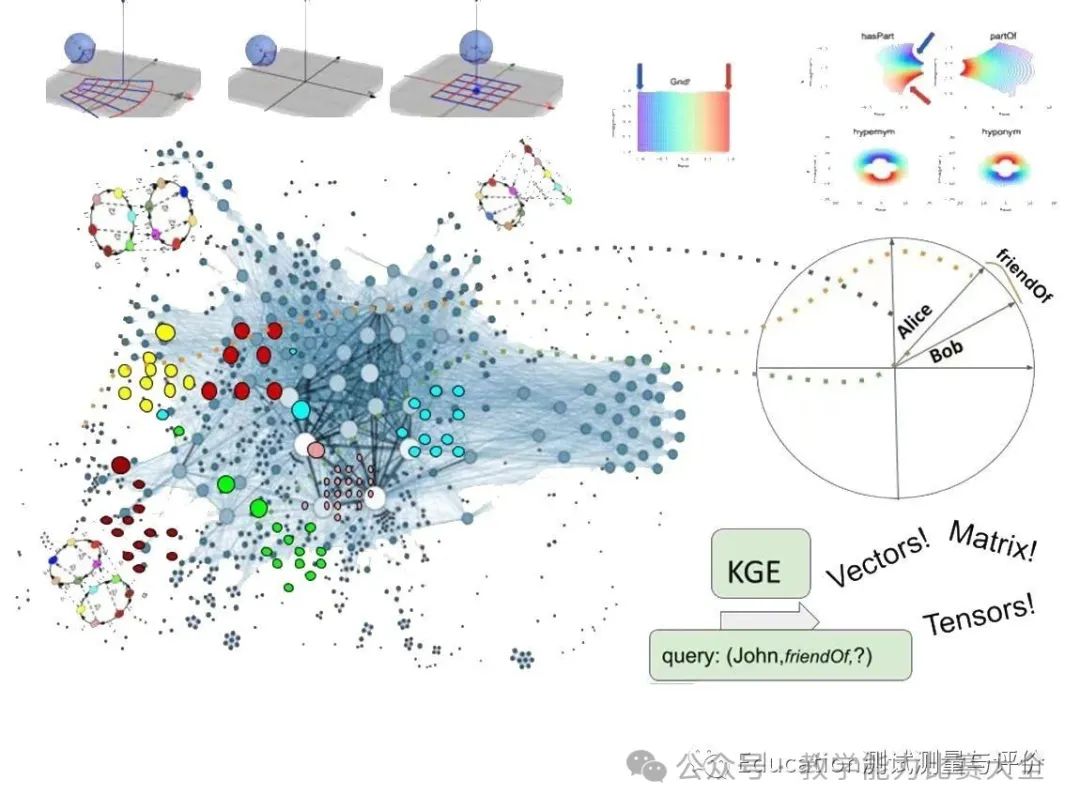
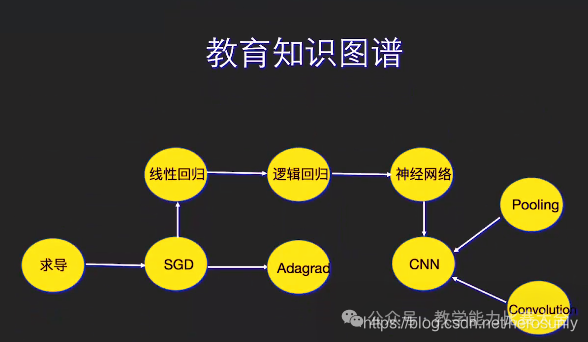
2. Knowledge graphs are a structured method for representing and organizing knowledge. They present knowledge in the form of a graph, where nodes represent entities or concepts, and edges represent relationships between entities. Knowledge graphs can include various types of knowledge, including attributes of entities, relationships, events, etc.
The construction process of a knowledge graph generally includes the following steps:
1. Data Collection: Collect raw data from various sources (such as the internet, databases, documents, etc.). 2. Data Cleaning: Clean, deduplicate, and standardize the raw data for subsequent processing and analysis. 3. Entity Extraction: Identify entities from the cleaned data and classify and name them. 4. Relationship Extraction: Extract relationships between entities based on semantic rules and machine learning algorithms. 5. Knowledge Representation: Represent entities and relationships in the form of a graph and store them in a graph database. 6. Knowledge Reasoning: Conduct reasoning and inference based on the structure and rules of the knowledge graph to mine hidden knowledge from the data. 7. Application Development: Develop applications based on the knowledge graph, such as question-answering systems, recommendation systems, intelligent search, etc.
3. Educational Knowledge Graphs are built on the foundation of knowledge and concepts in the education sector. They focus on entities and relationships relevant to the teaching process and the education sector, used to organize, manage, and apply teaching resources and knowledge. The application of educational knowledge graphs can help improve teaching effectiveness and personalized teaching services, including personalized learning recommendations, intelligent tutoring systems, teaching resource management, and sharing. They can help educators better understand and utilize teaching resources and knowledge, providing effective educational support.
1. Teaching Resource Modeling: Classify, label, and organize teaching resources, including textbooks, course materials, and exam questions. 2. Teaching Concept Extraction: Extract key concepts and subject knowledge from textbooks and course outlines. 3. Knowledge Association Extraction: Analyze teaching resources and student learning records to extract associations and dependencies between knowledge. 4. Learning Path Recommendation: Recommend suitable learning paths and resources based on students’ learning progress and interests through the knowledge graph. 5. Teaching Assessment Analysis: Analyze and assess students’ learning processes and performance based on the knowledge graph, providing personalized teaching support and auxiliary decision-making for teachers. 6. Teaching Process Optimization: Monitor and analyze the teaching process through the knowledge graph, providing optimization suggestions for teachers’ teaching behaviors.
 4. Education assessment and monitoring based on knowledge graphs is a method that utilizes knowledge graph technology to help educators understand students’ learning progress, knowledge mastery, and teaching effectiveness. This method uses information such as concepts, relationships, and learning paths in the knowledge graph to provide educators with more comprehensive and personalized assessment and monitoring tools. Education assessment and monitoring based on knowledge graphs can provide educators with deeper, personalized insights into students, supporting teaching optimization and improvement. This method helps create a more intelligent and adaptive educational environment.
1. Learning Trajectory Analysis: Educators can analyze students’ learning paths and histories on the knowledge graph to understand their learning habits, interests, and progress. This helps identify potential difficulties students may encounter and adjust teaching strategies to improve learning outcomes.
2. Knowledge Mastery Assessment: Knowledge graphs can decompose course content into different knowledge points and establish their dependencies. Educators can assess students’ mastery of different knowledge points based on their performance on the knowledge graph. This helps more accurately identify students’ weaknesses and strengths.
3. Personalized Suggestions and Feedback: Systems based on knowledge graphs can provide personalized learning suggestions and feedback for each student based on their learning history and data on the knowledge graph. These suggestions may include suitable learning resources, practice questions, and supplementary materials.
4. Intelligent Teaching Design: Knowledge graphs can reveal important concepts and key dependencies in course content, allowing educators to optimize teaching design based on this information. They can more strategically arrange course progress to ensure students learn along the correct knowledge paths.
5. Educational Data Analysis: Knowledge graphs can integrate various educational data, including students’ academic performance, behavioral data, etc. By analyzing this data, educators can better understand students’ learning characteristics and trends, leading to more informed educational decisions.
6. Predicting Learning Outcomes: Analysis based on knowledge graphs can help educators predict students’ future learning outcomes. By identifying possible learning paths and development trends, educators can take proactive measures to prevent learning difficulties or setbacks.
7. Teaching Improvement and Optimization: Educators can make teaching improvements and optimizations based on the assessment results from knowledge graphs, addressing issues within courses. They can rearrange the order of explaining knowledge points, design more engaging learning activities to enhance student participation and learning outcomes.
The applications of knowledge graphs in education mainly include the following aspects:
1. Course Design and Planning: Utilize knowledge graphs to integrate and organize knowledge resources in the education sector, helping teachers design and plan course content. Knowledge graphs can clearly represent knowledge points and their relationships, providing reference and guidance for teachers. Software tools like CmapTools and LucidChart can support teachers in course design and planning.
2. Personalized Teaching: Use knowledge graphs to analyze students’ learning situations and paths, providing personalized learning recommendations and guidance based on students’ characteristics and needs. Knowledge graphs can help educational institutions establish students’ knowledge models and learning trajectories, forming the foundation for personalized teaching. Some software tools like Smart Sparrow and Knewton can support personalized teaching.
3. Learning Resource Recommendations: Based on knowledge graphs, analyze the associations and similarities between learning resources to provide personalized learning resource recommendations for students. By matching the characteristics of students and learning resources, students can better choose suitable learning resources. Some software tools like EdTechX and Koovea can support learning resource recommendations.
4. Learning Assessment and Feedback: Through knowledge graphs, analyze and assess students’ learning situations to provide teachers with insights into students’ learning progress and personalized feedback. Teachers can understand students’ learning conditions and difficulties based on the knowledge graph, offering targeted guidance and support. Software tools like Graspable Math and EdModo can support learning assessment and feedback.
5. Subject Modeling and Knowledge Discovery: Utilize knowledge graphs to model and analyze subject knowledge, discovering core concepts, relationships, and important resources within subjects. This helps understand the essence and structure of subjects, providing better learning support for teachers and students. Software tools like Gephi and VOSviewer can support subject modeling and knowledge discovery.
Edmodo is a comprehensive platform for educational collaboration, learning, and management. Teachers can better organize course content, interact with students, and provide learning support using Edmodo; students can participate in courses, access learning resources, and interact with classmates and teachers on the platform; parents can understand their children’s learning situations and maintain communication with educators. Edmodo is an educational technology platform aimed at providing a collaborative and learning virtual space for educators, students, and parents. It combines the functions of social networking and educational tools, enabling teachers to create courses, post assignments, and provide learning resources, while students can engage in classroom activities and interact with classmates, and parents can understand their children’s learning progress.
4. Education assessment and monitoring based on knowledge graphs is a method that utilizes knowledge graph technology to help educators understand students’ learning progress, knowledge mastery, and teaching effectiveness. This method uses information such as concepts, relationships, and learning paths in the knowledge graph to provide educators with more comprehensive and personalized assessment and monitoring tools. Education assessment and monitoring based on knowledge graphs can provide educators with deeper, personalized insights into students, supporting teaching optimization and improvement. This method helps create a more intelligent and adaptive educational environment.
1. Learning Trajectory Analysis: Educators can analyze students’ learning paths and histories on the knowledge graph to understand their learning habits, interests, and progress. This helps identify potential difficulties students may encounter and adjust teaching strategies to improve learning outcomes.
2. Knowledge Mastery Assessment: Knowledge graphs can decompose course content into different knowledge points and establish their dependencies. Educators can assess students’ mastery of different knowledge points based on their performance on the knowledge graph. This helps more accurately identify students’ weaknesses and strengths.
3. Personalized Suggestions and Feedback: Systems based on knowledge graphs can provide personalized learning suggestions and feedback for each student based on their learning history and data on the knowledge graph. These suggestions may include suitable learning resources, practice questions, and supplementary materials.
4. Intelligent Teaching Design: Knowledge graphs can reveal important concepts and key dependencies in course content, allowing educators to optimize teaching design based on this information. They can more strategically arrange course progress to ensure students learn along the correct knowledge paths.
5. Educational Data Analysis: Knowledge graphs can integrate various educational data, including students’ academic performance, behavioral data, etc. By analyzing this data, educators can better understand students’ learning characteristics and trends, leading to more informed educational decisions.
6. Predicting Learning Outcomes: Analysis based on knowledge graphs can help educators predict students’ future learning outcomes. By identifying possible learning paths and development trends, educators can take proactive measures to prevent learning difficulties or setbacks.
7. Teaching Improvement and Optimization: Educators can make teaching improvements and optimizations based on the assessment results from knowledge graphs, addressing issues within courses. They can rearrange the order of explaining knowledge points, design more engaging learning activities to enhance student participation and learning outcomes.
The applications of knowledge graphs in education mainly include the following aspects:
1. Course Design and Planning: Utilize knowledge graphs to integrate and organize knowledge resources in the education sector, helping teachers design and plan course content. Knowledge graphs can clearly represent knowledge points and their relationships, providing reference and guidance for teachers. Software tools like CmapTools and LucidChart can support teachers in course design and planning.
2. Personalized Teaching: Use knowledge graphs to analyze students’ learning situations and paths, providing personalized learning recommendations and guidance based on students’ characteristics and needs. Knowledge graphs can help educational institutions establish students’ knowledge models and learning trajectories, forming the foundation for personalized teaching. Some software tools like Smart Sparrow and Knewton can support personalized teaching.
3. Learning Resource Recommendations: Based on knowledge graphs, analyze the associations and similarities between learning resources to provide personalized learning resource recommendations for students. By matching the characteristics of students and learning resources, students can better choose suitable learning resources. Some software tools like EdTechX and Koovea can support learning resource recommendations.
4. Learning Assessment and Feedback: Through knowledge graphs, analyze and assess students’ learning situations to provide teachers with insights into students’ learning progress and personalized feedback. Teachers can understand students’ learning conditions and difficulties based on the knowledge graph, offering targeted guidance and support. Software tools like Graspable Math and EdModo can support learning assessment and feedback.
5. Subject Modeling and Knowledge Discovery: Utilize knowledge graphs to model and analyze subject knowledge, discovering core concepts, relationships, and important resources within subjects. This helps understand the essence and structure of subjects, providing better learning support for teachers and students. Software tools like Gephi and VOSviewer can support subject modeling and knowledge discovery.
Edmodo is a comprehensive platform for educational collaboration, learning, and management. Teachers can better organize course content, interact with students, and provide learning support using Edmodo; students can participate in courses, access learning resources, and interact with classmates and teachers on the platform; parents can understand their children’s learning situations and maintain communication with educators. Edmodo is an educational technology platform aimed at providing a collaborative and learning virtual space for educators, students, and parents. It combines the functions of social networking and educational tools, enabling teachers to create courses, post assignments, and provide learning resources, while students can engage in classroom activities and interact with classmates, and parents can understand their children’s learning progress.
1. Virtual Classrooms: Teachers can create virtual classroom spaces, creating a dedicated page for each course. On this page, teachers can publish course-related content, such as syllabi, learning materials, assignments, etc. 2. Assignments and Quizzes: Teachers can post assignments, quizzes, and surveys on the Edmodo platform. Students can submit assignments online, and teachers can grade and provide feedback. This also helps teachers better track students’ learning progress. 3. Resource Sharing: Teachers can share learning resources on the platform, such as course materials, documents, videos, etc. This helps students engage in self-directed learning outside of class while also making it easier for teachers to provide additional support materials for courses. 4. Discussions and Interaction: Students can engage in discussions and interactions on course pages. They can post, comment on other posts, and engage in academic and course-related discussions with classmates and teachers. 5. Parental Involvement: Parents can use the Edmodo platform to understand their children’s courses and learning progress. Teachers can communicate with parents, sharing students’ grades and assignment statuses. 6. Security and Privacy: Edmodo focuses on the education sector, providing a secure environment to ensure the privacy of students and educators is protected. 7. Mobile Application: Edmodo offers a mobile application, allowing users to access the platform anytime, anywhere to view courses, participate in discussions, submit assignments, etc.
To obtain the Edmodo software:
1. Visit the official website: Open your browser and enter the Edmodo official website URL: [https://www.edmodo.com/](https://www.edmodo.com/).
2. Register an account: Click the “Sign up” button at the top of the website and fill in your personal information as instructed to create an account. You can choose to register as a teacher, student, or parent.
3. Choose account type: Once you have successfully registered, the system will ask you to select an account type. You can choose to create a teacher account, student account, or parent account based on your role.
4. Log in to your account: Use the username and password you just registered to log in to your Edmodo account. If you forget your password, you can use the password recovery function to reset it.
5. Download the mobile application: If you wish to use Edmodo on mobile devices, you can go to the app store (such as the App Store or Google Play) and search for “Edmodo” to download and install the official Edmodo mobile application.
If you are a student, you may need to obtain instructions from your teacher or school to get an Edmodo account. In some cases, schools may have already created an Edmodo account to serve the student community. If you are a teacher, you can create your own courses and classes after registration. Edmodo is a platform for educational users. Before obtaining and using the Edmodo software, you may need to verify your identity as a teacher, student, or parent.
EDpuzzle is a very simple tool that teachers can use to create video content, insert audio, quizzes, video materials, etc. EDpuzzle supports online insertion of questions into videos, similar to videos in MOOCs, and can track answering situations. EDpuzzle allows online editing, online voiceover, and can freely use and save videos shared by others.
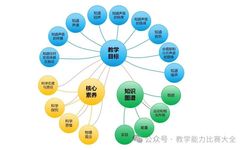
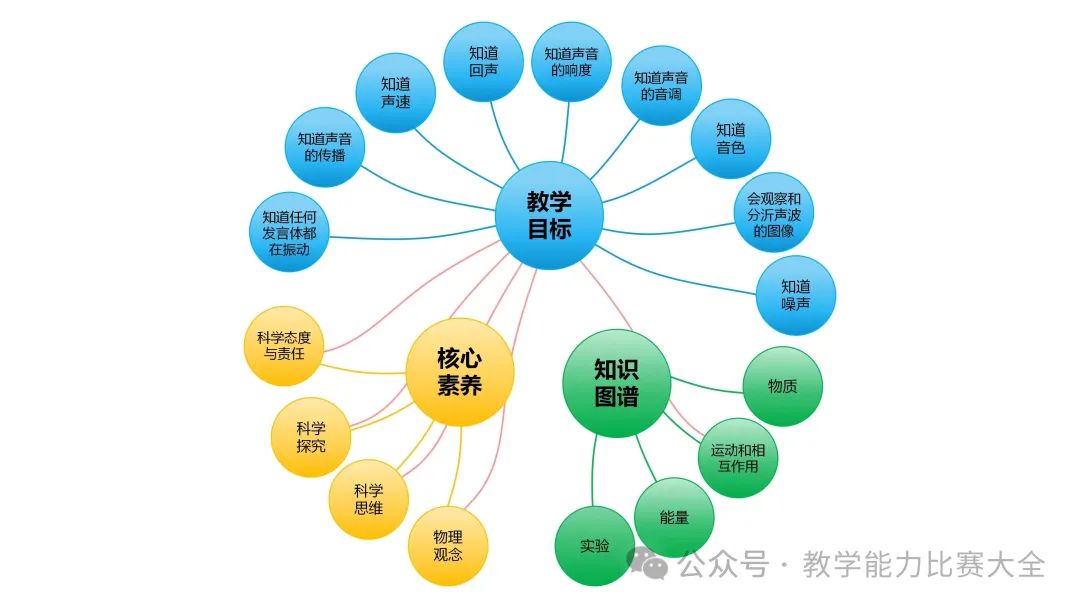
Knowledge graphs and mind maps are two different concepts and tools, but they have certain relationships in knowledge organization and expression. Knowledge graphs are a graph-based structure for representing and storing knowledge, focusing on entities (people, places, things, etc.) and the relationships between them, presenting knowledge according to semantic relationships. Knowledge graphs organize and represent knowledge in a structured, linked, and semantic manner, with wide applications in various fields, such as search engines, intelligent assistants, recommendation systems, etc. Mind maps are graphic tools used to organize and express thoughts. They visually represent themes and sub-themes and their relationships through a tree structure. Mind maps typically include a central theme node and related branch nodes, used to record, organize, and display ideas, concepts, keywords, etc., during the thought process. Although knowledge graphs and mind maps are different concepts and tools, they share some similarities in knowledge organization and visualization, supporting the organization, understanding, and transmission of knowledge. Despite being different tools, they have some commonalities in knowledge organization and visualization:
– Visual Representation: Both knowledge graphs and mind maps display information and relationships graphically, making complex knowledge structures clearer.
– Information Organization: Both help organize and arrange information, making it easier to understand and remember related knowledge points.
– Relationship Display: Both emphasize the relationships between entities, focusing on the connections and associations between knowledge elements.
– Non-linear Structure: Both are not limited to linear arrangements and can flexibly display and expand knowledge structures.
Reprinted from: Education Testing, Measurement, and Evaluation; reprinted for non-commercial purposes aimed at sharing. If there are any copyright issues, please contact us immediately, and we will change or delete related articles to protect your rights.