
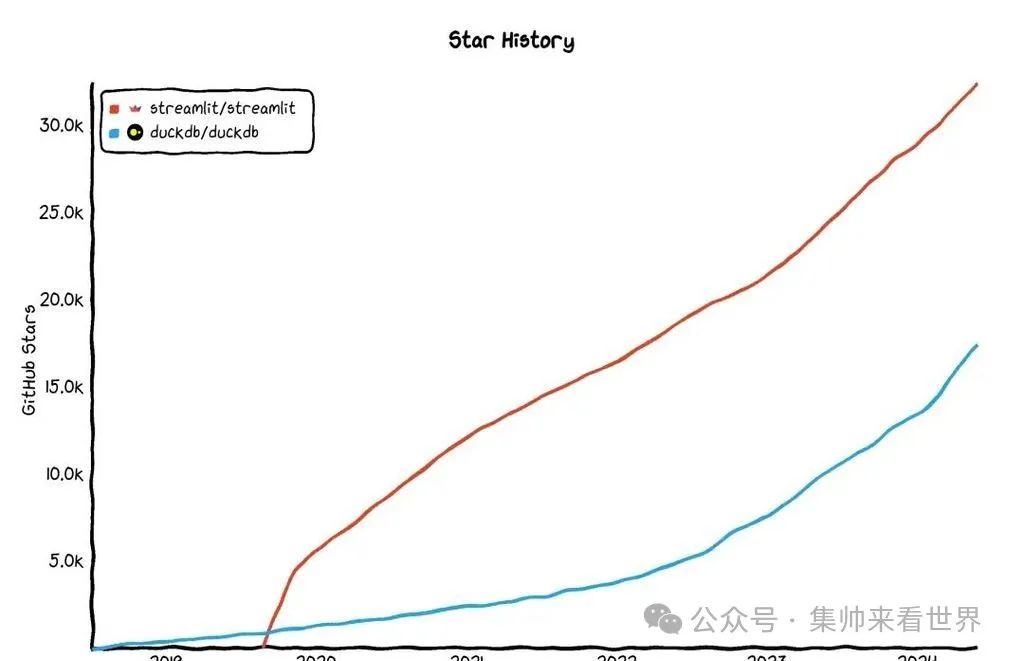
Streamlit is a Python library that allows you to quickly build data display web pages. It is simple to use, requiring no complex front-end code; just a few lines of Python can create beautiful interactive interfaces. It is particularly useful for showcasing data analysis and machine learning projects.

1.
Installation and Basic Usage
Installing Streamlit is super easy, just one command:
pip install streamlit
Once installed, create a Python file, for example, named app.py, and write some code:
import streamlit as st
st.title('My First Streamlit App')
st.write('Hello, World!')
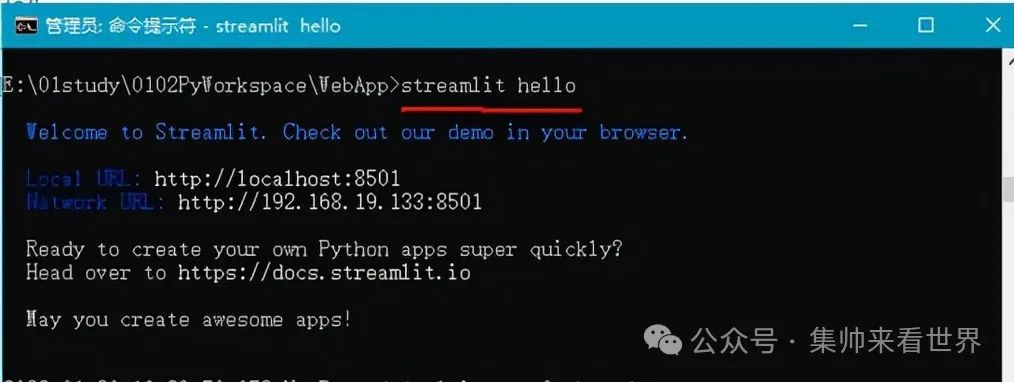
Then run it in the command line:
streamlit run app.py

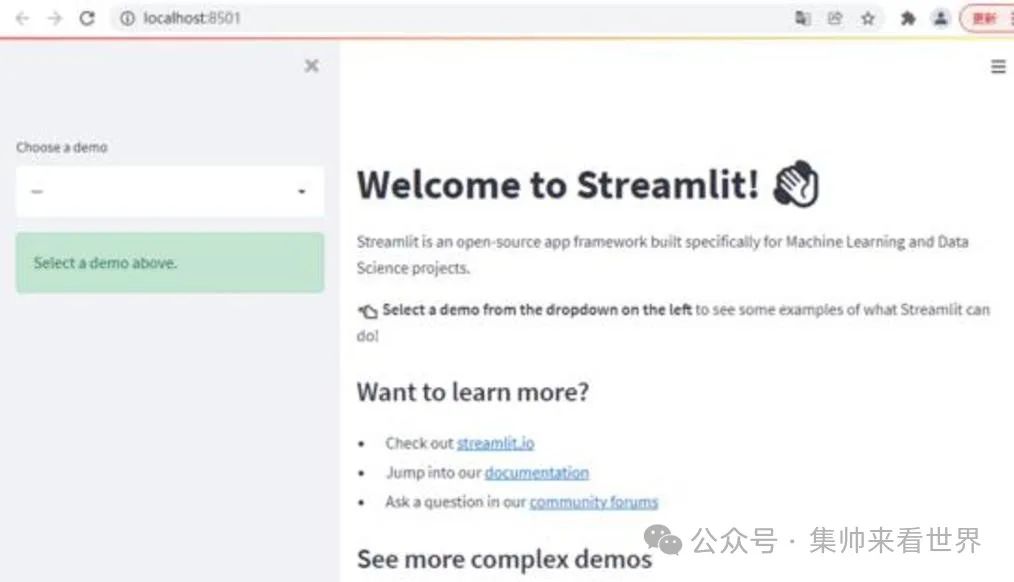
Then you can see your first Streamlit application! Isn’t it simple?

2.
Adding Various Components
Streamlit provides many ready-made components, making it easy to add various interactive elements.
Text Input
name = st.text_input('Please enter your name')
st.write(f'Hello, {name}!')
This allows users to input text and then displays a welcome message.
Slider
age = st.slider('Your Age', 0, 120, 25)
st.write(f'You selected the age: {age} years old')
The slider allows users to choose a value, which is especially suitable for adjusting parameters.
Checkbox
if st.checkbox('Show more information'):
    st.write('Here is more information...')

The checkbox can control whether to display certain content, which is very practical.
Tip: Streamlit’s components are updated in real-time; when you change the input, the page will refresh immediately without needing to click a submit button.

3.
Displaying Data
Streamlit has also put effort into data display.
Table
import pandas as pd
df = pd.DataFrame({
    'Name': ['Zhang San', 'Li Si', 'Wang Wu'],
    'Age': [25, 30, 35],
    'City': ['Beijing', 'Shanghai', 'Guangzhou']
})
st.table(df)
This will display a beautiful table that can also be sorted automatically.
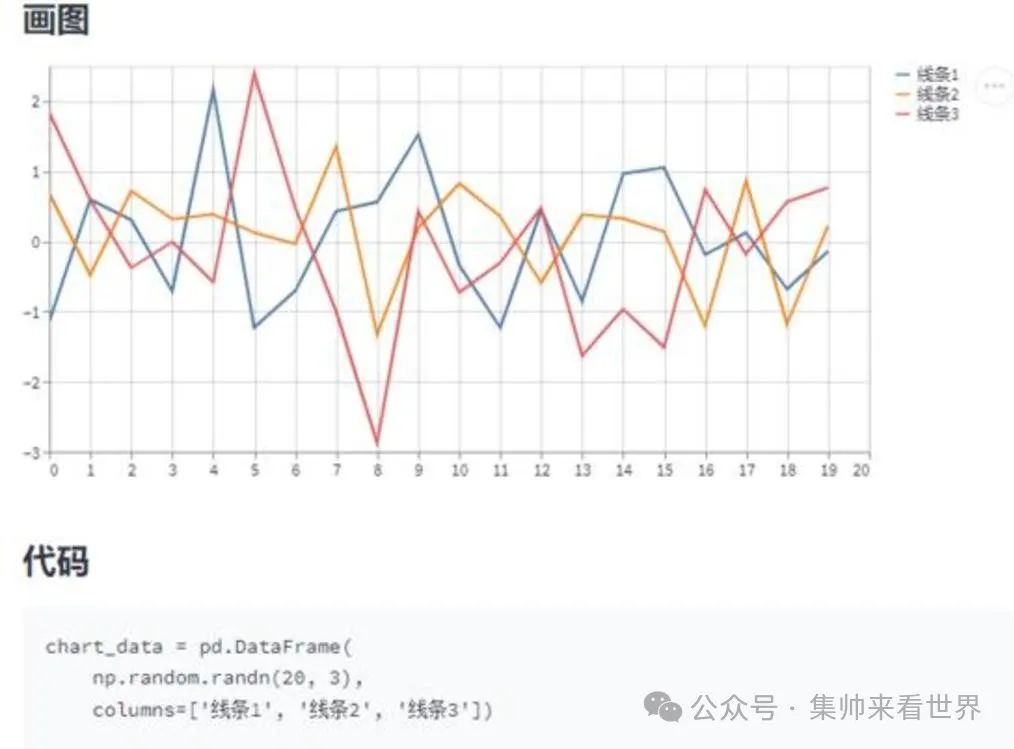
Chart
import matplotlib.pyplot as plt
fig, ax = plt.subplots()
ax.plot([1, 2, 3, 4], [1, 4, 2, 3])
st.pyplot(fig)
Using a chart created with matplotlib, you can directly display it with st.pyplot(), simple and straightforward.
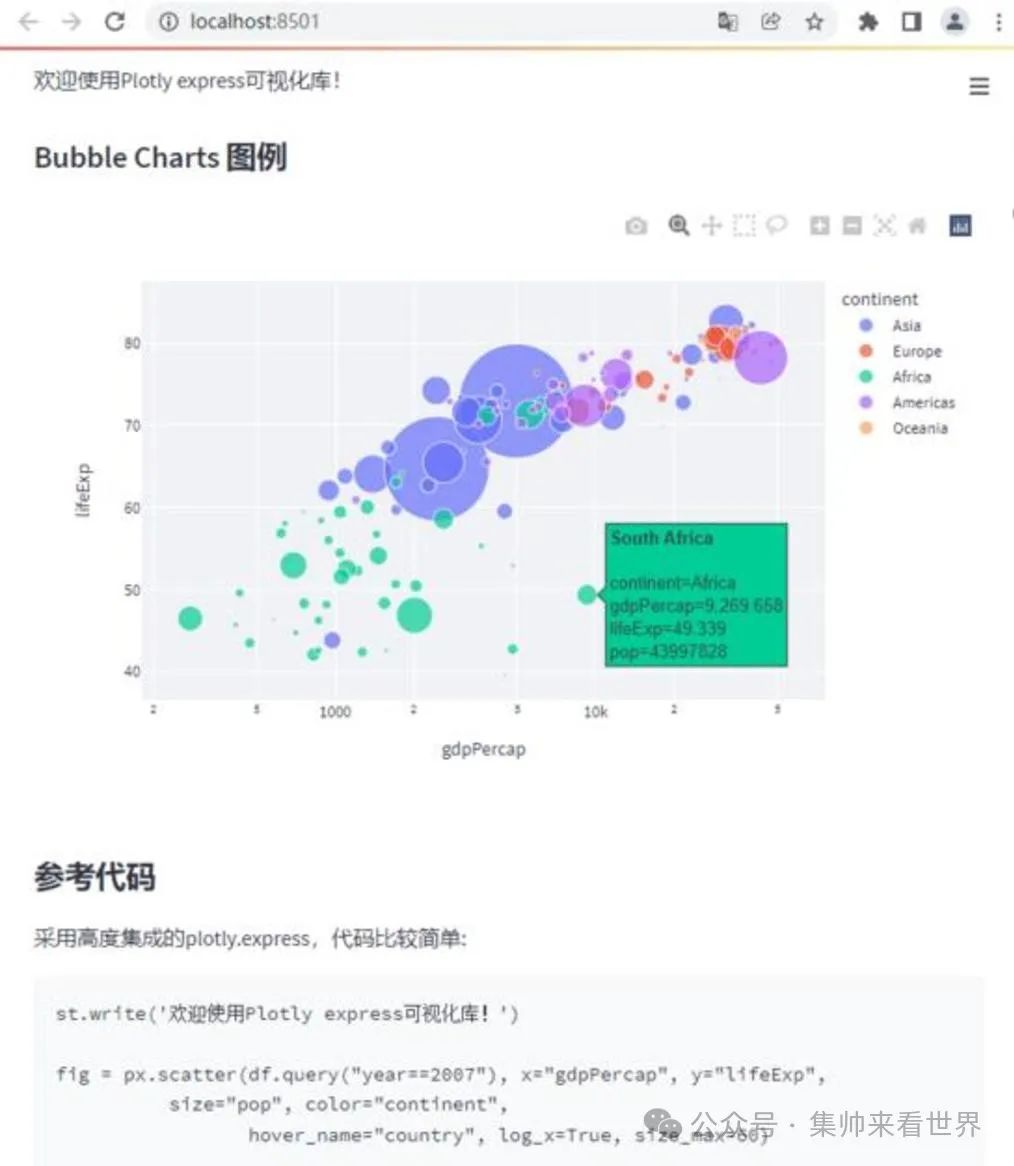
Streamlit also supports other popular chart libraries, such as Plotly and Altair, so you can use whichever you prefer.

4.
Layout Techniques
Streamlit defaults to a vertical stacking layout, but it also provides some methods to adjust the layout.
Sidebar
st.sidebar.title('Sidebar')
option = st.sidebar.selectbox('Select an option', ['Option 1', 'Option 2', 'Option 3'])
The sidebar is suitable for placing control options, making the main page neater.
Column Layout
col1, col2 = st.columns(2)
with col1:
    st.write('This is the left column')
with col2:
    st.write('This is the right column')
This allows you to split the page into two columns, each displaying different content.
Tip: Using
st.empty()creates a placeholder that can be updated later, which is great for dynamic updates.

5.
Advanced Features
Streamlit also has many advanced features, such as caching, session state, and custom components. I won’t go into detail here; if you are interested, you can check the official documentation.
Streamlit is truly a powerful tool, especially suitable for quickly prototyping or building internal tools. I have used it for several projects myself, and it has significantly improved my efficiency.
However, it is important to note that Streamlit is primarily designed for rapid development; if your application requires very complex interactions or highly customized interfaces, you may still need to use traditional web frameworks.
If you are a data scientist or machine learning engineer, Streamlit is definitely worth a try. It can turn your code into a beautiful web application quickly, making it easier to showcase and share your work.
Alright, that’s all for today. Streamlit has many interesting features waiting for you to explore! Remember, practice makes perfect, write more code, and you will find that the fun of Streamlit goes far beyond this. Have fun!
Share this so more people can see it.