Mainly to train a stock selection model using 2000 stock selection factors as input features, with returns as labels, to train the LSTM model to predict stocks with higher returns on a future trading day.This article mainly introduces the data processing and model building parts, and analyzes different standardization techniques in detail.
2. Data Processing
2.1 Handling Missing Values
For the suspension days and missing values in the data, previous value filling and next value filling were used respectively.
2.2 Data Standardization
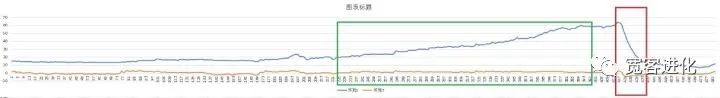
The dimensions of various input features are different. To ensure the training effect of the model, standardization is required. The standardization methods used are:Among them, mean is the mean, and std is the standard deviation.During the data standardization process, three standardization methods were considered, but finally, fixed window standardization was chosen. Below is a comparison of various standardization methods and the reasons for the choice:(1) Rolling StandardizationDefinition: Set a rolling window, calculate the mean and standard deviation based on all data within the window each time, then standardize the last value, slide back one unit, and continue standardizing the newly added values in the window.Operation: Select the data of a certain stock within a period for rolling standardization, with a rolling window size of 40 days. The comparison results are shown in the figure below:
Phenomenon: The blue curve represents the data before standardization, and the orange curve represents the data after standardization. Overall, the stock price changes from a slow rise to a rapid decline, but after standardization, the curve’s change trend weakens. In the green box, the original data shows a slow upward trend, but after standardization, it shows a slow downward trend; in the red box, the original data is in a continuous downward trend, while after standardization, it shows a trend of first declining and then rising.
Reason: Using rolling window standardization, the current value is related to its previous 40 values. When the original trend is rising, the values in the early stage of the rise are generally small, so the latest standardized value will be larger. In the late stage of the rise, the values in the window are generally large, so if the slow upward trend continues, the latest value will decrease after standardization, resulting in a downward trend. In the early stage of a rapid decline, all values in the window are generally large, so the latest standardized value will be smaller. In the late stage of the decline, as the decline slows down, all values are relatively small, while the latest value is relatively large, resulting in an upward trend. Finally, rolling standardization changes the original data’s change trend, so we decided to abandon the use of rolling standardization.
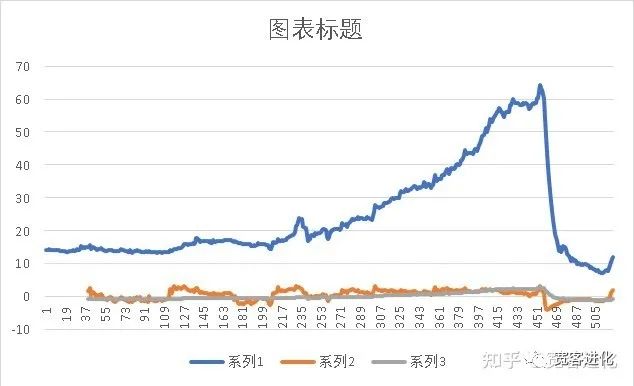
(2) Full Time Axis StandardizationDefinition: Calculate the mean and standard deviation over the entire time period, then standardize all values.Operation: Select the data of the aforementioned stock over the entire time period for standardization. The comparison results are shown in the figure below:
Phenomenon: The blue curve represents the original data, the gray curve represents the curve after full time axis standardization, and the orange curve represents the curve after rolling standardization. It can be seen that the curve after full time axis standardization is the flattest overall, only changing significantly during periods of obvious rapid decline.
Reason: Full time axis standardization considers global information and introduces future functions. Using all data to calculate the mean and variance can reflect the overall change trend over the entire time period, but it masks short-term change trends. For data that does not change significantly, i.e., data without large increases or decreases, it cannot predict short-term change trends well.
In the end, we also abandoned the use of the full time axis standardization method.
(3) Fixed Window StandardizationDefinition: Manually set a fixed window size, standardizing all data within the window each time, and then move the window size step forward to continue standardizing the data within the window.Compared to rolling window standardization, which only moves one step and standardizes one value each time, fixed window standardization can standardize the number of values equal to the window size each time, improving the efficiency of standardization; and compared to full time axis standardization, fixed window standardization can consider the change trend over a period of time, making it a compromise between the two standardization methods.However, the window size for this standardization method may be a crucial and difficult-to-determine value, which needs to be determined through multiple subsequent experiments to find the optimal window size.The final data standardization method adopted was fixed window standardization for 50 consecutive trading days. The processed feature dataframe and label dataframe were merged to form the final dataset, as shown in the table below, where the input features are a combination of three parts:
Features
Labels
Standardized features of 2000 factors along the time axis
Standardized features of high, open, low, close, and trading volume along the time axis
Standardized features of high, open, low, close, and trading volume along the daily cross-section
Normalized lr_3 returns along the time axis
Among them, standardization along the time axis can consider the change trend of a certain stock over a period, but cannot compare with the features of other stocks. Therefore, daily cross-section standardization was introduced, which refers to standardizing a certain feature of all stocks on a trading day. These two standardizations are one vertical and one horizontal.Since the number of 2000 factor features is too large, it will increase the complexity of the model, and the trained model’s generalization ability will be poor. Moreover, too many factors may correlate with each other, failing to meet the assumption of independent and identically distributed. Therefore, based on factor importance, we selected the top 80 factors with the highest importance.The final input data feature dimension is: 90 = 80(factor) + 5(time axis: high, open, low, close, trading volume) + 5(daily cross-section: high, open, low, close, trading volume)The label of the input data is lr_3 (returns over the next three days). The reason for using returns over the next three days instead of returns over the next day is that returns over the next day are often influenced by random factors, while returns over the next three days exhibit a more stable return trend.
3. Model Building
Training set: Data from 2011 to 2018Test set: Data from 2019 to 2020The input feature shape of the model is: [batch size = 128, sequence length = 50, number of features = 90]The input label shape of the model is: [batch size = 128, sequence length = 50]The model used is a basic single-layer unidirectional LSTM, followed by two fully connected layers. Adjusting the model parameters found little effect.
Follow the Quan Ke Evolution public account to learn more about synthetic data applications.
Beijing Quan Ke Evolution Technology Co., Ltd.
——Accelerating artificial intelligence with data intelligence
Content source: Quan Ke EvolutionDisclaimer: The content provided is sourced from the internet, WeChat public accounts, and other public channels. We maintain neutrality regarding the opinions expressed in the text, which are for reference and communication purposes only and not for commercial use. The copyright of the reproduced articles belongs to the original authors and organizations. If there is any infringement, please contact us for deletion.