Click the blue text
Follow us
/Abstract/
Background
Macrophages are the most common infiltrating immune cells in gliomas, exhibiting various pro-tumor and anti-tumor effects. However, the different subpopulations of macrophages and their impact on the tumor microenvironment remain unclear.
Methods
We combined new and previously published single-cell RNA sequencing data from 66 gliomas, analyzing 19,331 macrophages from a total of 98,015 single cells.
Results
Unsupervised clustering revealed a pro-tumor subpopulation of bone marrow-derived macrophages characterized by the scavenger receptor MARCO, which was found almost exclusively in IDH1 wild-type glioblastomas. Previous studies indicated that MARCO is a marker of tumor malignancy in melanoma and non-small cell lung cancer; in this study, we found that high MARCO expression correlates with poor prognosis and mesenchymal subtypes. Moreover, MARCO expression levels significantly changed in a treatment-dependent manner during anti-PD1 checkpoint inhibitor therapy, which we confirmed through immunofluorescence imaging.
Conclusion
These findings indicate the presence of a novel macrophage subpopulation in brain gliomas that drives the tumor progression of glioblastoma and may serve as a potential therapeutic target.
/Background/
Glioblastoma (GBM) is a refractory primary brain tumor. Despite standard treatments involving surgery, chemotherapy, and radiotherapy, GBM ultimately recurs, with a median survival of only about 16 months. One reason for the poor treatment outcomes is the complexity of the role of macrophages in the tumor microenvironment. While immunotherapy has been successful in various other cancers, the immunosuppressive microenvironment in GBM, including tumor-associated macrophages (TAMs), hinders the efficacy of immunotherapy. A recent study on checkpoint inhibitor therapy for GBM found an association between the infiltration of HLA class II-deficient macrophages and poor treatment response to immunotherapy.
Targeting these TAMs (e.g., using CSF1R inhibitors) is a potentially effective treatment strategy, but it requires a better understanding of the functional specificity and necessary markers of TAMs. Our traditional understanding of macrophage polarization (M1 vs. M2) is a generalized statement about macrophages in different polarized states; the actual situation is much more complex. Furthermore, in GBM, there are various monocyte lineage cells (commonly referred to as “macrophages”), including bone marrow-derived macrophages (BMDMs) recruited from the blood and tissue-resident microglia. Therefore, the specific markers and pathways involved in pro-tumor macrophages in GBM remain unclear.
Due to the diversity of cell types in the tumor microenvironment, tumor bulk expression profiles are not ideal for studying cell subpopulations. In contrast, single-cell RNA sequencing (scRNA-seq) has proven helpful in understanding the heterogeneity within GBM. In recent years, several scRNA-seq datasets have been published in gliomas, aiding in elucidating the general differences between BMDMs and microglial populations in the tumor microenvironment. However, each study had a limited number of patients. In this paper, we combined nine new scRNA-seq samples from glioblastomas with 57 previously published cases, exploring the distribution of macrophages in gliomas on an unprecedented scale. In the process, we identified a novel pro-tumor macrophage marker (MARCO) in GBM through immunofluorescence imaging. In addition to studying the clinical impact of MARCO expression levels on survival and immunotherapy, we also elucidated the relationship between MARCO expression levels and mesenchymal, hypoxic, and anti-inflammatory features.
/Methods/
Study Design and Data Collection
Published single-cell RNA sequence count matrices were obtained from multiple databases and combined with nine previously unpublished cases, forming a cohort of 50 GBM and 16 LGG samples (Supplementary File 1: Table S1). Tumor bulk expression profile data and survival data were obtained from 528 GBM patients in TCGA-GBM and 75 GBM cases from Wang et al. Expression subtypes and IDH1 mutation status of TCGA were obtained from Ceccarelli et al. Other gene sets were obtained from MSigDB v6.2, in addition to the BMDM microglial cell gene set from Yuan et al.
Single-Cell RNA Sequence
GBM samples were collected from surgical specimens of patients at Columbia University Irving Medical Center, approved by the Columbia Institutional Review Board (IRB-AAAJ6163), with informed consent from patients. Two different methods were used to dissociate tissue specimens into single-cell suspensions. PDC001, PJ052, PJ053, PW032-706All, and PW032-710 were dissociated using previously published methods by Yuan et al. Following the manufacturer’s instructions, adult brain dissociation kits (Miltenyi Biotec) were used to dissociate PW039-705, PW035-710All, PW016-703_All, and PW017-703_All into single cells on a gentle MACS Octo Dissociator (Miltenyi-Biotec) with a heater. As described by Yuan et al., single-cell suspensions were applied to a microplate-based automated platform for scRNA-seq library construction. The scRNA-seq libraries for PDC001, PW039-705, PW035-710All, PJ052, PJ053, PW016-703_All, and PW017-703_All were sequenced on the Illumina NextSeq 500 with an 8-base index read, where 21-base index read1 contained cell recognition barcodes (CBs) and unique molecular identifiers (UMIs), and 63-base read2 contained transcript sequences. As described by Yuan et al., raw sequencing data were processed to generate gene expression matrices. The scRNA-seq libraries for PW032-706All and PW032-710All were merged and sequenced on the Illumina NovaSeq 6000, with an 8-base index read, 26-base index read1 containing CBs and UMIs, and 91-base read2 containing transcript sequences.
scRNA-seq Processing
First, all datasets were filtered to remove mitochondrial and ribosomal proteins. The datasets were then merged (for GBM and LGG separately) while retaining the intersection of genes and discarding genes with zero total counts. The raw counts were normalized to log2(1+TPK), as described by Yuan et al. The expressed genes were used as a filtering list to reduce batch effects, intersecting with LM22 from CIBERSORT. For visualization, principal component analysis (PCA) was first applied to reduce the total dimensions to 5% of the number of genes, and then UMAP clustering was performed with default parameters to non-linearly reduce to two-dimensional data. Three cell types were identified using standard markers for macrophages, T lymphocytes, and tumor cells: CD14, CD3, and SOX2. Macrophages were isolated, and the same dimensionality reduction procedure was applied to generate macrophages. K-means clustering analysis was used to separate macrophage populations, with scores from k=2 to k=6, where k=2 provided the highest score. This filtering list was used to evaluate the enrichment gene sets characterizing each of the two macrophage clusters.
Immunofluorescence Imaging
To validate the presence of MARCO in GBM patient tissues, we used double-staining immunofluorescence (IF) to co-stain MARCO with CD163. Tissue specimens from one patient of each tumor subtype (including IDH1 wild-type GBM, IDH1 mutant GBM, and grade III anaplastic astrocytoma (LGG)) were evaluated. Additionally, two patients receiving anti-PD1 inhibitor treatment were compared before and after treatment, including one responder and one non-responder. Anti-MARCO (1:100, PA5-64134, Invitrogen (Carlsbad, CA)) was used, followed by biotinylated goat anti-rabbit IgG (1:200, BA1000, Vector Laboratories) and streptavidin conjugated 594 (1:1000, S11127, Invitrogen) along with anti-CD163 (1:100, 10D6, Biocare Medical (Pacheco, CA)), biotinylated horse anti-mouse IgG (1:200, BA2000, Vector Laboratories), and streptavidin conjugated 488 (1:300, Invitrogen) on 5μm sections for IF staining. The stained sections were examined and photographed using a Nikon Eclipse TE2000-E. Synthetic images were captured from each area of interest at emission wavelengths of 395, 488, and 568. All images in Figure 4c were thresholded for the MARCO channel using a fixed value. For single-staining controls, all channels were thresholded using a fixed value.
Survival Analysis
TCGA-GBM U133 microarray data and preprocessed expression data from Wang et al. were used to determine MARCO expression. Each cohort was first independently log and Z-score normalized before merging. These normalized values were combined with survival data, including overall survival and disease-free survival. Survival differences were assessed in two ways: (1) dividing MARCO expression at the median into high and low expression groups and comparing survival curves; (2) directly generating a univariate Cox model based on MARCO expression levels and using the Wald p-value of MARCO as a covariate. In Figures 2a and b, we only used cases known to be IDH1 wild-type.
Expression Subtype Scoring
Patel et al.’s single-cell subtype scoring method was used to calculate characteristic scores for each Verhaak expression type. The same method was used to obtain BMDM and microglial cell characteristics from Yuan et al., as well as to assess the comprehensive score of tumor-macrophage interaction genes.
Gene Set Enrichment Analysis
GSEA was performed using the official Linux client v4.0.1. The normalized gene expression of all macrophages was used as input data, with MARCO expression levels serving as phenotype markers, and Pearson correlation used as the metric for gene ranking. Default weights (p=1) were applied. P-values were calculated based on 1000 permutations of the phenotype, and the final gene sets were ranked according to enrichment scores.
Tumor-Macrophage Interaction
The average normalized expression level of MARCO in the macrophage population of each GBM sample was calculated and compared to a selected list of recruiting factors in the tumor population of the same samples: macrophage colony-stimulating factor (CSF1), granulocyte/macrophage colony-stimulating factor (CSF2), hepatocyte growth factor (HGF), monocyte chemotactic protein 1 (MCP-1), macrophage migration inhibitory factor (MIF), stromal-derived factor 1 (SDF-1), transforming growth factor beta (TGF-β, including TGFB1, 2, and 3), interleukin 10 (IL-10), osteopontin (SPP1), and lactoferrin (MFGE8). Gene set expression subtype scores were calculated using this gene set, and the tumor cells of each case were averaged. The score was then compared with the corresponding MARCO expression level in the macrophage population using Spearman correlation. The same procedure was used to assess the correlation between macrophage MARCO expression levels and paired tumor cell expression subtype scores.
Dispersion Analysis
To quantify the utility of MARCO as a marker compared to traditional myeloid markers, BMDM markers, and microglial markers, we assessed the standardized dispersion coefficient of each gene. We used the Highly_Variable_Genes function in SCANPY with default parameters and batch correction. We determined p-values using the exact permutation test.
Statistical Analysis
All statistical analyses were conducted in Python 3.6. In all box plots, the center line represents the median, with lower and upper limits representing the first and third quartiles, respectively. The shaded area in survival curves represents the confidence interval. Violin plots used a Gaussian kernel to estimate density, with the center line indicating the median. Non-parametric comparisons were made between two groups. Statistical significance was evaluated at an adjusted p-value threshold of 0.05.
/Results/
Single-Cell Identification of MARCO+ Macrophage Subpopulations in GBM

To understand the heterogeneity of cell populations in GBM, we collected single-cell RNA-seq data from nine GBM cases and combined it with previously published studies from 41 GBM patients, resulting in a total of 79,968 single-cell transcriptomes (Supplementary File 1: Table S1). To reduce batch effects, we filtered the gene list to 499 genes overlapping with LM22, which is the reference matrix used by CIBERSORT to differentiate immune cells (Supplementary File 2: Table S2). After filtering, log normalization, batch effect reduction, and dimensionality reduction, these cells visualized to produce a macrophage population characterized by CD14 (17,132 cells; Figure 1a, Supplementary File 3: Figure S1). Unsupervised k-means clustering on this macrophage population revealed two subpopulations (Supplementary File 3: Figure S2). One subpopulation was enriched with inflammatory-related genes, with CCL4 and IL1B being the top two genes on the filtered gene list (p=0.004 and p=0.008, exact permutation test, n=499 genes; Figure 1b). The other subpopulation, in contrast to the inflammatory side, had MARCO (a macrophage receptor with collagen structure) as a highly expressed gene (p=0.004, exact permutation test, n=499 genes; Figure 1b). Even ignored during dimensionality reduction, MARCO remained the most abundant gene on this side, proving its representativeness (p=0.004, exact permutation test, n=499 genes). Observing the expression levels of MARCO across all cell populations, we found it specifically expressed in the macrophages of this subpopulation (Supplementary File 3: Figure S3A). MARCO is a scavenger receptor typically present on alveolar macrophages, with various immunomodulatory functions. Given the negative role of MARCO in other cancers, we chose to focus on these MARCO+ macrophages and their impact on the tumor microenvironment.
Loss of MARCO Expression in LGG and IDH1 Mutant GBM
Next, we investigated whether this macrophage subpopulation could also be observed in low-grade gliomas (LGG), including grade II and III astrocytomas and oligodendrogliomas. We collected single-cell expression profiles from 18,047 cells from 16 LGG cases and processed them in the same manner as the GBM above (Figure 1c). Although 2,199 macrophages were identified, only 1% (23 cells) showed non-zero MARCO expression (Figure 1d), whereas in GBM, 12% (2,092 out of 17,132 cells, p<0.001; chi-squared test). Although GBM samples had lower library complexity (p<0.001, n=49 patients, Mann-Whitney U test; Supplementary File 3: Figure S4), this situation still existed. Since most LGGs are IDH1 mutant, we assessed the MARCO expression levels in four IDH1 mutant GBM cases. Among the 281 macrophages from IDH1 mutant GBM, only one cell exhibited non-zero MARCO expression. Comparing standardized expression levels, the average MARCO expression level in IDH1 wild-type GBM macrophages was 160 times that of IDH1 mutant GBM (p=0.020, n=41 patients, Mann-Whitney U test), and 64 times that of LGG (p=0.0007, top of Figure 1e, n=49 patients). Meanwhile, the average expression levels of other macrophage markers such as CD14 showed no significant differences (p=0.34 and p=0.30, bottom of Figure 1e, n=41 and n=49 patients). Immunofluorescence imaging in IDH1 wild-type cases confirmed the co-localization of MARCO with CD163 macrophages in these patient tissues, while IDH1 mutant and LGG tissues showed rare co-localization (if any) (Supplementary File 3: Figures S5 and S6). Therefore, MARCO expression was found almost exclusively in the macrophages of IDH1 wild-type GBM, rather than in the less lethal IDH1 mutant or low-grade gliomas.
High MARCO Expression Correlates with Poor Clinical Outcomes and Mesenchymal Subtypes
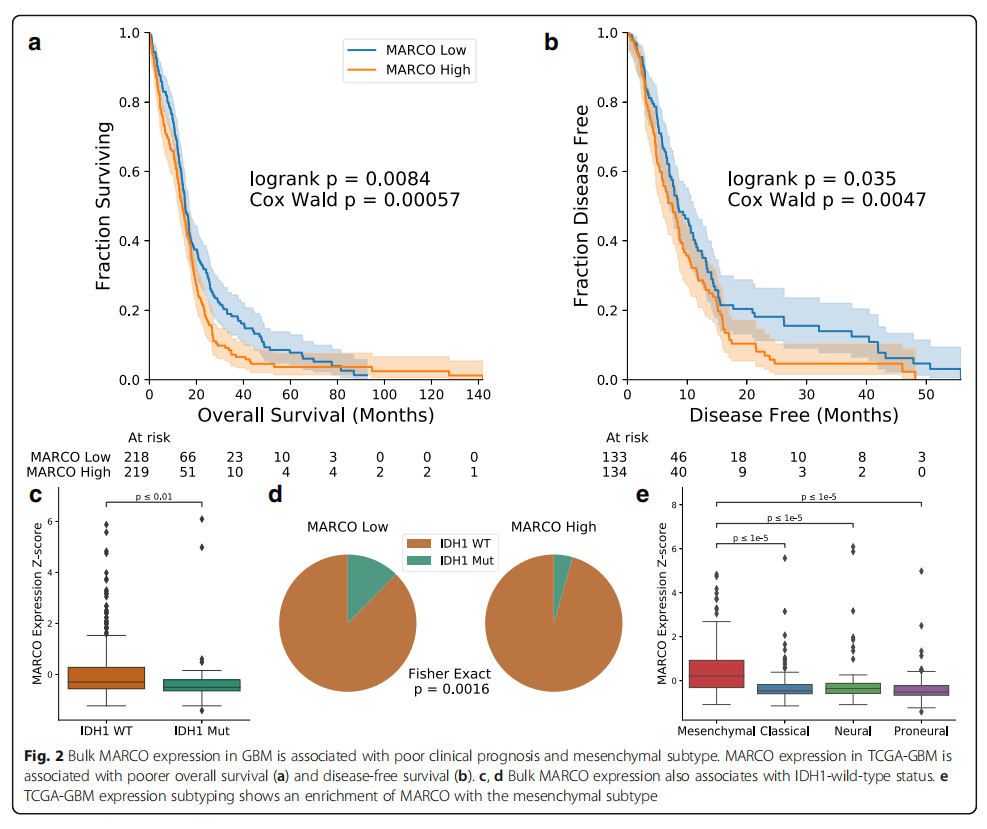
To understand the clinical outcomes of MARCO expression levels, we assessed its tumor bulk expression in two published datasets: TCGA-GBM and the GBM cohort from Wang et al. (a total of 603 patients). Dividing patients into high and low MARCO expression groups, we found that MARCO expression levels negatively correlated with overall survival (OS: p=0.0046, n=592 patients, log-rank test, Supplementary File 3: Figure S7A) and disease-free survival (DFS: p=0.018, n=387 patients). However, given the association of MARCO with IDH1 and the significant impact of IDH1 mutation on survival, we repeated the analysis solely on 437 cases with known IDH1 wild-type status, yielding similar results (OS: p=0.0084, n=437 patients; DFS: p=0.035, n=267 patients, log-rank test, Figures 2a, b). Continuing the analysis on the IDH1 wild-type cohort, we treated MARCO expression levels as a continuous variable and found that the impact of MARCO on survival was also significantly adverse in the univariate Cox model (OS patients p=0.00057, n=437, hazard ratio 1.19; DFS patients p=0.0047, n=267, hazard ratio 11.9; Wald test). These effects were most pronounced in long-term survival rates, with two-year (18.0% vs. 31.8%) and five-year (3.7% vs. 7.8%) overall survival rates for MARCO high patients being only half that of MARCO low patients. Similarly, the two-year DFS in the MARCO high population decreased more than threefold (5.8% vs. 18.1%; no five-year DFS data). The impact of MARCO expression levels on survival remained significant after controlling for common factors including age and MGMT methylation status (Supplementary File 3: Figure S7C).
Consistent with the single-cell sequencing results, we found in tumor bulk sequencing data that IDH1 mutations were associated with decreased MARCO expression levels (p=0.0039, n=482 patients, Mann-Whitney U test, Figure 2c). This was also important for dividing the population into high and low MARCO groups (p=0.0016, n=482, Fisher’s exact test, Figure 2d). We then compared MARCO expression with transcriptomic subtypes. Although MARCO is not listed among the mesenchymal gene set, its expression was highly enriched in mesenchymal samples (all paired comparisons between mesenchymal and other subtypes, p<0.00001, n=565 patients; Figure 2e). These tumor bulk transcriptomic results support our single-cell findings that MARCO expression is abundant in IDH1 wild-type tumors and also indicate that MARCO expression levels are associated with poor prognosis and unfavorable mesenchymal subtypes.
Single-Cell Association of MARCO with Mesenchymal Traits and Hypoxia
To reveal the source of this mesenchymal feature, we returned to the single-cell expression data, where mesenchymal expression features were initially found in the macrophage population rather than in tumor cells (p<0.00001, n=50 patients, Mann-Whitney U test, Figure 3a, Supplementary File 3: Figure S8, Supplementary File 2: Table S3), particularly in macrophages expressing MARCO (p=0.005). The average expression level of MARCO in macrophages was also significantly correlated with the mesenchymal feature scores in tumor cells from the same samples (p=0.0084, n=41 patients, Spearman correlation; see “Methods” section; Figure 3b). We then performed gene set enrichment analysis (GSEA) based on the Pearson correlation of MARCO expression levels with all other genes to understand the underlying processes in this subpopulation. Among the 50 hallmark gene sets in MSigDB, the gene set with the highest enrichment score in MARCO+ macrophages was epithelial-mesenchymal transition, angiogenesis, glycolysis, and hypoxia (all four gene sets FDR Q < 0.001, default weighted phenotype permutation test, n=17,132 cells; Figure 3c, d). Single-cell data from Darmanis et al. supported the association with hypoxia, where samples were taken from the core and periphery of the same four tumors. Macrophages from the tumor core had higher MARCO expression levels than those from the tumor periphery (p<0.001, n=1,846 cells; Mann-Whitney U test; Figure 3e). Furthermore, we examined the expression levels of MARCO in the Ivy GAP database, which includes laser microdissection samples from different anatomical structures. We found that MARCO expression levels varied significantly across various structures (p=0.014, n=270 samples from 37 patients; Kruskal-Wallis test, Supplementary File 3: Figure S9), with the highest expression level in the perivascular area of the tumor. These findings support that MARCO+ macrophages reside in the hypoxic tumor core with GSEA characteristics.
MARCO+ Macrophages Exhibit Loss of Inflammatory Pathways and Antigen Presentation
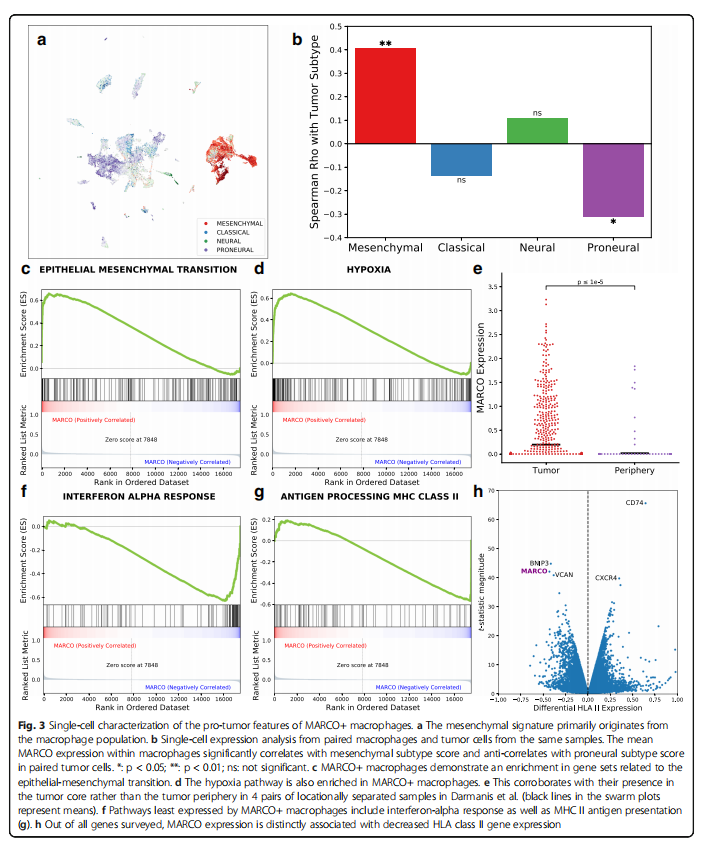
Since hypoxia can polarize macrophages to a pro-tumor phenotype, we also investigated whether the anti-tumor response within MARCO+ macrophages was downregulated. Additionally, through GSEA, we found that the gene sets with the lowest enrichment scores in the hallmark gene sets were all pro-inflammatory: interferon alpha response, interferon gamma response, allograft rejection response, and TNFa signaling via NFKB (all four groups FDR Q≤0.001, n=17,132 cells, Figure 3f). Interestingly, among the eight genes with the lowest relative expression levels in MARCO+ macrophages, four were HLA class II genes (HLA-DRB1, DRA, DPA1, and DPB1), and another was CD74 (the invariant chain of MHC II). Therefore, the GO gene set for antigen processing and peptide or polysaccharide antigen presentation via MHC class II was highly downregulated in MARCO+ macrophages (p<0.001, n=17,132 cells, Figure 3g). Similarly, by comparing HLA class II genes with all other 17,496 detected genes for differential expression, MARCO was one of the three most significantly negatively correlated genes with BNIP3 (an apoptotic Bcl-2 family gene) and VCAN (an extracellular protein associated with metastasis) (Figure 3h). The loss of HLA class II expression in macrophages is typically associated with an anti-inflammatory, inactive state and has previously been found to correlate with worse prognosis in melanoma and poor tumor distribution in PD1 immunotherapy in GBM.
Impact of PD1 Immunotherapy on MARCO Expression
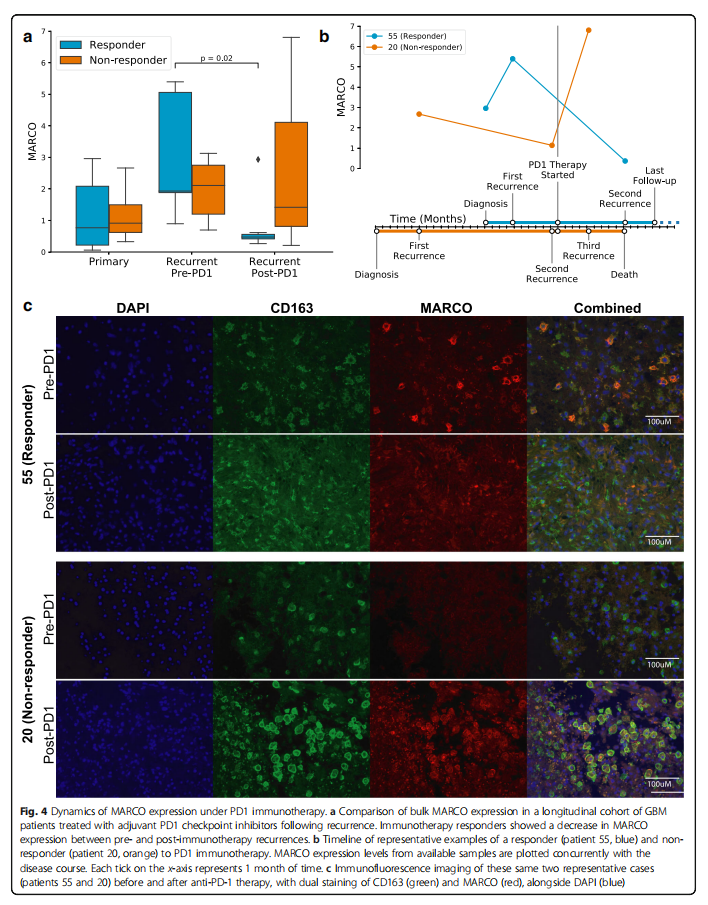
To determine whether the anti-inflammatory characteristics of MARCO+ macrophages play a role in PD1 checkpoint inhibitor therapy, we conducted a longitudinal cohort study of 17 GBM patients treated with PD1. Interestingly, the re-expression of MARCO before and after immunotherapy showed a decrease (p=0.02, n=37 time points; Mann-Whitney U test; Supplementary File 3: Figure S10A), but this was only found in responders (p=0.02, n=19 time points from 10 patients; Figure 4a). The timeline of two representative cases in this cohort showed that the MARCO expression level in responders significantly decreased after immunotherapy, while the MARCO expression level in non-responders increased after immunotherapy, followed by death shortly thereafter (Figure 4b). Immunofluorescence imaging of tissues from these two same cases visually reinterpreted these tumor bulk transcriptomic findings (Figure 4c). Although this supports the negative role of MARCO in long-term adjuvant therapy, the dynamics in the short term may differ in studies of neoadjuvant PD1 therapy in GBM, where MARCO was reported as one of the genes most increased in patients receiving pembrolizumab therapy about two weeks before sample collection. Meanwhile, in a longitudinal cohort of 86 patients receiving standard treatment, we found no significant differences in MARCO expression before and after treatment (p=0.21, n=160 time points, Supplementary File 3: Figure S10B), indicating that these changes in MARCO are specific to immunotherapy.
Tumor Cells Recruit MARCO+ Macrophages from the Blood
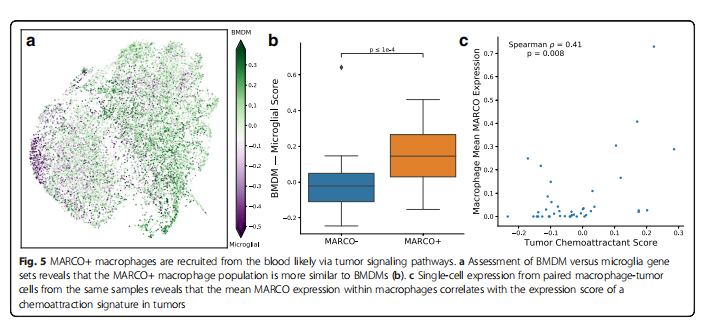
An important question regarding the potential targeting of MARCO+ macrophages is where they originate and how they are recruited to the tumor. Based on gene sets associated with BMDMs and resident microglia, we found that MARCO+ macrophages are closer to BMDMs (p<0.0001, n=71 subpopulations; Mann-Whitney U test; Figure 5a, b). Compared to non-MARCO expressing macrophages, CD163 was one of the most differentially expressed genes in MARCO+ macrophages (p=0.0037, n=17,509 genes; exact permutation test), while TMEM119 was the lowest (p=0.0055), which are classical markers characterizing BMDMs and microglia, respectively. Nonetheless, MARCO seems to define a subpopulation that is more specific than simply BMDMs or microglia (p=0.004, n=17,509 genes; see “Methods” section; Supplementary File 3: Figure S3B).
To understand the factors recruiting these macrophages, we assessed the expression levels of 10 known recruiting and reprogramming macrophage genes in GBM. We found that the average expression level of MARCO in macrophages was significantly positively correlated with the corresponding standardized expression levels of these recruiting factors in tumor cells from the same samples (p=0.008, n=41 patients, Spearman correlation; see “Methods” section; Figure 5c). The correlation of these results was supported by the tumor bulk expression data from TCGA-GBM, where MARCO was positively correlated with the same features of recruiting factors (p<0.001, n=528 patients, Spearman correlation; see “Methods” section; Supplementary File 3: Figure S12). Additionally, we found significant co-expression of Ki-67 with MARCO in GBM single-cell data (p<0.00001, n=17,132 cells, chi-squared test; Supplementary File 3: Figure S13), suggesting that these MARCO+ macrophages may also proliferate within the tumor microenvironment.
/Discussion/
In this paper, we elucidated the role of MARCO as a pro-tumor macrophage marker in GBM. Specifically, we found that this MARCO-expressing subpopulation is associated with mesenchymal, hypoxic, and anti-inflammatory characteristics, as well as adverse clinical outcomes. The mesenchymal nature of MARCO is supported by its role in regulating cancer-associated epithelial-mesenchymal transition. Simultaneously, the upregulation of glycolysis and hypoxia gene sets is consistent with the enrichment of MARCO+ macrophages in the tumor core, which is known to be associated with pro-tumor macrophages. Moreover, the localization of these macrophages in the hypoxic, necrotic core aligns with observations of MARCO upregulation in ischemic brain regions, indicating that this scavenger receptor plays a functional role in clearing cellular debris. In fact, the significant downregulation of HLA class II genes in MARCO+ macrophages is consistent with mouse studies where MARCO expression levels correlate with reduced antigen internalization capacity. While MARCO has been reported as a pro-tumor marker in non-small cell lung cancer, pulmonary adenocarcinoma, and breast cancer and is associated with poor prognosis in perihilar adenocarcinoma, its role in GBM has not been reported. Our findings of pro-tumor TAM characteristics associated with MARCO in GBM further highlight its importance in cancer.
In this study, we found that MARCO+ macrophages appear to be recruited from the blood by a series of factors secreted by tumor cells (including CSF1 and TGF-β). The expression of CSF1 in tumor cells has been confirmed to be associated with a higher proportion of TAMs in GBM. Notably, TAMs were observed to express the homologous receptor CSF1R, which is a target of existing therapies. Meanwhile, experimental evidence suggests that TGF-β can upregulate MARCO expression levels in M0 BMDMs, and a series of other studies have indicated that TGF-β is related to glioma progression. While these recruiting factors are potential targets, MARCO itself is also a promising target. Anti-MARCO therapeutic antibodies have shown efficacy in mouse melanoma models. Like other immunotherapies, we do not expect that anti-MARCO antibodies alone will significantly improve outcomes. However, incorporating anti-MARCO into combinations may be more beneficial. Although MARCO expression levels remain unchanged in standard treatments, we found that its expression changes during anti-PD1 immunotherapy, with responders showing decreased MARCO expression levels in the long term after treatment. This result suggests that MARCO+ macrophages may be detrimental to checkpoint immunotherapy, while checkpoint immunotherapy is fundamentally ineffective for GBM. Simultaneously targeting MARCO or its related recruiting factors may provide a potential approach to control macrophage polarization, thereby enhancing the efficacy of checkpoint inhibitors. Additionally, there is an urgent need for response markers for anti-PD1 therapy. Previously, we demonstrated that MAPK gene mutations and PTEN loss can predict responses to anti-PD1 immunotherapy. However, there are currently no response markers after anti-PD1 inhibitor treatment. MARCO may be helpful in this regard, which could be beneficial in prospective trials of anti-PD1 treatment.
/Conclusion/
In this work, we utilized single-cell RNA sequencing to identify a pro-tumor subpopulation of macrophages characterized by MARCO expression. These macrophages are associated with both poorer clinical outcomes and mesenchymal subtypes. Moreover, these macrophages appear to originate from the bone marrow and are influenced by anti-PD1 checkpoint inhibitors. These results reveal a novel macrophage subpopulation. The average expression level of MARCO in macrophages correlates with the expression scores of chemotactic signals in the tumor, contributing to the tumor progression of glioblastoma and suggesting potential therapeutic strategies for the tumor.
Supplementary link:
https://doi.org/10.1186/s13073-021-00906-x

Author Introduction

Chen Qian Nan
Beijing Institute of Neurosurgery, Master’s student of 2022
—— RecommendedReading ——

1. Brain-penetrable IDH1 mutant inhibitor DS-1001 in a first phase I clinical trial in patients with recurrent or progressive IDH1 mutant gliomas
2. The relationship between RANO-PRO Working Group standardized priority structure and disease progression in malignant glioma patients: A retrospective cohort study
3. STAT3 is a biologically relevant therapeutic target in H3K27M mutant diffuse midline glioma