
POD24 significantly affects the overall survival (OS) of patients with follicular lymphoma (FL) within 24 months of disease progression. Existing FL risk scoring models have been developed using statistical methods such as logistic regression or Cox regression. The rapid development of machine learning has facilitated the advancement of prognostic models. In China, Professor Song Yuqin, Professor Li Zhiming, and Professor Xu Bing’s team led the domestic follicular lymphoma working group to conduct predictive model analysis, employing machine learning methods to identify high-risk FL patients for POD24, aiming to guide treatment decisions and improve outcomes. The results were recently published in Biomarker Research.
Methods
This retrospective multicenter study included patients diagnosed with FL stage 1-3a from January 2000 to December 2020 across 17 centers in China. A total of 2243 patients were included, with 292 patients excluded due to insufficient clinical information (n=292) and 13 lost to follow-up. The eligible patients (n=1938) were randomly divided into a training set for model development (n=1292) and a validation set for internal validation (n=646). Data from 1145 eligible patients for external validation were obtained through the Vivli platform (http://vivli.org) from the GALLIUM study.
Results
The POD24 predictive model (FLIPI-C) development
The study first constructed four binary classifiers (DecisionTree, RandomForest, RidgeClassifier, and XGBoost). All classifiers included the same 15 selected features. The performance of the four models was compared using confusion matrix indices. In the training cohort, the permutation-based XGBoost algorithm was used to identify important variables associated with POD24.
FLIPI-C Validation
FLIPI-C was validated in both the internal validation set and the external validation cohort. The performance of FLIPI-C was also compared with currently used prognostic models in clinical practice, including FLIPI, FLIPI-2, PRIMA-PI, and FLEX models. To assess the discriminative ability of FLIPI-C and existing models, time-dependent analysis of the area under the receiver operating characteristic curve (AUROC) was performed. The optimal cutoff threshold for POD24 in the ROC curve was determined by the Youden index (maximum sensitivity + maximum specificity – 1). Kaplan-Meier survival curves compared survival outcomes between low-risk and high-risk groups.
Results
Baseline Characteristics
The study cohort included 1938 eligible FL1-3a patients from 17 centers in China, randomly assigned to training and internal validation sets in a 2:1 ratio. The GALLIUM cohort included 1115 eligible FL1-3a patients for external validation. The median follow-up time was 31 months (29-33 months), with a POD24 rate of 19.7% (n=383) in the study cohort, higher than the 14.8% (n=165; P=0.0006) observed in the GALLIUM cohort.
Developed Using Machine Learning FLIPI-C
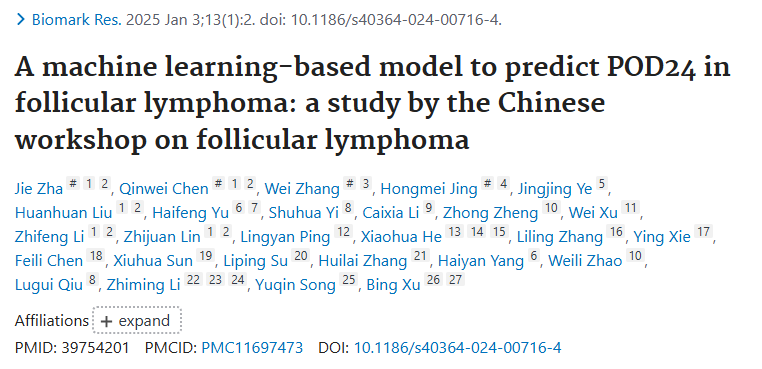
The study found that XGBoost achieved the best performance and accuracy, which was used to develop the FLIPI-C model. Fifteen baseline clinical features at initial diagnosis were input, and feature importance for predicting POD24 risk was obtained through Weight, Gain, and SHAP analysis, ranking features in descending order of importance (Figure 1). Simultaneously, logistic regression analysis identified significant predictors of POD24, including SUVmax > 10, elevated β2-MG, Hb < 12 g/dl, LN > 4, LDH > ULN, advanced stage (III/IV), ECOG ≥ 2, B symptoms, and large tumor mass (Figure 2). Additionally, Cox regression analysis was conducted to determine overlapping significant predictors of POD24. The XGBoost-based model (FLIPI-C) incorporated six variables most significantly associated with POD24 risk, including LMR > 10, elevated β2-MG, LDH > ULN, Hb < 12 g/dl, LN > 4, and SUVmax > 10. Each of these six variables was scored based on importance weight (LMR, 2 points; other variables, 1 point), for a total score of 7 (Table 2). The model’s performance was evaluated using 5-fold and 10-fold cross-validation, achieving accuracies of 80.6% and 80.8%, respectively.
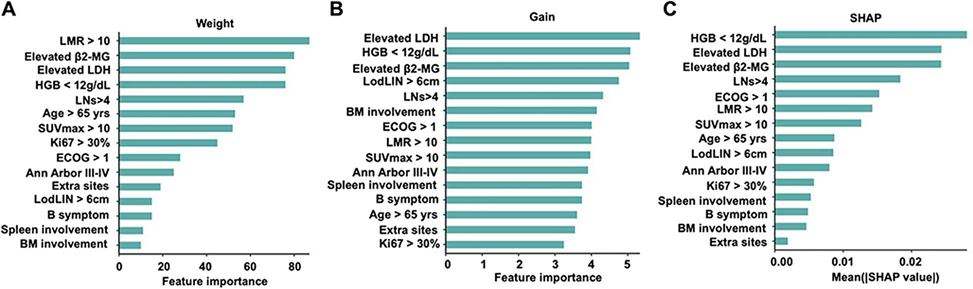
Figure 1. Key variables used to predictPOD24 and the feature importance chart and SHAP values.
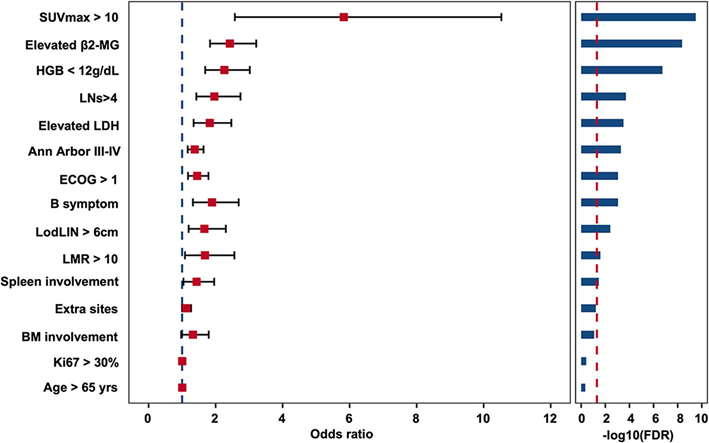
Figure 2. Logistic regression model forest plot assessingPOD24 risk.
Internal and External Validation of FLIPI C
FLIPI-C was then internally validated in the validation set and externally validated in GALLIUM. In the internal validation set, the 2-year progression-free survival (PFS) rate for the low-risk group (0-3 points) was 85.7% (95% CI, 0.81-0.90), and the 5-year OS rate was 95.8% (95% CI, 0.92-0.99), significantly higher than the high-risk group (4-7 points), whose 2-year PFS rate was 42.4% (95% CI, 0.34–0.52; P < 0.0001) and 5-year OS rate was 78.9% (95% CI, 0.70–0.88; P < 0.0001) (Figure 3A-B). Similar results were obtained in the GALLIUM cohort, with a 2-year PFS rate of 88.4% (95% CI, 0.86–0.90) vs 63.8% (95% CI, 0.56–0.72; P < 0.0001), and a 5-year PFS rate of 63.8% (95% CI, 0.56–0.72; P < 0.0001). The OS rates were 92.8% (95% CI, 0.90–0.95) for the low-risk group and 81.0% (95% CI, 0.74–0.88; P < 0.0001) for the high-risk group. Notably, the difference in 2-year PFS rates between the low-risk and high-risk groups defined by FLIPI-C was more significant than the differences observed with the FLEX model (Figure 3C-D).
Figure 3. Survival analysis based on FLIPI-C risk scoring.
Comparison of FLIPI C Model with Existing Models’ Predictive Accuracy
The study validated whether FLIPI-C’s accuracy in predicting POD24 and OS is superior to existing prognostic models. In the internal validation cohort, FLIPI-C (0.703; 95% CI, 0.64–0.74) outperformed FLIPI (0.558; 95% CI, 0.50–0.61), FLIPI-2 (0.591; 95% CI, 0.591; 95% CI, 0.53–0.64), and FLEX (0.626; 95% CI, 0.57-0.67) (Figure 4A). In the GALLIUM cohort, the AUC value of FLIPI-C for predicting POD24 (0.703; 95% CI, 0.64–0.74) was higher than FLIPI (0.558; 95% CI, 0.50–0.61), FLIPI-2 (0.591; 95% CI, 0.53–0.64), and FLEX (0.626; 95% CI, 0.57-0.67) (Figure 4B). For 3-year OS prediction, the AUC values of the FLIPI-C model in our internal validation set and the GALLIUM cohort were 0.700 (95% CI, 0.61-0.79) and 0.581 (95% CI, 0.53-0.61), respectively, outperforming FLIPI, FLIPI-2, PRIMA-PI, and FLEX (Figure 4C-D).
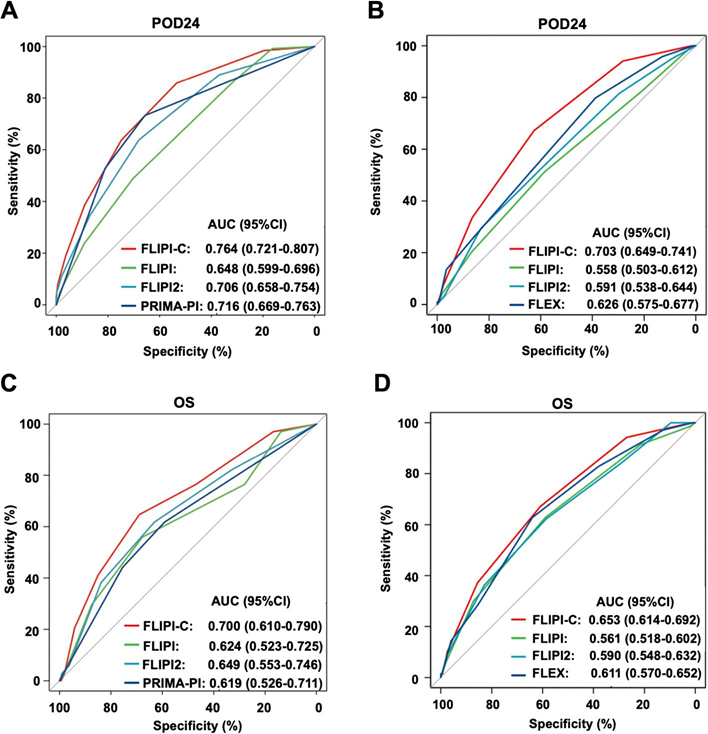
Figure 4. Comparison of the predictive accuracy of the new ML model with previously established models.
Impact of First-line Treatment on FLIPI C Risk Stratification
In the GALLIUM cohort (n=944), patients received different first-line treatments, including rituximab-based immunochemotherapy (R-chemo) (n=452; 47.8%), obinutuzumab-based immunochemotherapy (G-chemo) (n=492; 52.1%), bendamustine combined with rituximab or obinutuzumab (BR/G) (n=569; 60.2%), and cyclophosphamide, doxorubicin, vincristine, and prednisone (CHOP) or cyclophosphamide, vincristine, and prednisone (CVP) plus R/G (n=375; 39.7%). Compared to R chemotherapy, G chemotherapy was associated with good PFS in low-risk patients defined by FLIPI-C (2-year PFS, 90.8% vs 85.7%; P =0.03; Figure 5A). However, no significant differences were observed in high-risk patients (2-year PFS, 70.6% vs 66.8%; P=0.49; Figure 5B), correlating with a higher POD24 rate predicted by FLIPI-C. Low-risk patients receiving BR/G had better PFS than those receiving CHOP or CVP plus R/G (2-year PFS, 89.1% vs. 87.1%; P =0.014; Figure 5C), while in high-risk patients (2-year PFS, 69.6% vs 67.9%; P =0.98; Figure 5D).
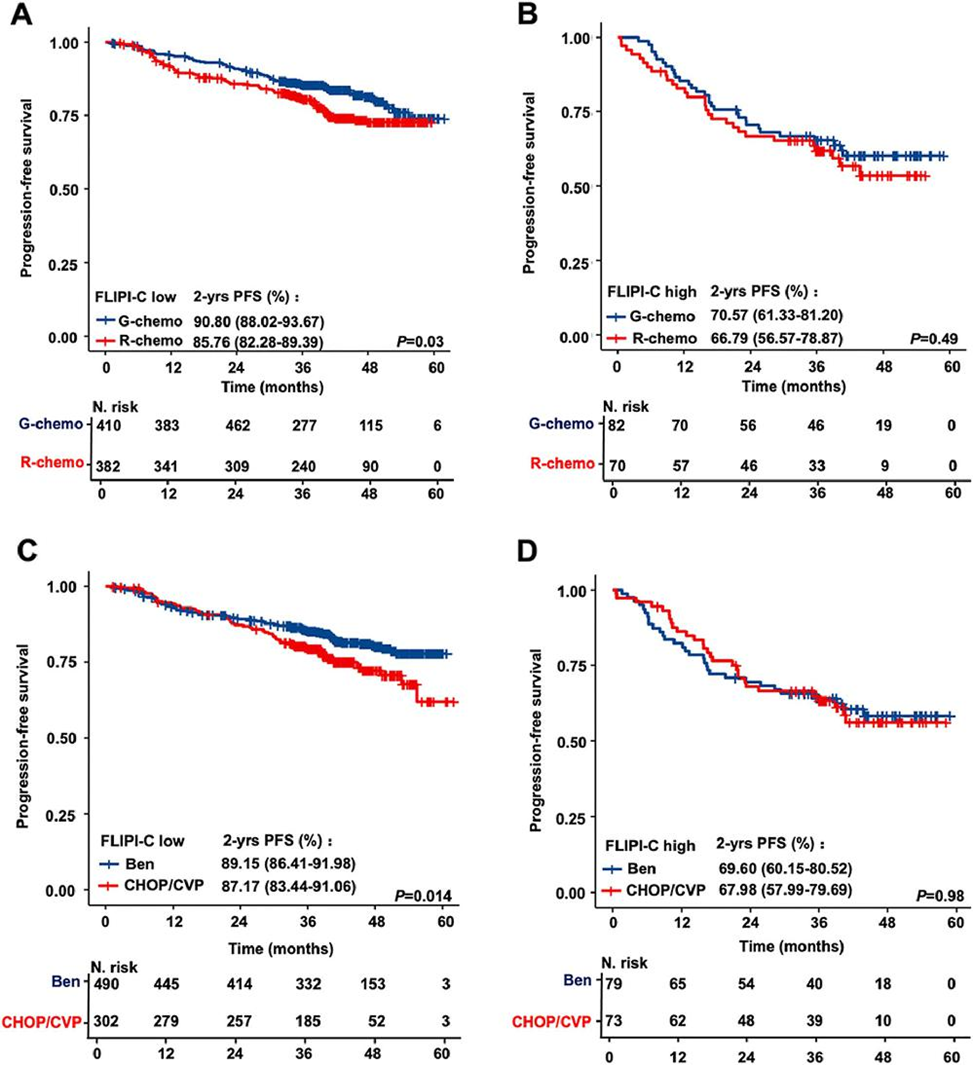
Figure 5. Comparing progression-free survival of patients receiving different first-line treatments using FLIPI-C risk scoring.
Conclusion
FLIPI-C model, developed using machine learning methods, demonstrates exceptional predictive accuracy and utilizes simple and widely used markers. It is expected to provide information for treatment decisions and prognostic assessments in clinical practice for high-risk FL patients regarding POD24.