Previously, we shared a comprehensive overview that described various tools for each step of ATAC-seq data analysis, see “Overview: A Complete Guide to ATAC-seq Data Analysis Tools.” This time, we introduce another overview that presents an updated and optimized ATAC-seq protocol called Omni-ATAC. The literature information is as follows:
Title: Chromatin accessibility profiling by ATAC-seq
Published in: Nat Protoc. 2022 Apr 27;17(6):1518–1552.
DOI: 10.1038/s41596-022-00692-9
Link: https://pmc.ncbi.nlm.nih.gov/articles/PMC9189070/
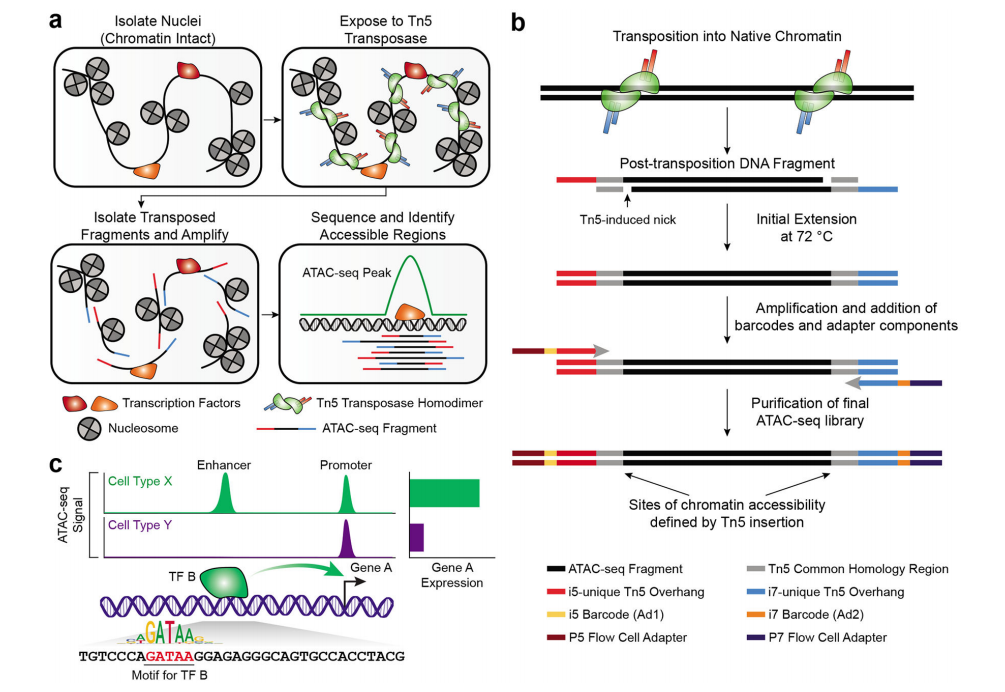
Overview of the Omni-ATAC Protocol
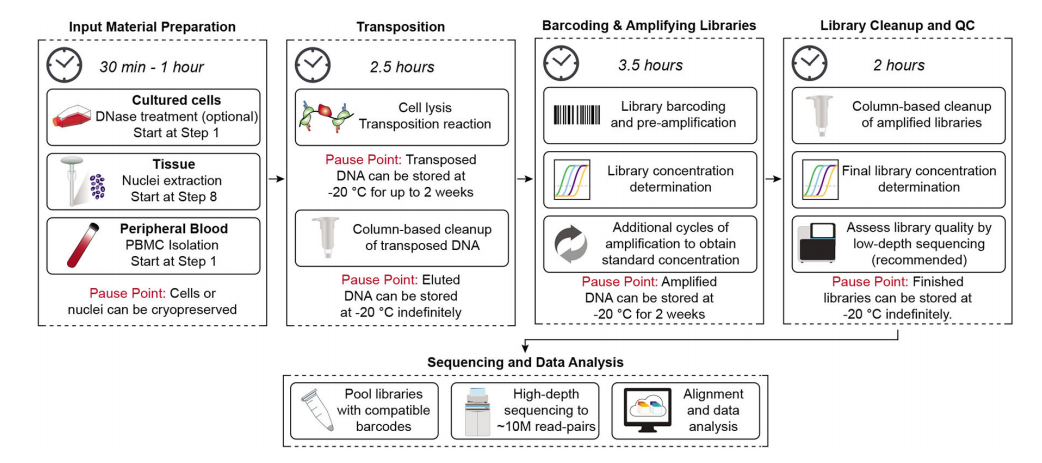
ATAC-seq requires relatively low input cells and does not require prior knowledge of the dynamic epigenetic marks or transcription factors of the regulatory system. Here, the authors describe an updated and optimized ATAC-seq protocol called Omni-ATAC, suitable for a wide range of cell and tissue types. This protocol details the steps for generating and sequencing ATAC-seq libraries and offers suggestions for sample preparation and downstream bioinformatics analysis. The ATAC-seq workflow mainly includes five steps:
-
Sample preparation -
Transposition -
Library preparation -
Sequencing -
Data analysis
As shown in the figure below, it also includes the approximate time required for each step:
Comparison with Other Technologies
There are many existing technologies for mapping DNA regulatory elements, making it challenging to choose the most appropriate and informative technology for specific applications. In the table below, the authors compare some of the most commonly used technologies for mapping DNA regulatory elements: ATAC-seq, DNase-seq, MNase-seq, ChIP-seq, and targeted CUT&TAG, to help new users decide which detection method is most suitable for their specific applications.
Selection principles:
-
(i) What type of information is needed to answer specific research questions -
(ii) What type of input material is available.
Generally, epigenomic analysis is suitable for answering questions about how or why a cell type or tissue may exhibit changes in gene regulation. For questions primarily involving “what changes occurred,” we recommend starting with RNA sequencing.
| ATAC-seq | DNase-seq | MNase-seq | CUT&TAG or related ChIC techniques | |
|---|---|---|---|---|
| Type of enzyme | Tn5 | endonuclease | endonuclease and exonuclease | Tn5 conjugated to an antibody via Protein A. |
| Is there sequencing bias? | Yes; complex, Tn5 insertion bias, with preference for A/Ts in insertion site and C/Gs flanking133-135 | Yes; complex, partially dependent on enzyme concentration and on methylation status of CpGs85,136 | Yes; preferential cutting upstream of A/T compared to G/C137,138 | Yes; dictated by antibody used to guide Tn5 and by Tn5 bias. |
| Input cell/nucleus number in standard analysis | 500-50,000 | 1-10 million | 10,000-100,000 | 100,000-500,000 |
| Are low starting amount/single-cell methods available? | Yes86,87; commercial solutions available. | Yes67 | Yes66 | Yes62,64,139-141 |
| Sample type | Fresh or cryopreserved cells or nuclei. Fresh or frozen tissues. | Fresh or cryopreserved cells or nuclei. Fresh or frozen tissues. Formaldehyde cross-linked or formalin-fixed paraffin-embedded samples. | Fresh or cryopreserved cells or nuclei. Fresh or frozen tissues. Formaldehyde cross-linked samples. | Fresh or cryopreserved cells or nuclei. Fresh or frozen tissues. |
| Library preparation time | ~10 hours for 12 samples (this protocol) | 1-3 days | ~ 2-days | 1-2 days |
| Technical considerations | Library quality is highly dependent on cell viability. Protocol alterations are required for use on fixed cells and data quality is often reduced for those samples. | Enzyme concentration and digestion duration may need to be optimized to sample type. Size of fragments selected affects downstream analysis.28 | Enzyme concentration and digestion duration may need to be optimized to sample type. Apparent nucleosome occupancy is a function of MNase concentration. | The amount of antibody used must be titrated for the cell type or sample. This will be a function of the strength of the antibody and the abundance of the target protein. The assay is as specific as the primary antibody used. Additionally, this is a targeted technique, so additional libraries must be made of each modification or protein tested. |
| Sequencing type | Paired-end | Single-end | Single-end | Single-end or paired-end |
| Sequencing depth | Low; 10 million read-pairs per sample with Omni-ATAC. | Medium/high: 20-50 million uniquely mapping reads per sample; 200 million for TF footprinting. | High; 150-200 million reads per sample (human)142 | Very low; 3 million read-pairs per sample. |
| Data yield | Tn5-accessible chromatin; | DNase-accessible chromatin; TF footprinting. | Nucleosome positioning, inaccessible chromatin. | Location of target on DNA. |
| Main advantages | Links labeling of accessible regions and NGS library preparation, making preparation of library straightforward. | Footprinting analysis. | Method of choice for nucleosome positioning and quantitative nucleosome dynamics. | Enables mapping of specific TF or histone modification in low cell numbers. Some histone modifications, like H3K27ac, can be used to look for active enhancers. |
Comparison with Previous ATAC-seq Methods
There are still several shortcomings in early ATAC-seq methods. For example,
-
Due to the lack of chromatinization of mitochondrial DNA, if lysed mitochondria are present in the ATAC-seq reaction, it will lead to a large number of ATAC-seq sequencing reads mapping to mitochondrial DNA. -
In many cell types and contexts, low signal-to-noise ratio makes it difficult or even impossible to apply ATAC-seq to certain experimental systems.
To address some of the above situations, the authors previously developed a universal and optimized ATAC-seq method called Omni-ATAC, which resolves many of the cell or context-specific issues that limit the widespread application of ATAC-seq.
Development of the Omni-ATAC Protocol
The Omni-ATAC protocol improves the original ATAC-seq method by reducing reads mapped to mitochondrial DNA and increasing the signal-to-noise ratio in various cell lines, tissues, and frozen samples. This improvement is achieved through the optimization of cell lysis, nuclear separation, and transposition reactions. The optimizations in the Omni-ATAC protocol enable lysis of various cell types by adding Tween-20 and digitonin, along with the traditional Nonidet P40 (NP40).
Experimental Design
1. Preparation of Input Materials
-
Applicable to various mammalian cell and tissue types: -
As low as 500 cells (or nuclei), with optimal results at 50,000 cells -
Samples should preferably be: fresh or cryopreserved intact cells or nuclei -
Not applicable to formalin-fixed paraffin-embedded (FFPE) tissues -
Biological replicates and technical replicates: When resources are limited, biological replicates are recommended instead of technical replicates; if biological replicates are limited, it is best to perform 2-3 technical replicates.
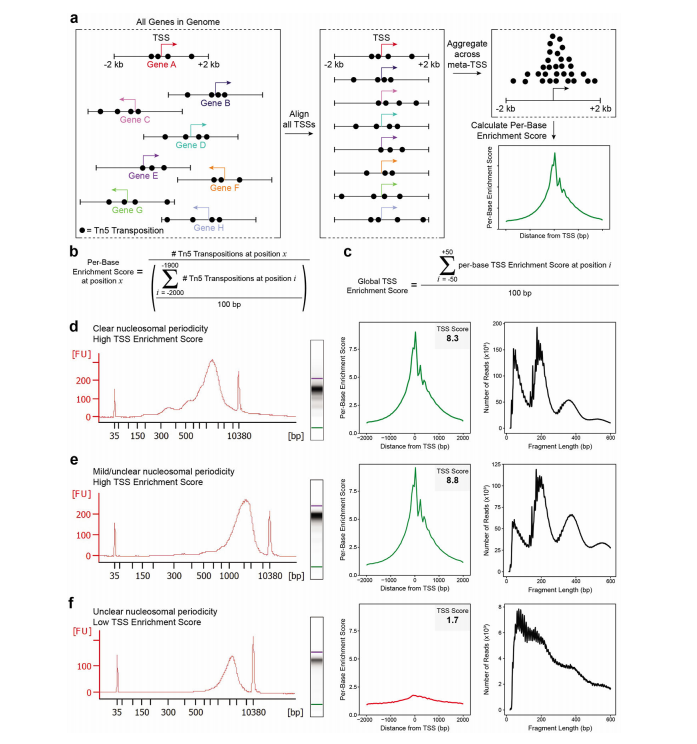
2. Quality Control of ATAC-seq Libraries
The authors strongly recommend determining the quality of the final ATAC-seq library through low-depth sequencing (50,000 to 100,000 read pairs per sample). The success of ATAC-seq library generation depends on four key factors:
-
(i) Enrichment of transposase insertions in known chromatin-accessible regions (signal-to-noise ratio) -
(ii) Total number of unique fragments (library complexity) -
(iii) Mapping rate to the nuclear genome versus mitochondrial genome -
(iv) Distribution of library insert fragment sizes
As shown in the figures below:
-
(e) A successful ATAC-seq library: with high transcription start site (TSS) enrichment scores, but the nucleosome periodicity observed in the Bioanalyzer electropherogram is not obvious. -
(f) An unsuccessful ATAC-seq library: with low TSS enrichment scores, and no obvious nucleosome periodicity observed in the Bioanalyzer electropherogram.
3. Sequencing Parameter Guidance
| Sequencing Application | Insight Gained | Minimum Read Length† | Index Length* | Paired or Single-End | Sequencing Data Amount (reads/sample) |
|---|---|---|---|---|---|
| Gene regulatory landscape profiling | Peaks, differential peaks between samples, motif analysis of peaks | 36 bp | 8 | Paired | 10M |
| Genotyping | Gene regulatory landscape + genotype of sample; useful for patient samples and to determine if sequence variants affect a peak. | 100 bp | 8 | Paired | 10M |
| Footprinting Analysis | Footprinting of different TFs to determine binding sequence at base-pair resolution | 36 bp | 8 | Paired | 200M |
| Nucleosome occupancy | Location of nucleosomes along DNA | 36 bp | 8 | Paired | 60M |
More detailed requirements can be found in the original text.
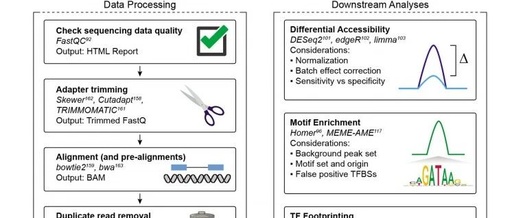
Data Analysis
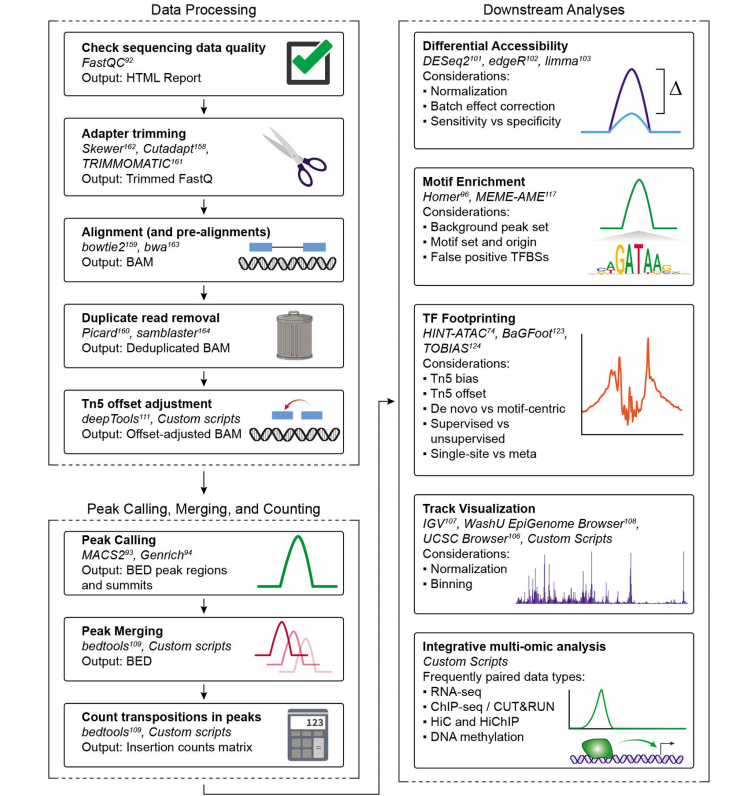
After sequencing, the authors recommend using publicly available analysis workflows to perform alignment and downstream analysis, such as:
-
PEPATAC Workflow: https://pepatac.databio.org/en/latest/ -
ENCODE: https://www.encodeproject.org/atac-seq/ -
nf-core: https://nf-co.re/
Comparison of the Above Three Analysis Pipelines:
| Step/Process | ENCODE ATAC-seq | PEPATAC | nf-core atacseq |
|---|---|---|---|
| Version for Comparison | v1.10.0 | v0.10.0 | v1.2.1 |
| Running Environment | Cromwell/caper | Pypiper | Nextflow |
| Adapter Removal, Alignment, and Deduplication | Cutadapt, bowtie2, Picard | TRIMMOMATIC, skewer, bowtie2, BWA, samblaster, Picard | TrimGalore, BWA, Picard |
| Tn5 Offset Correction | Yes | Yes | No |
| Mitochondrial Gene Filtering | Yes | Yes | Yes |
| Peak Calling Method | MACS2 | MACS2 (default), F-seq, Genrich | MACS2 |
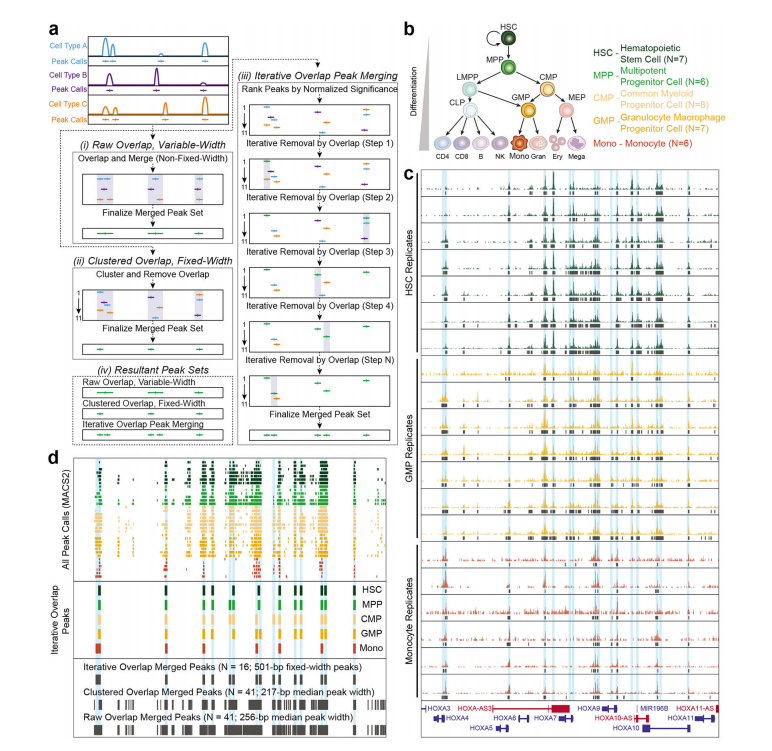
| Method | Based on the irreproducible discovery rate (IDR) for replicates – does not merge for a whole set of samples | Fixed-width, iterative overlap | Raw peak overlap using bedtools109 merge |
| Output Results | BAM files, bigwig files (one representing fold enrichment over expected background and the other representing statistical significance), BED file of peaks for each file and for the merged peak set | QC plots including alignment scoring, TSS scores and library complexity, BED peaks and counts, bam files, bigwig files (nucleotide resolution and smoothed) | QC html report, bam files, normalized bigwig files, BED peaks, annotation of peaks (HOMER), merged peak set, differential accessibility (DESeq2), IGV output. |
| Code Repository | https://github.com/ENCODE-DCC/atac-seq-pipeline | https://github.com/databio/pepatac | https://github.com/nf-core/atacseq |
Peak Merging Strategy in Downstream Analysis:
Single-cell ATAC-seq
Omini-ATAC is specifically designed for bulk ATAC-seq; single-cell ATAC-seq can refer to mature commercial applications such as 10X Genomics.
Friendly Announcement:
Online live course on bioinformatics introduction & data mining January 2025 class
After a 5-year hiatus, our bioinformatics skill tree VIP apprentices continue enrollment!
Affordable solutions to meet your bioinformatics analysis and computational needs.