
The monitoring system is one of the core rules defined by Google for SRE. When we use Traefik as the Ingress controller for Kubernetes, it is naturally essential for us to monitor it. In this article, we will explore how to use Prometheus and Grafana to monitor and alert based on the metrics provided by Traefik.
Installation
First, you need an accessible Kubernetes cluster.
Deploying Traefik
Here we will use the simpler Helm method to install and deploy Traefik. First, use the following command to add Traefik to the Helm repository:
$ helm repo add traefik https://helm.traefik.io/$ helm repo updateThen we can deploy the latest version of Traefik in the kube-system namespace. In our example, we also need to ensure that Prometheus metrics are enabled in the cluster, which can be achieved by passing the --metrics.prometheus=true flag to Helm. Here we will place all configurations in the following traefik-values.yaml file:
# traefik-values.yaml
# Simple use of hostPort mode
ports:
  web:
    port: 8000
    hostPort: 80
  websecure:
    port: 8443
    hostPort: 443
service:
  enabled: false
# Do not expose dashboard
 ingressRoute:
  dashboard:
    enabled: false
# Enable prometheus monitoring metrics
additionalArguments:
  - --api.debug=true
  - --metrics.prometheus=true
# The master node has taints by default, need to tolerate this taint to deploy
# Here we will pin traefik to the master node
tolerations:
  - key: "node-role.kubernetes.io/master"
    operator: "Equal"
    effect: "NoSchedule"
nodeSelector:
  kubernetes.io/hostname: "master1"
Install it using the command as shown below:
$ helm install traefik traefik/traefik -n kube-system -f ./traefik-values.yaml
NAME: traefik
LAST DEPLOYED: Mon Apr  5 11:49:22 2021
NAMESPACE: kube-system
STATUS: deployed
REVISION: 1
TEST SUITE: None
Since we have not created an IngressRoute object for Traefik’s Dashboard by default, we can temporarily access it using port-forward. Of course, we first need to create a Service for the Traefik Dashboard:
# traefik-dashboard-service.yaml
apiVersion: v1
kind: Service
metadata:
  name: traefik-dashboard
  namespace: kube-system
  labels:
    app.kubernetes.io/instance: traefik
    app.kubernetes.io/name: traefik-dashboard
spec:
  type: ClusterIP
  ports:
    - name: traefik
      port: 9000
      targetPort: traefik
      protocol: TCP
  selector:
    app.kubernetes.io/instance: traefik
    app.kubernetes.io/name: traefik
Create it directly, and then use port forwarding to access:
$ kubectl apply -f traefik-dashboard-service.yaml
$ kubectl port-forward service/traefik-dashboard 9000:9000 -n kube-system
Forwarding from 127.0.0.1:9000 -> 9000
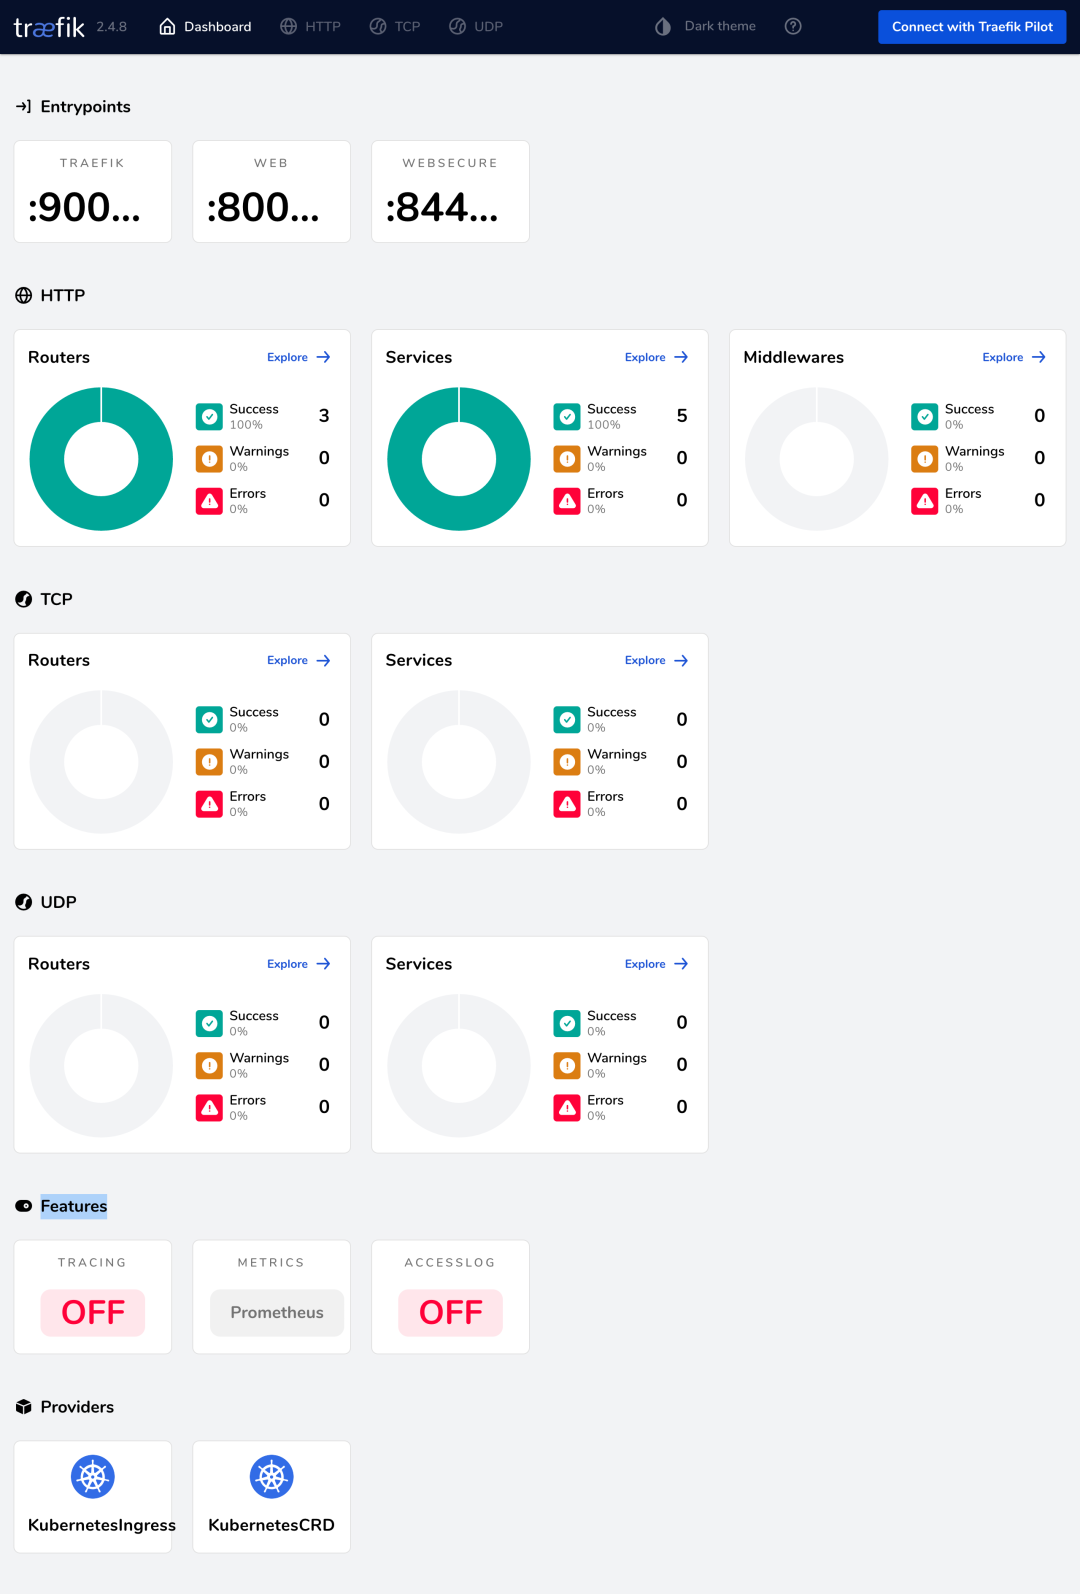
Forwarding from [::1]:9000 -> 9000Next, we can access the Traefik Dashboard through the browser at http://localhost:9000/dashboard/ (note the trailing slash in the URL, which is required). You should now see that the Prometheus metrics are enabled in the Features section of the dashboard.
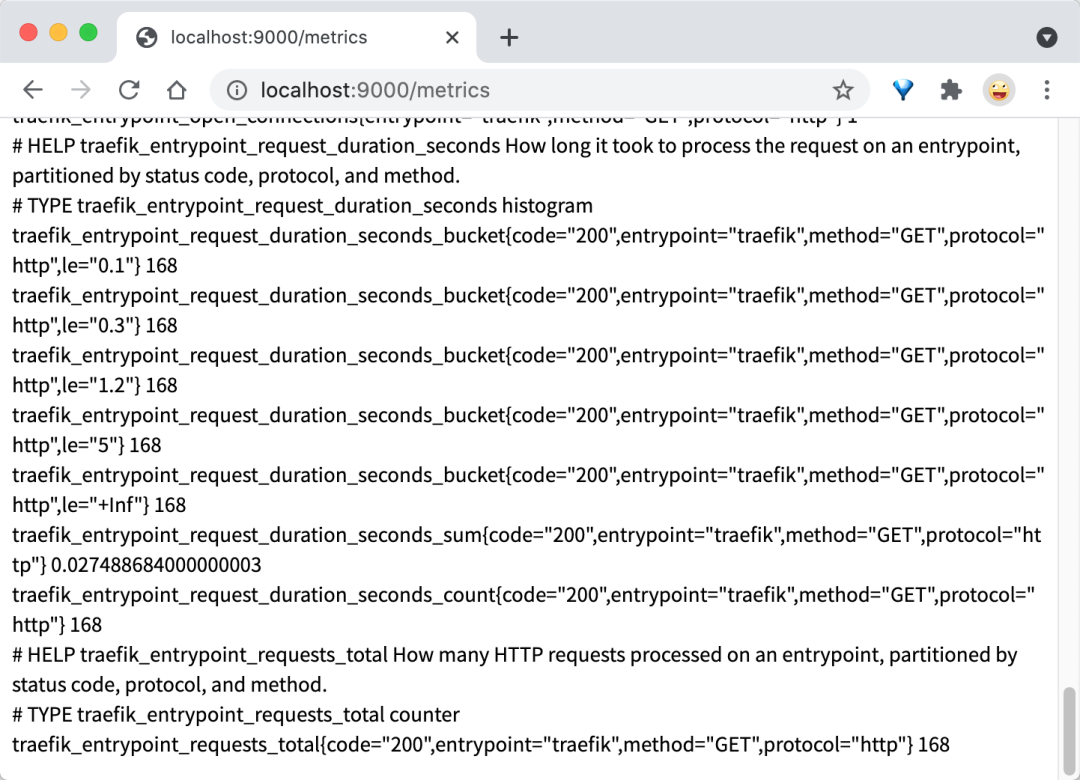
Additionally, we can access the http://localhost:9000/metrics endpoint to view some metrics provided by Traefik:
Deploying Prometheus Stack
The complete toolchain of Prometheus consists of many components. Installing and configuring it manually can take a long time. Interested readers can refer to our previous articles for related introductions. Similarly, we will directly use Prometheus’s Helm Charts to deploy:
$ helm repo add prometheus-community https://github.com/prometheus-community/helm-charts
$ helm repo update
The above repository provides many Charts. To see the complete list, you can use the search command:
$ helm search repo prometheus-communityHere we need to install the kube-prometheus-stack Chart, which will deploy the necessary components:
$ helm install prometheus-stack prometheus-community/kube-prometheus-stack
NAME: prometheus-stack
LAST DEPLOYED: Mon Apr  5 12:25:22 2021
NAMESPACE: default
STATUS: deployed
REVISION: 1
NOTES:kube-prometheus-stack has been installed. Check its status by running:  kubectl --namespace default get pods -l "release=prometheus-stack"
Visit https://github.com/prometheus-operator/kube-prometheus for instructions on how to create & configure Alertmanager and Prometheus instances using the Operator.
Configuring Traefik Monitoring
The Prometheus Operator provides a CRD called ServiceMonitor to configure the collection of monitoring metrics. Here we define an object as follows:
# traefik-service-monitor.yaml
apiVersion: monitoring.coreos.com/v1
kind: ServiceMonitor
metadata:
  name:  traefik
  namespace: default
  labels:
    app: traefik
    release: prometheus-stack
spec:
  jobLabel: traefik-metrics
  selector:
    matchLabels:
      app.kubernetes.io/instance: traefik
      app.kubernetes.io/name: traefik-dashboard
  namespaceSelector:
    matchNames:
      - kube-system
  endpoints:
    - port: traefik
      path: /metrics
According to the above configuration, Prometheus will fetch the /metrics endpoint of the traefik-dashboard service. It is important to note that the traefik-dashboard service is created in the kube-system namespace, while the ServiceMonitor is deployed in the default namespace, so we use namespaceSelector for namespace matching.
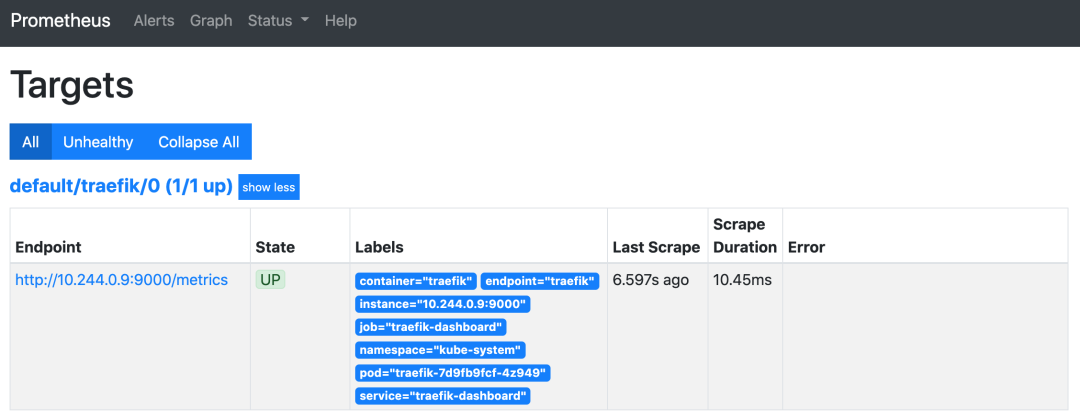
$ kubectl apply -f traefik-service-monitor.yamlNext, we can verify whether Prometheus has started scraping Traefik’s metrics.
Configuring Traefik Alerts
Next, we can also add an alerting rule that will trigger an alert when conditions are met. Similarly, the Prometheus Operator provides a CRD object called PrometheusRule to configure alerting rules:
# traefik-rules.yaml
apiVersion: monitoring.coreos.com/v1
kind: PrometheusRule
metadata:
annotations:
meta.helm.sh/release-name: prometheus-stack
meta.helm.sh/release-namespace: default
labels:
app: kube-prometheus-stack
release: prometheus-stack
name: traefik-alert-rules
namespace: default
spec:
groups:
- name: Traefik
rules:
- alert: TooManyRequest
expr: avg(traefik_entrypoint_open_connections{job="traefik-dashboard",namespace="kube-system"}) > 5
for: 1m
labels:
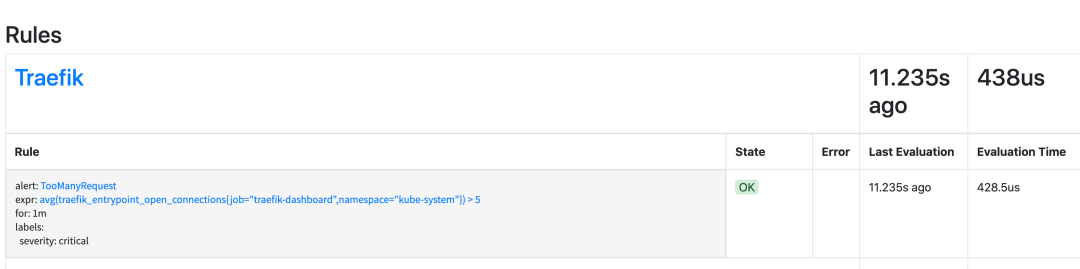
severity: criticalHere we define a rule: if there are more than 5 open connections within 1 minute, it will trigger a TooManyRequest alert. Simply create this object:
$ kubectl apply -f traefik-rules.yamlOnce created, you can normally see the corresponding alerting rule under the Status > Rules page in Prometheus’s Dashboard:
Grafana Configuration
When we deployed using the kube-prometheus-stack Helm Chart earlier, Grafana was already deployed. Next, we can configure a Dashboard for Traefik’s monitoring metrics. First, we will access Grafana using port forwarding:
$ kubectl port-forward service/prometheus-stack-grafana 10080:80Then, when accessing the Grafana GUI (http://localhost:10080), it will ask for a username and password. The default login username is admin, and the password is prom-operator. The password can be obtained from a Kubernetes Secret object named prometheus-operator-grafana.
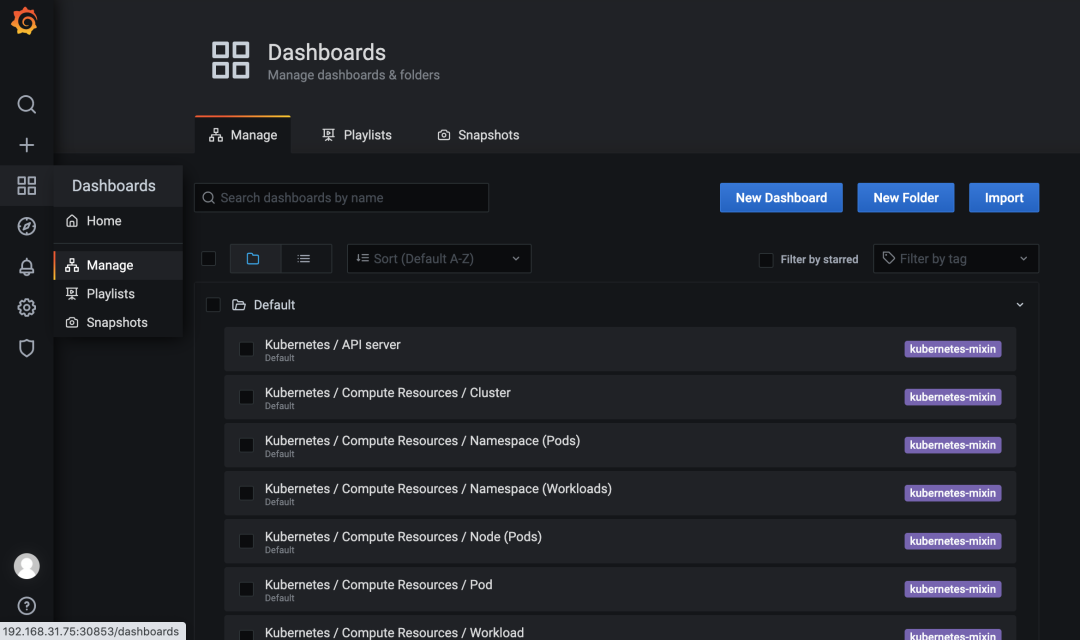
Of course, we can create a custom Dashboard for Traefik or import a suitable one from Grafana’s official community. Click on the square icon in the left navigation bar, navigate to Dashboards > Manage, and you can add a dashboard.
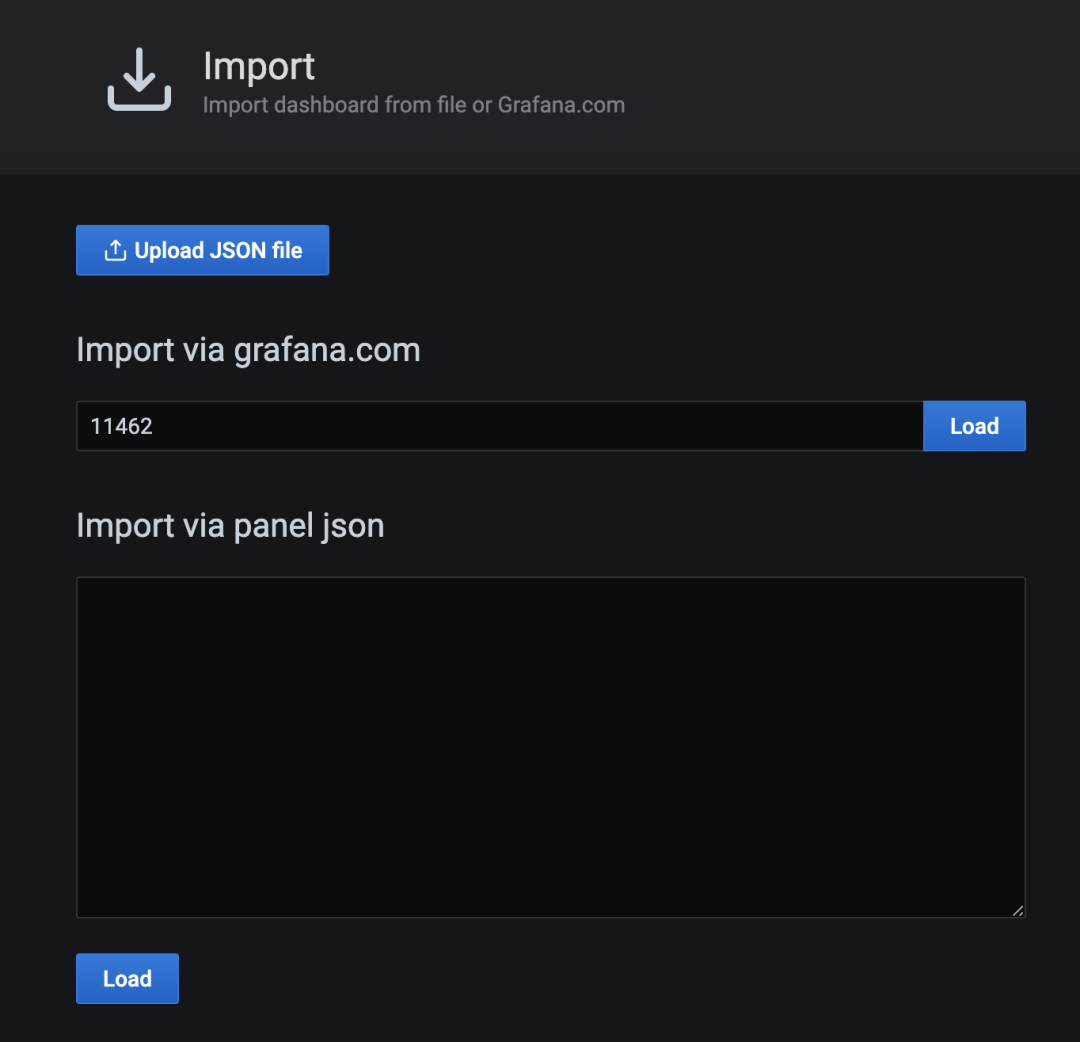
Click the Import button in the upper right corner, enter 11462 as the Dashboard ID, corresponding to the Traefik 2 dashboard contributed by user timoreymann.
After clicking Load, you should see the related information of the imported dashboard.
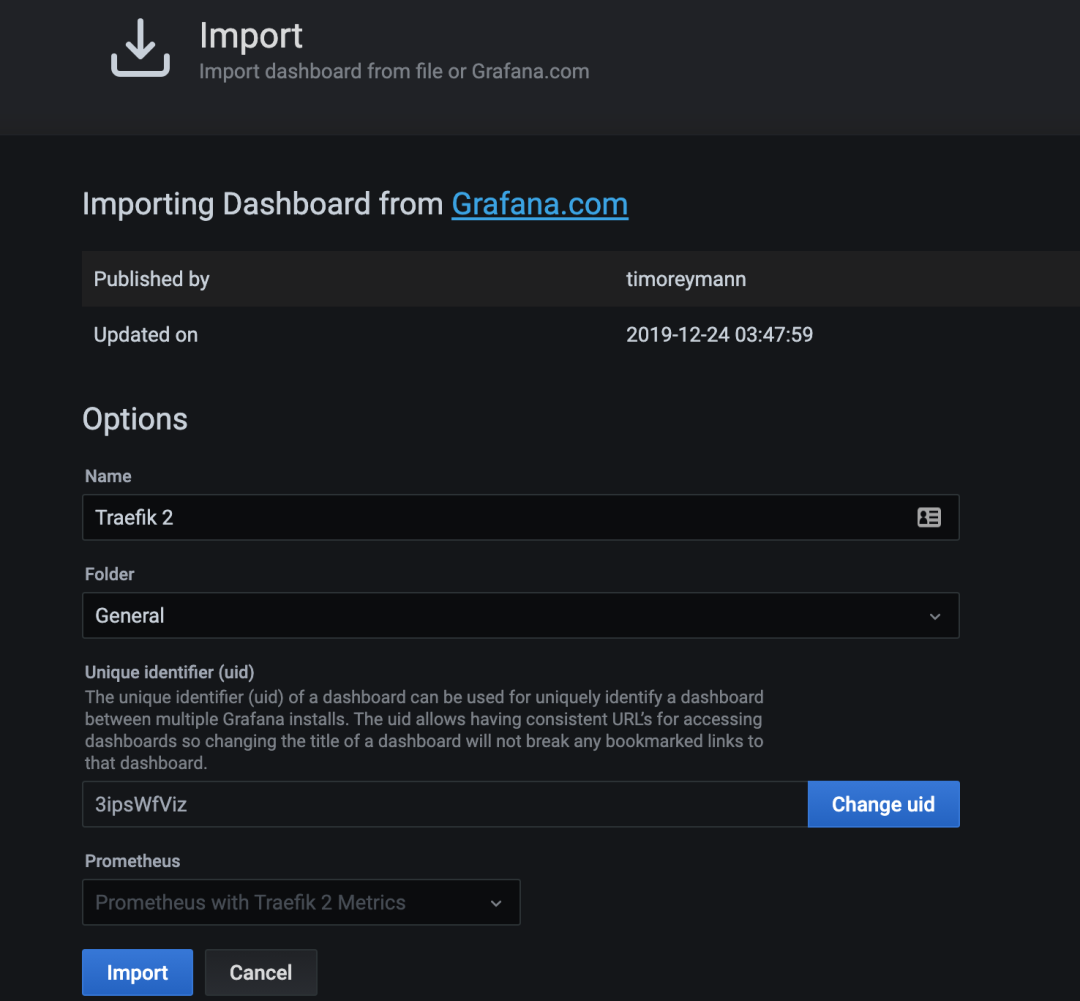
At the bottom, there is a dropdown menu. Select the Prometheus data source, and then click Import to generate the dashboard as shown below.
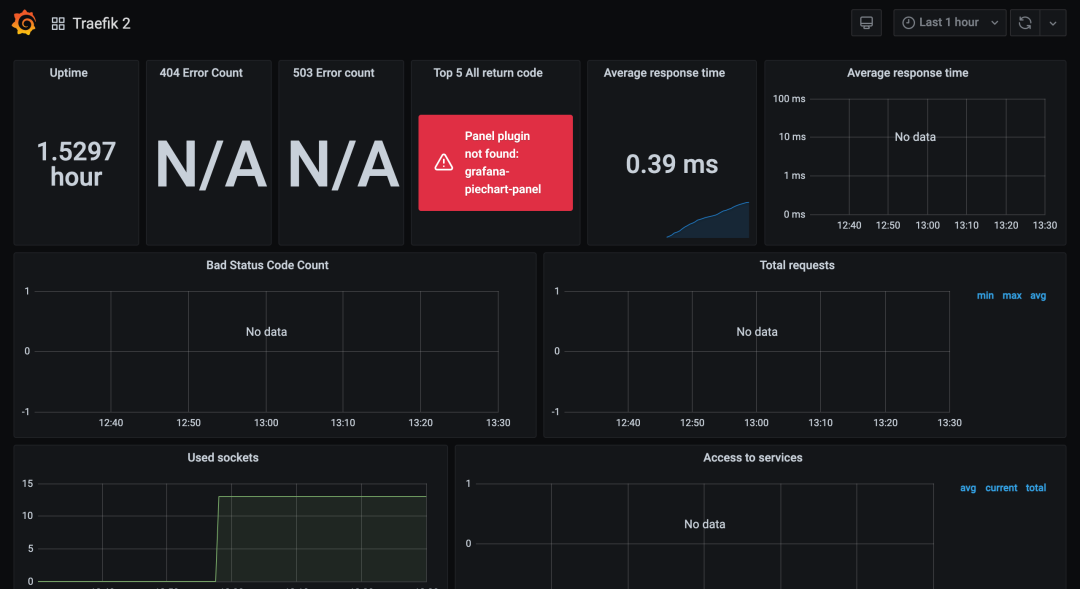
Testing
Now, Traefik is up and running, and the metrics have been obtained by Prometheus and Grafana. Next, we need to use an application to test. Here we will deploy the HTTPBin service, which provides many endpoints for simulating different types of user traffic. The corresponding resource manifest file is as follows:
# httpbin.yaml
apiVersion: apps/v1
kind: Deployment
metadata:
  name: httpbin
  labels:
    app: httpbin
spec:
  replicas: 1
  selector:
    matchLabels:
      app: httpbin
  template:
    metadata:
      labels:
        app: httpbin
    spec:
      containers:
      - image: kennethreitz/httpbin
        name: httpbin
        ports:
        - containerPort: 80
---
apiVersion: v1
kind: Service
metadata:
  name: httpbin
spec:
  ports:
    - name: http
      port: 8000
      targetPort: 80
  selector:
    app: httpbin
---
apiVersion: traefik.containo.us/v1alpha1
kind: IngressRoute
metadata:
  name: httpbin
spec:
  entryPoints:
    - web
  routes:
    - match: Host(`httpbin.local`)
      kind: Rule
      services:
      - name: httpbin
        port: 8000
Create the above resource manifest directly:
$ kubectl apply -f httpbin.yaml
deployment.apps/httpbin created
service/httpbin created
 ingressroute.traefik.containo.us/httpbin created
The httpbin route will match the hostname httpbin.local and then forward the request to the httpbin Service:
$ curl -I http://192.168.31.75  -H "host:httpbin.local"
HTTP/1.1 200 OK
Access-Control-Allow-Credentials: true
Access-Control-Allow-Origin: *
Content-Length: 9593
Content-Type: text/html; charset=utf-8
Date: Mon, 05 Apr 2021 05:43:16 GMT
Server: gunicorn/19.9.0
Here, the Traefik we deployed uses the hostPort mode, pinned to the master node. The IP address 192.168.31.75 is the IP address of the master node.
Next, we will use ab to access the HTTPBin service to simulate some traffic, and these requests will generate corresponding metrics. Execute the following scripts:
$ ab -c 5 -n 10000  -m PATCH -H "host:httpbin.local" -H "accept: application/json" http://192.168.31.75/patch
$ ab -c 5 -n 10000  -m GET -H "host:httpbin.local" -H "accept: application/json" http://192.168.31.75/get
$ ab -c 5 -n 10000  -m POST -H "host:httpbin.local" -H "accept: application/json" http://192.168.31.75/post
After a normal period of time, check the Grafana Dashboard to see more information displayed:
Including: uptime, average response time, total number of requests, request counts based on HTTP methods and services, etc.
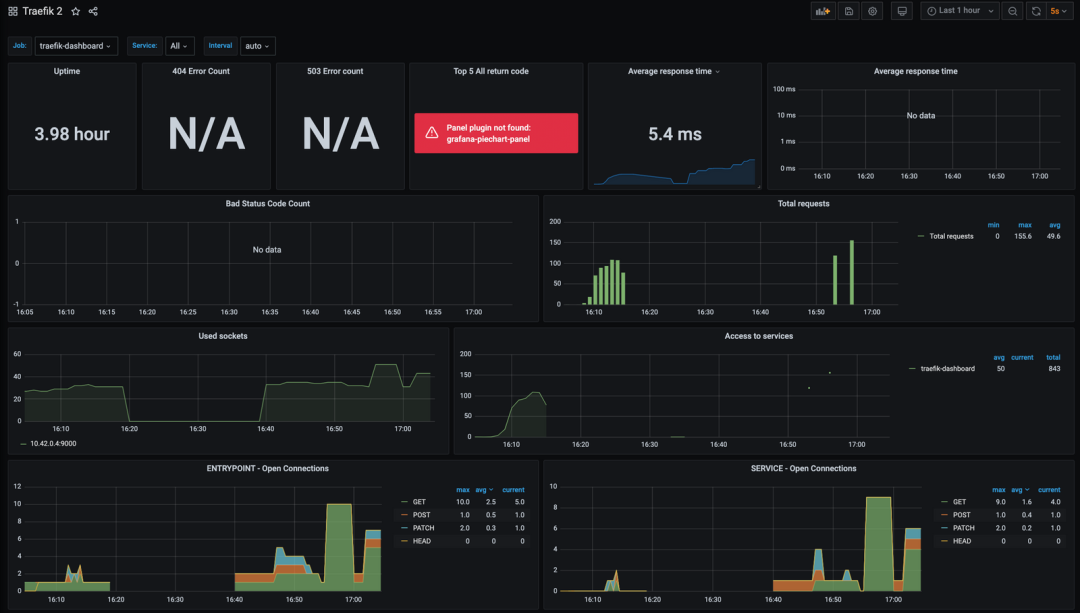
Finally, when we test application traffic, Prometheus may trigger alerts, and the previously created TooManyRequest alert will appear on the Alertmanager dashboard. You can configure the Receiver to receive alert information as needed.
$ kubectl port-forward service/prometheus-stack-kube-prom-alertmanager 9093:9093
Forwarding from 127.0.0.1:9093 -> 9093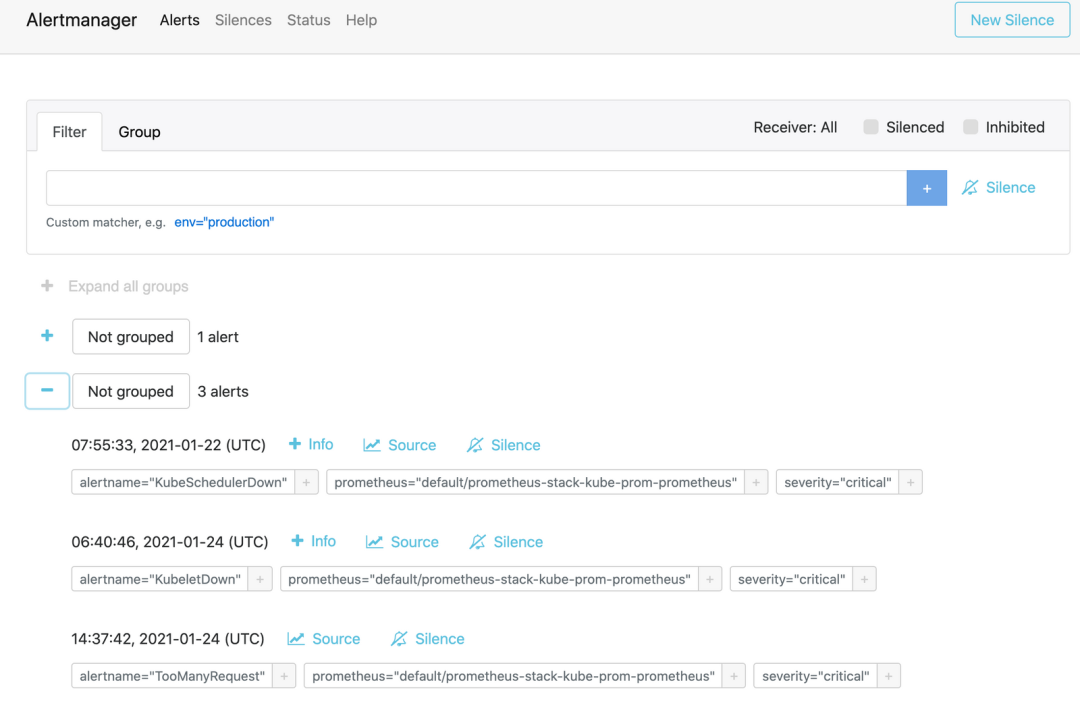
Conclusion
In this article, we have seen that connecting Traefik to Prometheus and Grafana to create visualizations from Traefik metrics is very simple. Once familiar with these tools, we can also create some dashboards based on actual needs to expose key data of your environment.
Next, we will focus on introducing log collection and Jaeger application tracing in Traefik SRE technology.
K8S Advanced Training Camp