Today, I will analyze an article published in April 2024 in Sci Rep (IF:4.0) titled “Unveiling the link between lactate metabolism and rheumatoid arthritis through integration of bioinformatics and machine learning“. Rheumatoid arthritis (RA) is a chronic autoimmune disease characterized by synovitis and joint damage. Recent research findings suggest a potential link with abnormal lactate metabolism. This study aims to identify lactate metabolism-related genes (LMRG) in RA and explore their correlation with the immune molecular mechanisms of RA. The gene expression profile data from RA synovial tissue samples were obtained from the Gene Expression Omnibus (GEO) database. By acquiring common LMRD and selecting gene sets through the support vector machine (SVM) model, biological markers were obtained. Functional enrichment analysis was conducted, followed by immune infiltration analysis and protein-protein interaction networks. The results showed that, as potential biomarkers related to lactate metabolism in RA, KCNN4 and SLC25A4 may participate in regulating macrophage function in the immune response to RA, while GATA2 is involved in the immune mechanism of dendritic cells. In summary, this study utilizes bioinformatics analysis and machine learning to identify biomarkers related to lactate metabolism in RA and examines their relationship with immune cell infiltration. These findings provide new insights into potential diagnostic and therapeutic targets for RA.
Background
Rheumatoid arthritis (RA) is a systemic autoimmune disease that clinically manifests as cartilage and bone destruction, often leading to disability and reduced lifespan. It is estimated that the global prevalence of RA is between 0.3-1%, with a male-to-female ratio of 1:6. The incidence of RA in the Asia-Pacific region is approximately 0.3-0.5%. The large population in this region poses significant challenges to the economic burden of RA and the utilization of healthcare resources. Due to the persistent growth of CD4+ T cells in the early stages of RA, various immune cells (such as synovial fibroblasts, monocytes, macrophages, and dendritic cells) may infiltrate and be stimulated for proliferation and differentiation. This process generates numerous pro-inflammatory factors, chemokines, and angiogenic factors. Recent literature reviews in this field have recognized lactate as a potential indicator of RA. Lactate may act as an active substance in RA patients, significantly infiltrating lymphocytes in the synovium, leading to the transformation of CD4+ T cells into a pro-inflammatory state and exacerbating the disease..Lactate is primarily produced in the cytoplasm due to increased glycolysis rates in hypoxic or rapidly dividing cells. Accumulated lactate is transported to surrounding areas, where it may enter various cells, including CD4+ T cells, macrophages, dendritic cells, and osteoclasts. Lactate has two potential effects. On one hand, active immune cells prefer lactate as a means to support their activity. Conversely, the accumulation of lactate in the tissue microenvironment acts as a signaling molecule, limiting the function of immune cells. As a result, target cells may undergo differentiation and activation, affecting their performance and ultimately leading to the development of RA. Nevertheless, the exact molecular processes of lactate metabolism and immune cell infiltration in RA remain unclear. Therefore, the search for biomarkers is of great significance for identifying and treating RA using immunotherapy.
Increasingly, research has focused on the critical significance of immune infiltration in the progression of RA. Most inflammatory infiltrates in RA consist of myeloid pathological types derived from synovial tissues, including monocytes and/or macrophages. There is a positive correlation between the degree of macrophage infiltration in joint tissues and the levels of cytokines derived from monocytes in the bloodstream. Furthermore, identifying genes associated with RA diagnosis largely relies on bioinformatics analysis and machine learning techniques. Previous bioinformatics investigations have shown that CLP1 can significantly influence the progression of RA by modifying immune cell infiltration. The potential usefulness of LSP1, GNLY, and MEOX2 in diagnosing and treating RA should not be underestimated, as well as the potential impact of immune cell infiltration on the development and progression of RA. A recent study found that GZMA-Tfh cells, CCL5-M1 macrophages, and CXCR4 memory-activated CD4+ T cells/Tfh cells may influence the occurrence and development of RA, particularly emphasizing the role of GZMA-Tfh cells in the initial stage of the pathogenesis of RA. However, little is known about the molecular processes of lactate metabolism and immune cell infiltration in RA. Further investigation of immune cell infiltration and exploration of potential therapeutic targets associated with it is necessary.
This study utilized microarray datasets of synovial tissues from RA patients without health issues obtained from the GEO database. This dataset was used to screen for lactate metabolism-related genes. Additionally, bioinformatics analysis and machine learning were employed, utilizing the CIBERSORTx and ssGSEA algorithms for immune infiltration analysis. The goal was to determine the differences in immune cell infiltration and potential biomarkers and to explore the relationship between immune cells and lactate metabolism-related genes, as well as the role of lactate metabolism in immune cell infiltration during the progression of RA.
Methods:
1.Data and Sample Sources
2.Identification of Differentially Expressed Genes
3.Support Vector Machine (SVM) Screening Model
4.Gene Ontology (GO) and Kyoto Encyclopedia of Genes and Genomes (KEGG)
5.Gene Set Enrichment Analysis (GSEA)
6.Gene Set Variation Analysis (GSVA)
7.Immune Infiltration Analysis
8.Protein-Protein Interaction (PPI)
9.RNA-miRNA, mRNA-TF, mRNA-Drug, mRNA-RBP Prediction Networks
10.Statistical Analysis
Results
Technical Roadmap
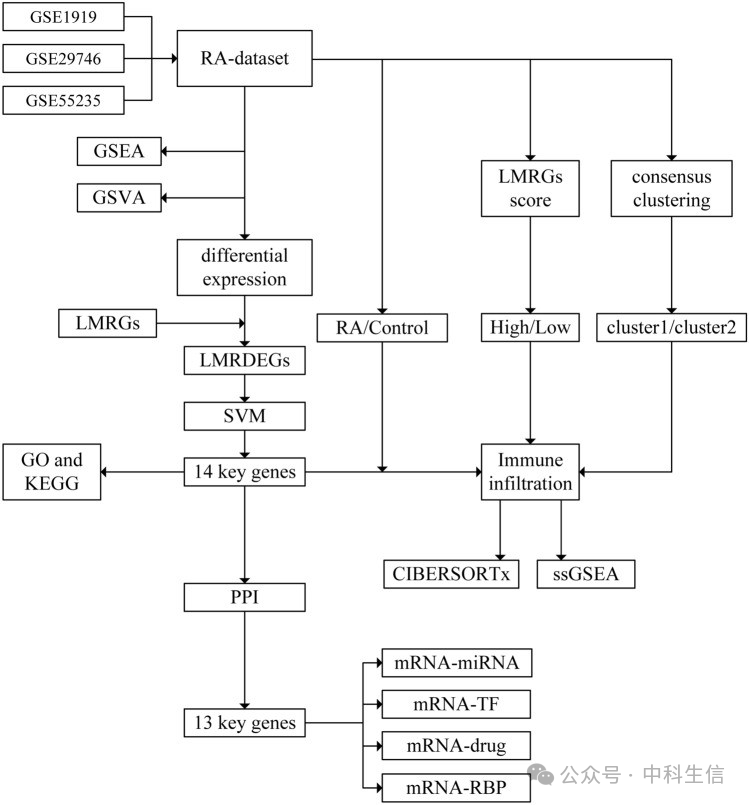
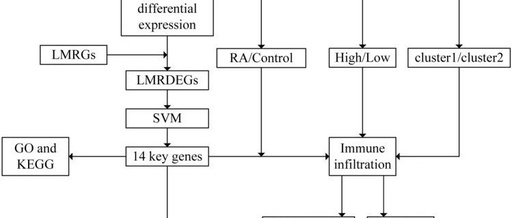
Figure 1 shows the flowchart. Initially, the datasets related to RA such as GSE1919, GSE29746, and GSE55235 were batch corrected for effects. Subsequently, a combined RA dataset was obtained and analyzed, comparing the RA group with the control group. Differentially expressed genes (DEGs) and lactate metabolism-related genes (LMRGs) that met the criteria of |logFC|> 0 and P < 0.05 were filtered and intersected to derive LMRDEGs. The charts illustrate comparisons, and we analyzed the chromosomal locations and functional similarities of important genes, performing correlation analysis on the expression of these genes in the RA dataset. Using GO and KEGG methods, we analyzed key genes. Subsequently, we performed GSEA, GSVA, and immune infiltration analyses on all samples in the RA dataset using both the CIBERSORTx and ssGSEA algorithms. Next, we created a score for the LMRGs using the key genes in the RA dataset. We then divided the RA group samples into high and low groups based on the median of the phenotypic scores. Finally, we analyzed the immune infiltration of these classified data using the CIBERSORTx and ssGSEA algorithms. Next, we established disease subcategories based on key genes in the RA group of the RA dataset. The results were then divided into two clusters: cluster1 and cluster2. Subsequently, we conducted immune infiltration analysis on this group using the CIBERSORTx and ssGSEA algorithms. We constructed a PPI network by selecting essential genes with a confidence threshold of 0.150 from the STRING database. We input the protein genes interacting with other genes into the GeneMANIA database. Finally, we collected information from the ENCORI database to create mRNA-miRNA and mRNA-RBP interaction networks for key genes. Additionally, we constructed mRNA-TF interaction networks using data from the ChIPBase3.0 database and obtained data from the DGidb database to establish mRNA-drug interaction networks for key genes.
Changes in LMRG Expression in the RA Dataset
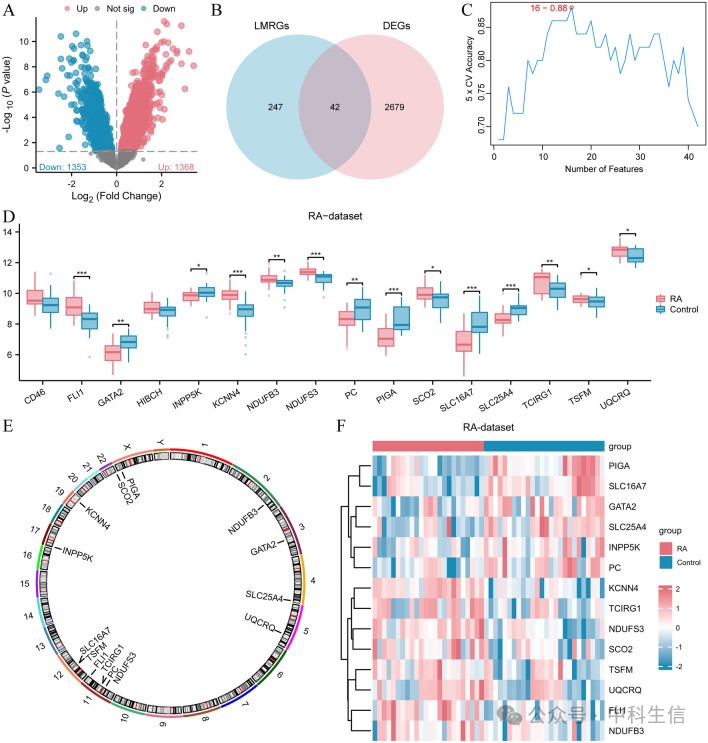
The RA datasets GSE1919, GSE29746, and GSE55235 underwent batch effect removal, resulting in a combined RA dataset. A total of 2,721 genes met the criteria of |logFC|> 0, P < 0.05. Among these genes, 1,368 were upregulated in the RA group, while the remaining 1,353 genes were downregulated in the RA group. A volcano plot (Figure 2A) visualizes the differential analysis results of the RA dataset. By comparing the acquired genes with those expressed differently from the LMRG, we successfully identified 42 LMRDEGs. Moreover, a Venn diagram (Figure 2B) was created to visually represent the intersecting genes. We used SVM to filter key genes from the RA dataset. The model results (Figure 2C) revealed 16 genes (CD46, FLI1, GATA2, HIBCH, INPP5K, KCNN4, NDUFB3, NDUFS3, PC, PIGA, SCO2, SLC16A7, SLC25A4, TCIRG1, TSFM, UQCRQ). Next, we examined the expression level changes of the 16 LMRDEGs between the RA group and the control group. Figure 2D displays the comparison chart of the findings. The results indicated that 14 genes (FLI1, GATA2, INPP5K, KCNN4, NDUFB3, NDUFS3, PC, PIGA, SCO2, SLC16A7, SLC25A4, TCIRG1, TSFM, and UQCRQ) exhibited statistically significant differences between the two groups (P < 0.05). These 14 genes will be considered key genes in subsequent analyses. Table S2 provides detailed information about each gene. We annotated their locations and created a chromosomal location map to examine the positions of these 14 key genes on human chromosomes (Figure 2E). The map shows that genes FLI1, NDUFS3, PC, and TCIRG1 are located on chromosome 11, while SLC16A7 and TSFM are located on chromosome 12. The remaining key genes are dispersed across various chromosomes. A heatmap (Figure 2F) in the API displays the expression of the 14 key genes in the RA dataset.
GO and KEGG
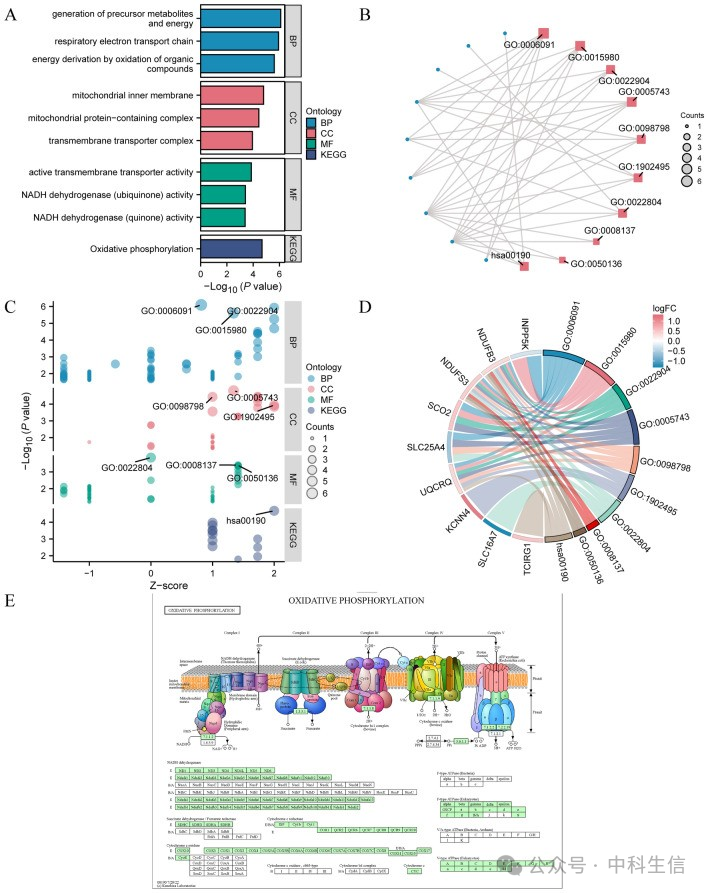
GO gene functional enrichment analysis was performed on the 14 genes to examine the biological processes, molecular functions, cellular components, and biological pathways associated with these 14 specific genes in RA. Enriched entries were screened based on P values less than 0.05 and FDR values (q values) less than 0.25. The results indicated that the 14 key genes were mainly concentrated in biological processes related to producing precursor metabolites and energy (GO 0006091), obtaining energy through the oxidation of organic compounds (GO 0015980), and respiratory electron transport chain (GO 0022904), as well as other biological processes in RA. Regarding cellular components, they are found in the mitochondrial inner membrane (GO 0005743), complexes containing mitochondrial proteins (GO 0098798), transmembrane transport protein complexes (GO 1902495), and other biological processes. Additionally, in terms of molecular function, they exhibit activities such as active transmembrane transporter activity (GO 0022804), NADH dehydrogenase (ubiquinone) activity (GO 0008137), NADH dehydrogenase (quinone) activity (GO 0050136), and other molecular functions. Subsequently, a KEGG enrichment analysis was conducted on the 14 key genes (Supplementary Table S3). The results showed that the 14 key genes were significantly enriched in the KEGG pathway, including oxidative phosphorylation (hsa00190). Histograms (Figure 3A) and divergent network diagrams (Figure 3B) display the results of GO and KEGG enrichment analyses. Next, we combined the logFC of the 14 key genes with the GO and KEGG enrichment analysis. Bubble diagrams (Figure 3C) and chord diagrams (Figure 3D) show the results of GO and KEGG enrichment analysis for the joints’ logFC. Furthermore, the pathway diagram depicts the KEGG pathway of oxidative phosphorylation (hsa00190) (Figure 3E).
GSEA
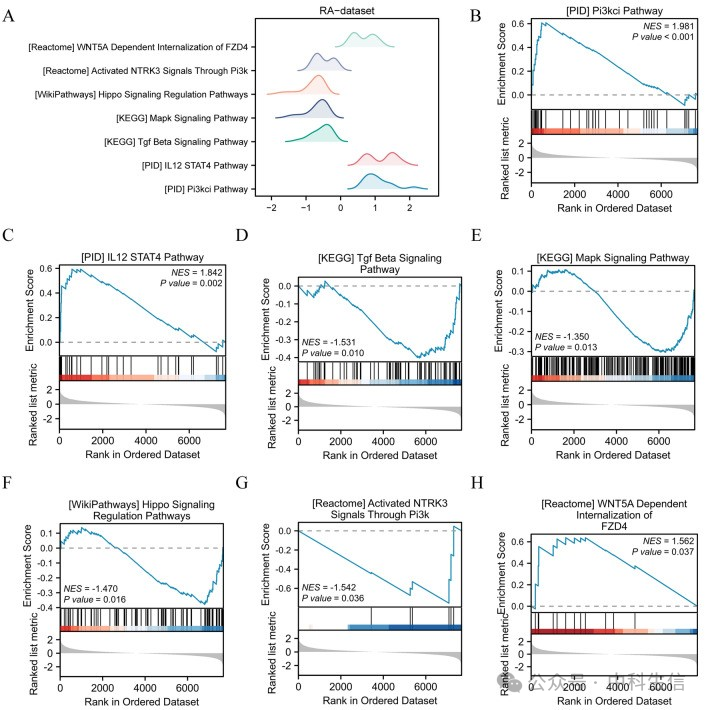
GSEA was performed to examine the impact of gene expression levels on the differences between the RA group and the control group in RA. A significance level of P < 0.05 and FDR values (q values) less than 0.25 were used as criteria for significant enrichment to establish relationships between functions (Supplementary Table S4). In the mountain plot (Figure 4A) and pathway diagrams (Figure 4B-H), we proposed significantly enriched pathways, including the PI3KCI pathway (Figure 4B), IL12 STAT4 pathway (Figure4C), TGF-β signaling pathway (Figure4D), MAPK signaling pathway (Figure4E), HIPPO signaling regulatory pathway (Figure 4F), and activation of NTRK3 signaling through PI3K (Figure4G) and WNT5A dependent internalization of FZD4 (Figure4H).
GSVA
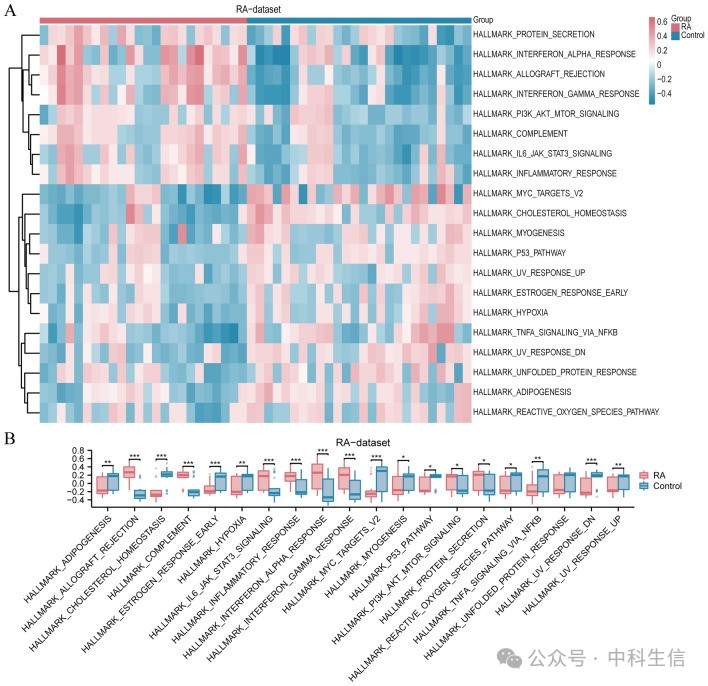
GSVA was performed on the gene expression data of all genes in the RA dataset to study the variations in characteristic gene sets between the RA group and the control group. The GSVA results indicated differences in 20 hallmark gene sets between the RA group and the control group (P values < 0.05, as shown in Figure 5A). We created a comparison chart (Figure 5B) for the 20 hallmark gene sets to illustrate the changes in expression levels. The analysis showed statistically significant differences (P values < 0.05) between the RA group and the control group in at least 19 hallmark gene sets.
CIBERSORTx Immune Infiltration (RA/Control)
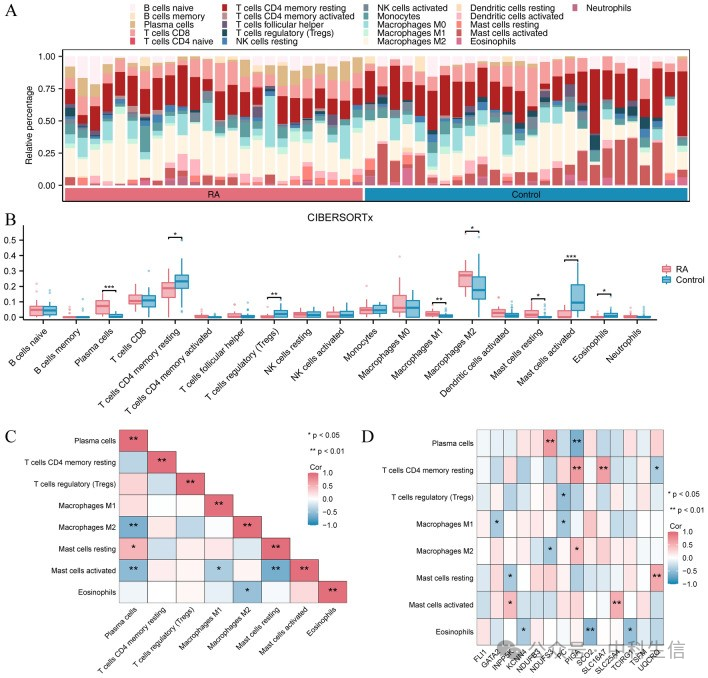
The CIBERSORTx algorithm was used to assess the abundance of 22 different immune cell types in the samples from the RA dataset to study the changes in immune infiltration between the RA group and the control group in the RA dataset. The histogram illustrates the distribution of immune cell infiltration abundance in the samples using the CIBERSORTx algorithm (Figure 6A). Next, we created a comparison chart showing the differences in immune infiltration between the RA group and the control group in the RA dataset (Figure 6B). The results indicated statistically significant variances in eight different types of immune cells (plasma cells, resting memory CD4 T cells, regulatory T cells (Tregs), M1 macrophages, M2 macrophages, resting mast cells, activated mast cells, eosinophils, M0 macrophages, and neutrophils) (P < 0.05). The heatmap (Figure 6C) illustrates the correlation between the levels of infiltration of the 8 immune cells and the 14 key genes. Additionally, the correlation heatmap (Figure 6D) shows a significant positive linear correlation between the gene UQCRQ and activated mast cells, as well as between the gene SLC25A4 and resting mast cells (r > 0, P < 0.05).
ssGSEA Immune Infiltration (RA/Control)
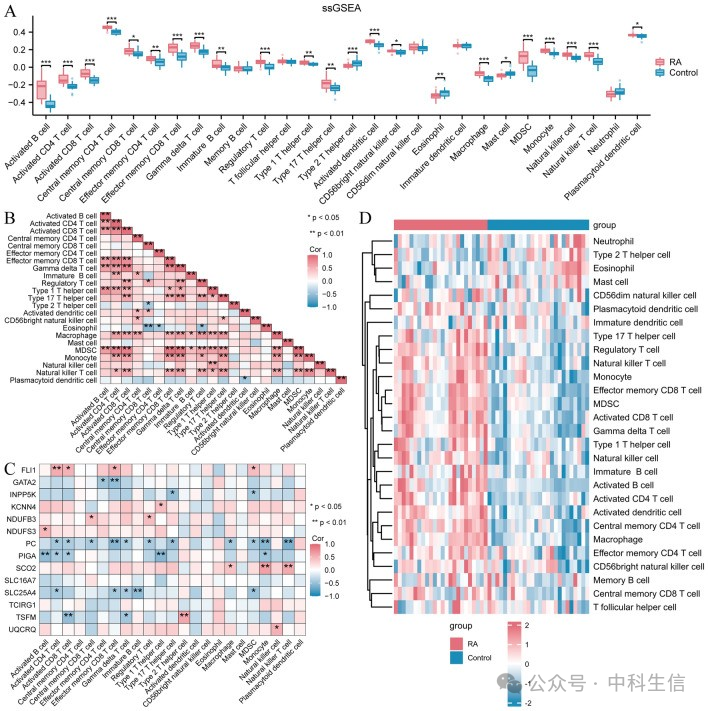
The ssGSEA algorithm was used to calculate the abundance of 28 different immune cell types present in the samples from the RA dataset to determine the variance in immune infiltration between the RA group and the control group. The results indicated significant differences in the infiltration abundance of 23 immune cell types between the RA group and the control group (Figure 7A) (P < 0.05). Next, we generated a heatmap illustrating the correlation between immune cell abundance and statistical significance of infiltration (Figure 7B). Additionally, we created a correlation heatmap to examine the relationships between these immune cells and the 14 key genes (Figure 7C). The results indicated significant favorable linear associations between these immune cells (r > 0), and significant positive linear correlations between genes (PC, PIGA, and SLC25A4) and these immune cells (r > 0). In summary, a detailed heatmap was created to illustrate the levels of infiltration of these immune cells, comparing the RA group and the control group in the RA dataset (Figure 7D).
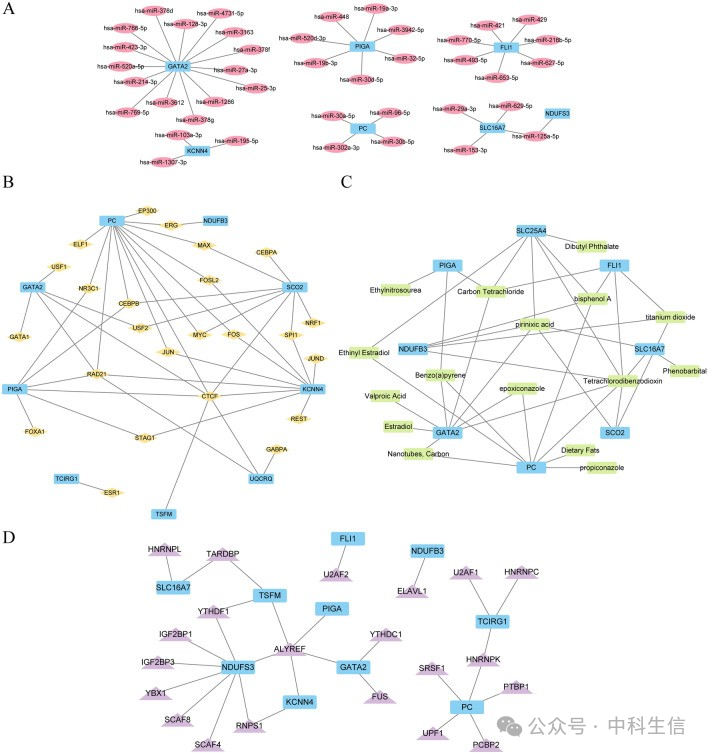
PPI Network and Prediction mRNA-miRNA, mRNA-TF, mRNA-Drug Networks, and Protein Domains Network
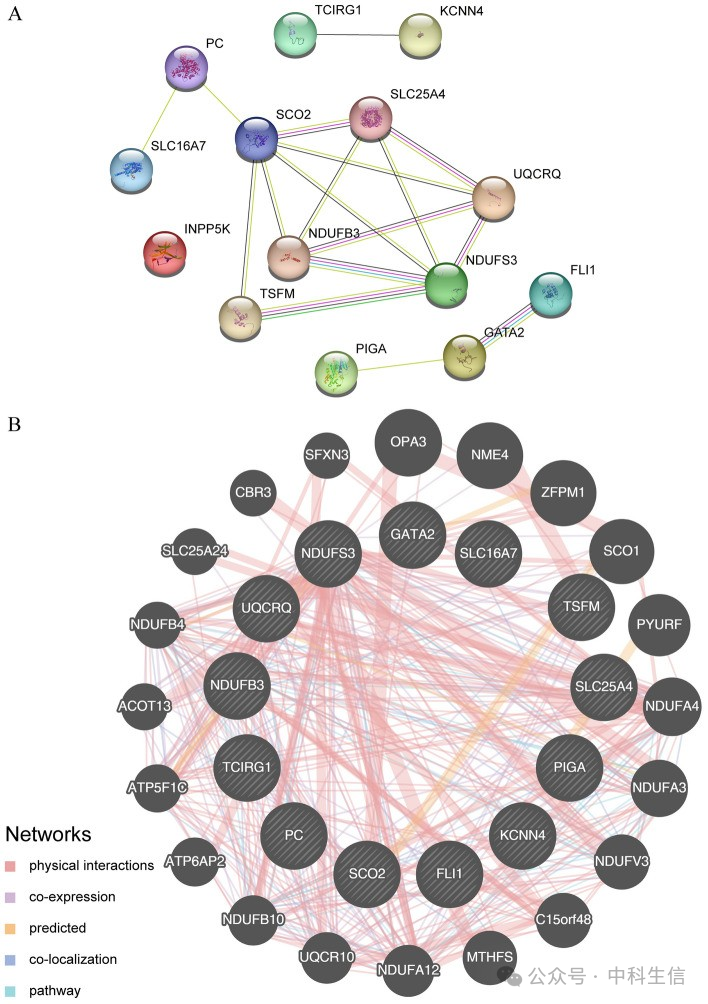
Using the STRING database, we examined the 14 key genes’ PPI interactions. A PPI interaction network for 13 key genes (excluding the gene INPP5K) was obtained, with the minimum confidence parameter (required interaction score) set at 0.150, indicating the minimum required interaction score of 0.150 (Figure 8A). Additionally, we utilized the GeneMANIA website (Figure 8B) to predict and construct an interaction network of functionally similar genes associated with these 13 key genes. This allowed us to examine their physical interaction relationships, co-expression, predictions, co-localization, pathway connections, and other relevant information. Subsequently, we analyzed mRNA-miRNA data using the ENCORI database and predicted the interactions of miRNAs with important genes. We analyzed mRNA-TF data using the ChIPBase3.0 database and identified TFs that interact with key genes. Cytoscape software was used to visualize the mRNA-miRNA interaction network (Figure 9A) and the mRNA-TF interaction network (Figure 9B). Detailed descriptions of the interactions between mRNAs and miRNAs, as well as specific mRNA-TF interactions, were provided. We predicted drug interactions with key genes using mRNA drug information from the DGidb database, and visualized the mRNA-drug interaction network using Cytoscape software (Figure 9C). This network includes 8 mRNAs (SLC25A4, GATA2, PC, SCO2, SLC16A7, FLI1, NDUFB3, and PIGA) and 16 drugs. We predicted RBPs interacting with key genes using mRNA-RBP data from the ENCORI database. Cytoscape software was used to visualize the mRNA-RBP interaction network, depicted in Figure 9D. The interaction network consists of 10 mRNAs (FLI1, GATA2, KCNN4, NDUFB3, NDUFS3, PC, PIGA, SLC16A7, TCIRG1, and TSFM) and 21 RBPs.