
Alibaba Guide: Pedestrian re-identification refers to the task of accurately finding the same person in images from different cameras given a picture of that person from one camera. This technology holds significant research and practical application value, and has recently been widely applied in fields such as traffic and security, playing an important role in creating safe and smart cities. Some may argue that “facial recognition technology” is already mature; however, in complex real-world scenarios, due to low resolution, occlusion, and different angles, it is often difficult to clearly see faces. Therefore, utilizing the full-body information of a person for retrieval becomes very necessary. This paper is included in ACM MM 2017 (the world’s top conference in multimedia), proposing a novel CNN-based pedestrian re-identification method, which we will explore in depth together.
Authors: Shen Chen, Jin Zhongming, Zhao Yiru, Fu Zhihang, Jiang Rongxin, Chen Yaowu, Hua Xiansheng
Abstract
Pedestrian re-identification (re-ID) aims to recognize relevant pedestrians across multiple camera views, and this task has received increasing attention in the computer vision community. In this paper, we propose a novel deep Siamese architecture based on Convolutional Neural Networks (CNN) and multi-level similarity awareness. By applying different similarity constraints to low-level and high-level feature maps during the training phase based on the different characteristics of various feature maps, our network can effectively learn discriminative feature representations at different levels, significantly improving re-ID performance.
Additionally, our framework has two other advantages. First, it can easily integrate classification constraints into the framework, forming a unified multi-task network with similarity constraints. Second, because the information of similarity is encoded in the learning parameters of the network through backpropagation, paired inputs are not necessary during testing. This means we can extract features from each image in the gallery and construct an index in an offline manner, which is crucial for large-scale real-world applications. We conducted experiments on several challenging benchmarks, and the results show that our method outperforms the current best methods.
1 Introduction
Pedestrian re-identification (re-ID) aims to match images of a person across multiple non-overlapping camera views. This task is gaining increasing attention due to its research and application value. However, pedestrian re-identification remains a highly challenging task because the appearance differences between different identity entities may be subtle (see Figure 1(a)), while the same identity entity may vary significantly under different lighting, angles, and partial occlusions (see Figures 1(b), 1(c), 1(d)).
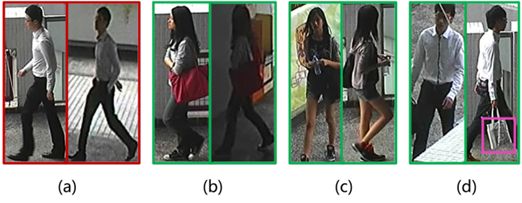
Figure 1: Various complexities of pedestrian re-identification, from the CUHK03 dataset. The green boxes indicate the same identity, while the red boxes indicate different identities. The pink box in (d) highlights a prominent local pattern (handbag) that can easily be lost due to partial occlusion.
Technically, pedestrian re-identification consists of two main components: feature representation and distance metric. Recently, CNN-based deep learning methods have shown outstanding superiority in pedestrian re-identification as they can jointly learn complex feature representations and discriminative distance metrics.
In this paper, we propose a novel CNN-based pedestrian re-identification solution called Multi-Level Similarity-Aware Convolutional Neural Network (MSP-CNN). During the training phase, we utilize a Siamese model that takes image pairs as input, where all images are processed through the same deep CNN with shared parameters. This benchmark network is carefully designed, using very small convolutional filters and Inception modules. Next, we delve into how to effectively apply similarity constraints to different feature maps.
Figure 2 shows the overall architecture of our proposed network during the training phase. Figure 3 shows the overall architecture of the network during the testing phase.
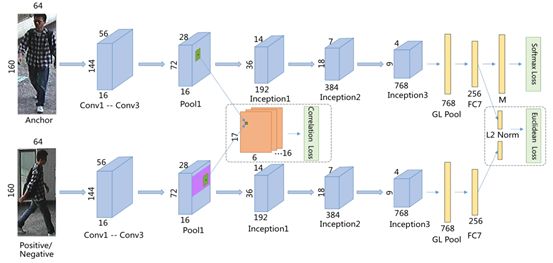
Figure 2: Schematic diagram of the multi-task framework during the training phase. Specifically, we optimize the similarity constraints at the low-level Pool1 layer and the high-level FC7 layer. The purple areas on the feature map of the Pool1 layer for positive (or negative) example images indicate the wide search area used for cross-correlation when obtaining local semantic patterns. Additionally, softmax loss is also used to optimize classification constraints, where M denotes the number of pedestrian identity entities.
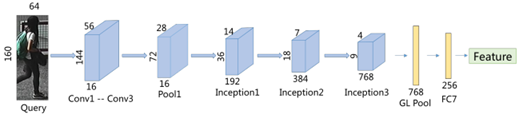
Figure 3: Network architecture during testing.
Thus, our work has three key advantages and main contributions.
-
We propose a novel Siamese model for pedestrian re-identification and innovatively apply corresponding distance metrics on different feature maps. This multi-level similarity-aware mechanism cleverly matches the characteristics of different level feature maps and significantly enhances performance.
-
We employ a multi-task architecture to simultaneously optimize classification constraints and similarity constraints. Multi-task learning can achieve knowledge sharing while solving multiple related tasks, thus combining the advantages of both.
-
During testing, we can avoid the time-inefficient process of paired inputs and can extract image features to construct an index in advance, which is crucial for large-scale real-world application scenarios.
2 Our Proposed Method
2.1 Method Overview
Drawing from the network structure proposed in [1] for pedestrian re-identification, we have carefully designed a CNN-based backbone network, expecting it to achieve strong baseline results superior to most existing deep learning frameworks using only a single softmax loss. To accommodate the sizes of most pedestrian images (which are typically small and not square), all input images are resized to 160×64 and randomly cropped to 144×56 for data augmentation.
We then consider similarity constraints from a complementary perspective and construct a multi-task architecture for the classification task. This design aims to leverage the strengths of both, fully utilizing the information regarding pedestrian re-identification annotations and the considerable similarity information between positive and negative pairs. To better describe the similarity constraints by utilizing the relevant information of different level feature maps (which most previous studies have overlooked), we visualize certain typical feature maps learned by our basic CNN classification network.
As shown in Figure 4, the responses of low-level feature maps are typically dense and reflect local semantic regions. For instance, the features from channel #0 of the Conv1 layer strongly respond to dark areas (hair and pants), while features from channel #9 of the Conv2 layer emphasize bright white areas (short-sleeved shirts). This phenomenon can also be verified based on the feature maps of the Pool1 layer. As the layers deepen, their feature maps become progressively sparser and often encode more abstract global features. For example, some channels of the Inception (1a) layer still reflect local semantic regions (red backpack, #11), but most channels are very sparse (#91). The internal mechanism is that the discriminative local features obtained from low-level convolutional layers propagate to higher-level layers (especially fully connected layers), where these features become abstract and form global representations.
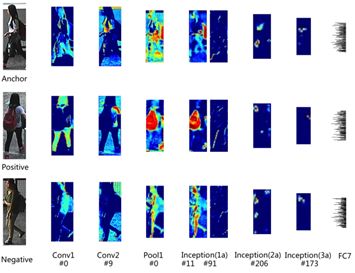
Figure 4: Visualization of feature maps learned by our basic CNN classification network. Each row represents certain typical feature maps from a person’s image from low-level to high-level. The first row: anchor image; second row: positive example image; last row: negative example image. We also labeled the corresponding channel numbers of each feature map with a # sign.
For low-level feature maps, typical local areas (like the red backpack in Figure 4) are present in images of the same person, which is crucial for distinguishing positive pairs from negative pairs. Therefore, we assume that for a specific patch on the feature map of the first image, if we can find its most similar patch on the corresponding feature map of another positive example image, then such a patch pair is very likely to represent a discriminative local area. Based on this assumption, we can naturally design a target to seek and emphasize this discriminative area so that our network can propagate more relevant features to higher layers.
Inspired by [2], we adopt normalized cross-correlation as a non-exact matching technique to match pixel regions over large areas. It has been demonstrated in [2] that using normalized cross-correlation and searching over larger areas can maintain robustness under significant variations in viewpoint, lighting changes, or partial occlusions. The normalized cross-correlation score ranges from [-1,1], where -1 indicates completely dissimilar feature vectors and 1 indicates highly similar feature vectors.
Thus, for each local patch of the first feature map, we find the most similar patch in the second feature map by selecting the patch with the largest cross-correlation response. We then design a loss function aimed at enhancing the cross-correlation score based on positive pairs (i.e., discriminative areas) while diminishing the cross-correlation score based on negative pairs (i.e., some disturbance).
Therefore, our design can adaptively focus more on the shared local semantic discriminative areas between positive pairs and amplify this local similarity along higher layers through forward propagation. It should be noted that there are some shared semantic patterns (like black hair) between positive and negative images, but these patterns cannot be considered as discriminative information. Thus, for negative pairs, we will ignore such situations.
As for high-level feature maps, especially the feature maps of fully connected layers, we directly use Euclidean distance to represent their similarity after L2 normalization and design a loss function aimed at reducing the distance between positive pairs and increasing the distance between negative pairs.
2.2 Multi-Level Similarity Awareness
Low-Level Similarity. We apply low-level similarity constraints on the feature maps of the Pool1 layer, as shown in Figure 2.
High-Level Similarity. High-level similarity constraints (i.e., optimizing Euclidean distance) are applied to the feature maps of the final fully connected layer (i.e., the FC7 layer in Figure 2).
2.3 Multi-Task Network Architecture
Joint Training. As previously mentioned, we propose a novel Siamese network that can apply different similarity constraints to corresponding feature maps during the training phase. Additionally, we combine similarity constraints and classification constraints to build a unified multi-task network.
As shown in Figure 2, low-level and high-level similarity constraints are applied to the Pool1 layer and FC7 layer, respectively. This choice is also determined by the validation set.
The training process of the proposed MSP-CNN is divided into two stages. We first train a carefully designed CNN multi-task network from scratch on the corresponding dataset using softmax loss and Euclidean distance loss. Then, we add low-level cross-correlation loss and continue training the CNN for several epochs. Since the gradients for low-level layers are typically small, providing gradients for low-level layers directly with cross-correlation loss should achieve better accuracy optimization at a relatively stable stage. Furthermore, cross-correlation loss converges quickly, so we only need to optimize it for a few epochs to prevent overfitting.
Testing. As previously mentioned, the features of each image in the gallery can be extracted in advance according to the process shown in Figure 3. When a query occurs, the images in the gallery are ranked based on their similarity to the probe image, where the similarity between image features is calculated using Euclidean distance. We can even leverage certain indexing techniques (like inverted indexing or hashing) to construct an index based on these image features, further enhancing retrieval efficiency (especially for large-scale datasets).
3 Experiments
3.1 Datasets and Protocols
We conducted experiments on the large dataset CUHK03, Market-1501, and the small dataset CUHK01. In our experiments, we used the most commonly used Cumulative Match Characteristic (CMC) top-k accuracy to evaluate all methods. We also used Mean Average Precision (mAP) for the Market-1501 dataset. All evaluation results are from single queries.
3.2 Implementation Details
Inspired by [1], we carefully designed a basic CNN network composed of 3 CONV modules, 6 Inception modules, and 1 FC module. Each CONV module contains a convolution (conv) layer followed by a batch normalization (BN) layer and a ReLU layer. The conv layer uses a very small filter (3×3) (inspired by VGGNet), and the BN layer serves to accelerate the convergence speed. The Inception module refers to GoogLeNet, and we replaced each 5×5 convolution with 2 3×3 convolutions, as suggested by Inception-v3. The FC module consists of a fully connected layer followed by a BN layer, ReLU layer, and dropout layer. Table 1 provides detailed structure.
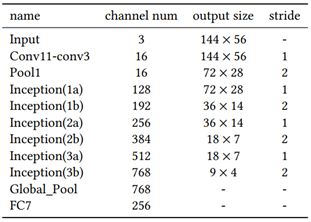
Table 1: Basic Network Structure
Our algorithm is implemented based on the deep learning framework Caffe, running on a workstation equipped with an NVIDIA M40 GPU card.
3.3 Training Strategy
We designed a sampling strategy during the training phase, maintaining a ratio of 2:1 between the number of negative pairs and positive pairs, as shown in Figure 5.
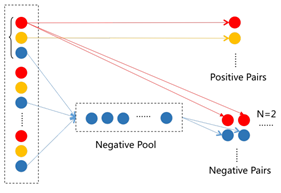
Figure 5: Schematic diagram of the sampling process. The red circles represent anchor images, the orange circles represent positive example images, and the blue circles represent negative example images.
Data Augmentation. We followed the classic techniques proposed by AlexNet [3].
4 Results and Discussion
4.1 Comparison with Current Best Methods
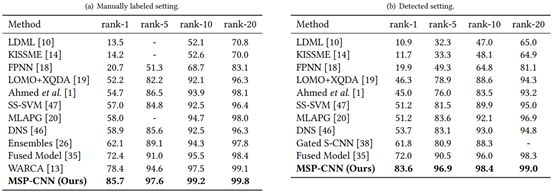
Table 2: Comparison of the performance of current best methods on the CUHK03 dataset at CMC ranks of 1, 5, 10, and 20. (a) Human-annotated bounding box settings. (b) Detected human bounding box settings.
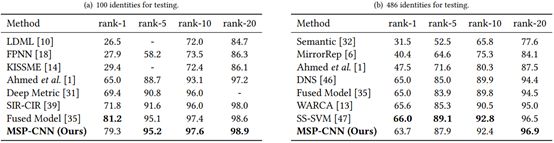
Table 3: Comparison of the performance of current best methods on the CUHK01 dataset at CMC ranks of 1, 5, 10, and 20. (a) Testing with 100 identities. (b) Testing with 486 identities.
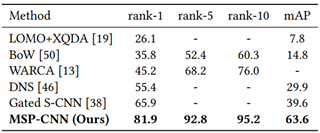
Table 4: Performance comparison of current best methods on the Market-1501 dataset.
4.2 Effectiveness of Algorithm Components
Taking the CUHK03 labeled dataset as an example, we also conducted a detailed study on the effects of various modules in our proposed algorithm, including the standalone basic classification deep network, classification constraints combined with high-level or low-level similarity constraints, and the combination of the above three. Table 5 presents the results.
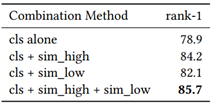
Table 5: Comparison of the performance of different components of the algorithm on the CUHK03 labeled dataset, where cls refers to classification constraints (i.e., softmax loss), sim_high refers to high-level similarity constraints (i.e., Euclidean distance loss), and sim_low refers to low-level similarity constraints (i.e., normalized cross-correlation loss).
5 Conclusion and Future Work
For the future, we plan to seek a suitable optimization target for mid-level layers and explore the effects of utilizing more layer feature maps.
References:
[1] Tong Xiao, Hongsheng Li, Wanli Ouyang, and Xiaogang Wang. 2016. Learning deep feature representations with domain guided dropout for person re-identification. In Proceedings of the IEEE Conference on Computer Vision and Pattern Recognition. 1249–1258.
[2] Arulkumar Subramaniam, Moitreya Chatterjee, and Anurag Mittal. 2016. Deep Neural Networks with Inexact Matching for Person Re-Identification. In Advances in Neural Information Processing Systems. 2667–2675.
[3] Alex Krizhevsky, Ilya Sutskever, and Geoffrey E Hinton. 2012. ImageNet classification with deep convolutional neural networks. In Advances in neural information processing systems. 1097–1105.
Original paper link:
https://dl.acm.org/citation.cfm?id=3123452&dl=ACM&coll=DL#URLTOKEN#

Daily technical articles,
Can’t get enough?
Follow “Alibaba Machine Intelligence” to discover more AI insights.

↑ Looking forward to your follow

You might also like
Click the image below to read

How do programmers self-learn?

After the vaccine incident, Alibaba engineers did something small overnight

What is it like to do a postdoc at Alibaba?

Follow「Alibaba Technology」
Keep up with cutting-edge technology trends