

Hello everyone, welcome to Xiaoyang’s column! In previous posts, we introduced ssGSEA, which stands for single-sample Gene Set Enrichment Analysis, an extension of the GSEA method designed for situations where GSEA cannot be performed on a single sample. Interested friends can check it out in Xiaoyang’s column. Today, I will introduce a method for quantifying tumor cell immune infiltration based on marker genes—MCPcounter.
1
Basic Concepts
MCPcounter (Microenvironment Cell Populations-counter): It generates absolute abundance scores for 8 immune cell types and 2 stromal cell types (including T cells, CD8+ T cells, cytotoxic lymphocytes, NK cells, B lymphocytes, monocytes, myeloid dendritic cells, neutrophils, as well as endothelial cells and fibroblasts) based on the gene expression matrix. The results of MCPcounter are “single-sample” scores, meaning that the generated results are calculated independently for each sample. Since the scores are expressed in arbitrary units, they cannot be directly interpreted as cell fractions and cannot be compared between cell types. During quantitative validation, the estimated scores show a high correlation with the actual cell fractions, demonstrating the value of MCPcounter for inter-sample comparisons. Currently, MCPcounter has been applied to quantify immune and non-immune cells in over 19,000 samples across 32 non-hematological tumors.
2
Source Literature
The MCPcounter package was developed by the Becht team in 2016, and the article was published in Genome Biology, titled Estimating the population abundance of tissue-infiltrating immune and stromal cell populations using gene expression.

3
Journal Information
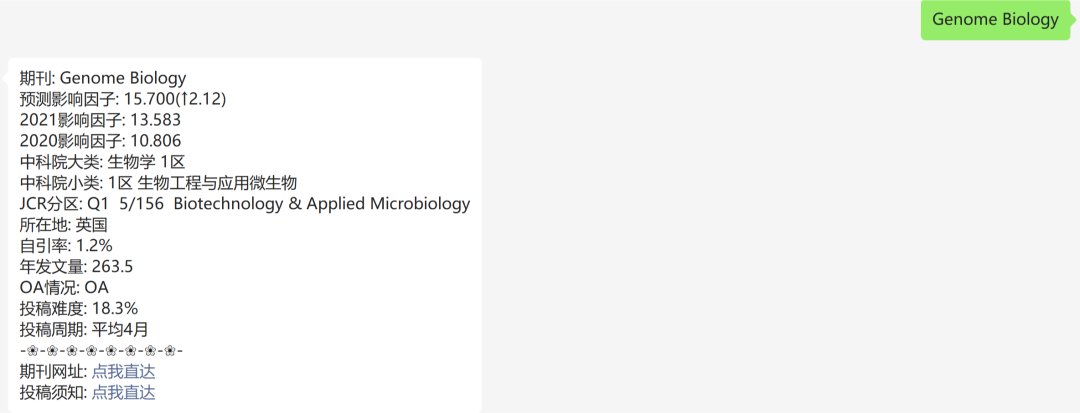
4
Algorithm Principle
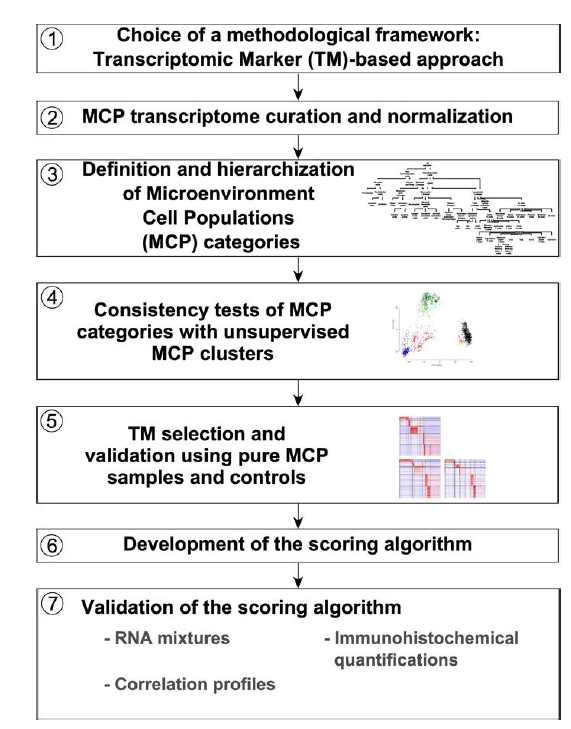
MCPcounter can predict the abundance of 10 cell types from transcriptome data, including 8 immune cells, endothelial cells, and fibroblasts. The algorithm principle of MCPcounter is similar to ssGSEA.
1. Select a type of transcript label (TM), MCP provides both gene names and probe types;
2. Extract and normalize the labels in the expression matrix;
3. Define and grade the cellular microenvironment (MCP);
4. Consistency check of MCP grouping and unsupervised MCP clustering;
5. Screening and validation of MCP samples and control TM labels;
6. Perform MCPcounter scoring;
7. Validate scoring results (RNA mix samples, immunohistochemistry, correlation).
5
MCPcounter Package Download
This package can quantify the absolute abundance of 8 immune cells and 2 stromal cells in heterogeneous tissues using transcriptome data. To load MCPcounter, you need to first download the MCPcounter package from the following address:
https://github.com/ebecht/MCPcounter
6
Data Requirements
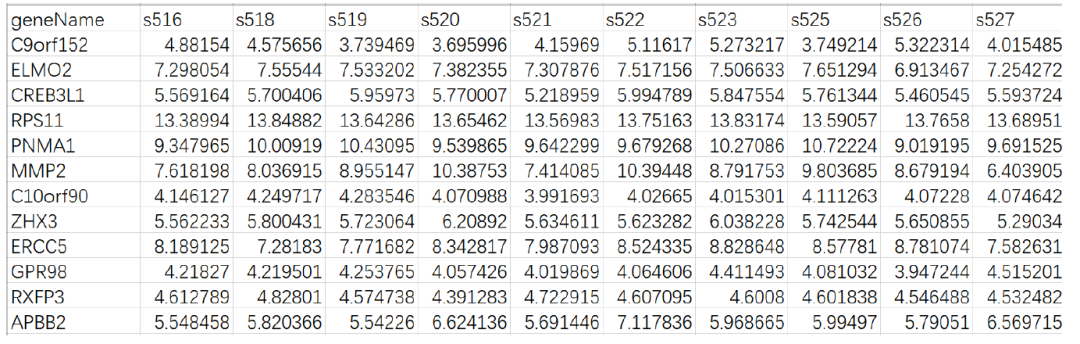
Regular expression matrices, MCPcounter supports three types of gene names: HIGO symbols, Entrez ID, and probe IDs from the affy133P2 platform.
7
Parameter Explanation
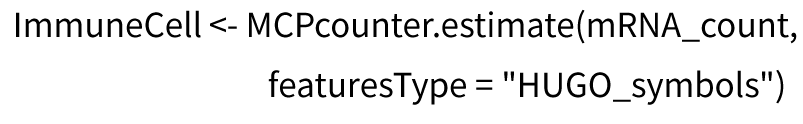
1. MCPcounter.estimate(): Call function
2. mRNA_ count: Expression profile data, that is, the mRNA expression matrix to be calculated
3. featuresType: Type of gene name, Affymetrix Human Genome 133 Plus 2.0 probesets use “affy133P2_probesets”, other data can use “HUGO_symbols” and “ENTREZ_ID”
4. The probesets and genes parameters generally do not need to be set and are not listed here.
8
Result Visualization
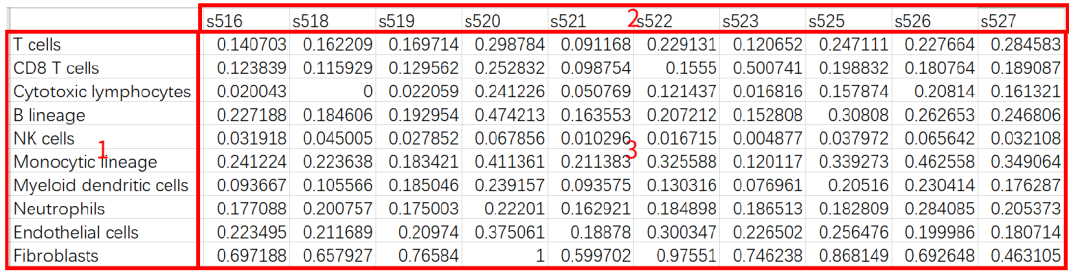
1. Cell type;
2. Sample name;
3. The MCPcounter score of cells in different samples.
Visualization forms:

1. Sample clustering, as shown in the legend, different colors correspond to different samples;
2. Cell type;
3. MCPcounter score.
9
Code
###### MCPcounter Immune Infiltration Annotation# Load R packagelibrary(MCPcounter)# Use read.table function to read input fileinput <- read.table("data/sample_input.txt",header=T, row.names = 1, check.names=F)# Read probe annotation resultsprobesets <- read.table("data/MCPcounter_probesets.txt",sep="\t",stringsAsFactors=FALSE,colClasses="character")# Read gene name annotation resultsgenes <- read.table("data/MCPcounter_genes.txt",sep="\t",stringsAsFactors=FALSE,header=TRUE,colClasses="character",check.names=FALSE)# Perform MCPcounter analysisMCPcounterScore <- MCPcounter.estimate(input, featuresType = "HUGO_symbols",#featuresType varies according to inputprobesets = probesets,genes = genes)# Use normalize function for normalizationMCPcounterScore <- normalize(MCPcounterScore)# Write results to filewrite.table(MCPcounterScore, file = "data/MCPcounterScore.txt",sep="\t", quote=F, col.names=T)# Construct a data frame with annotation informationannotation_col <- data.frame(colnames(MCPcounterScore))colnames(annotation_col) <- "sample"rownames(annotation_col) <- colnames(MCPcounterScore)# Draw heatmappheatmap(MCPcounterScore,show_colnames = F,cluster_rows = F,cluster_cols = T,annotation_col = annotation_col,#annotation_col annotation placed in columns, cluster_cols = T clustering of columns (samples)cellwidth=15,cellheight=15,fontsize=5,filename = 'figures/MCPcounter-heatmap.tiff')10
Literature Examples
Now let’s see how authors utilize MCPcounter in the literature!
This is an article published in November 2020 in Genomics (IF= 5.736) titled A pan-cancer analysis of the oncogenic role of staphylococcal nuclease domain-containing protein 1 (SND1) in human tumors.

11
Applications of MCPcounter
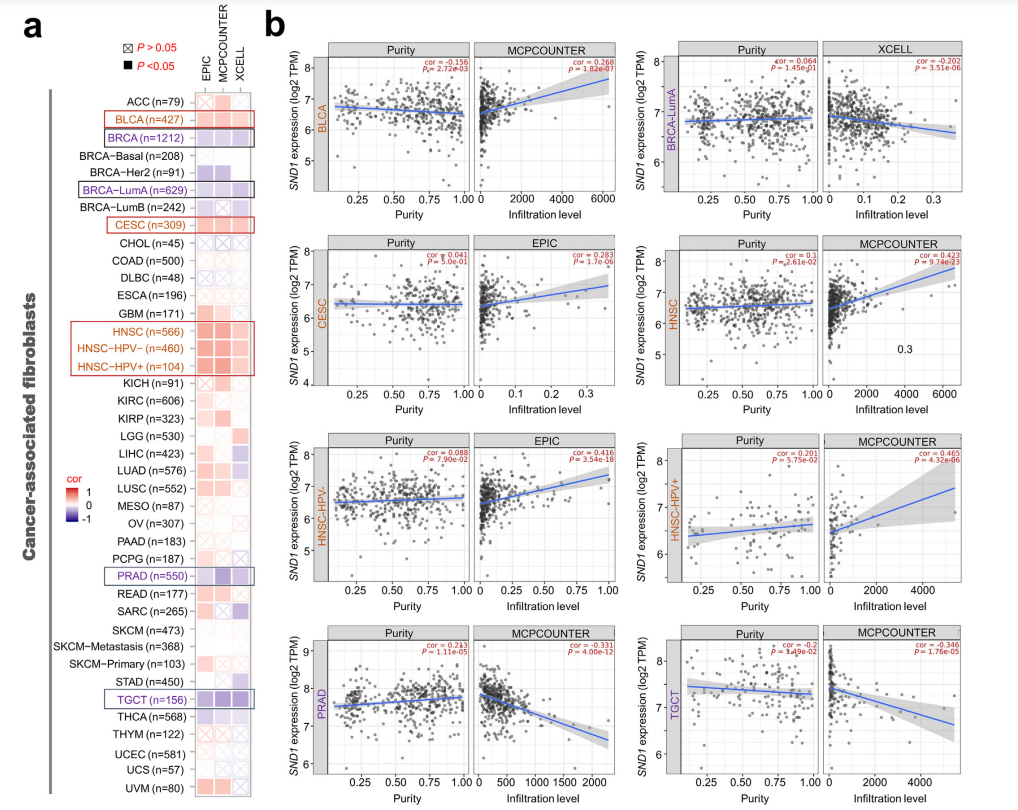
As shown in the figure, the article lists the MCPcounter infiltration status of BLCA tumors, HNSC tumors, PRAD tumors, and TGCT tumors. The authors used MCPcounter to explore the potential correlation between the expression level of the SND1 gene and the infiltration level of fibroblasts associated with all types of cancer in TCGA.
12
Summary
-
MCPcounter is an R package that can quantify the absolute abundance of 8 immune cells and 2 stromal cells (including T cells, CD8+ T cells, cytotoxic lymphocytes, NK cells, B lymphocytes, monocytes, myeloid dendritic cells, neutrophils, as well as endothelial cells and fibroblasts) using transcriptome data.
-
It is important to note that transcriptome data must be normalized.
-
The results of MCPcounter are “single-sample” scores, meaning that the results are calculated independently for each sample.
That’s all for this issue regarding MCPcounter. I hope this helps in your research work. If you want to further master the related content of MCPcounter, you can also log in to the Helix Life official website (https://www.helixlife.cn/) for in-depth learning and exploration!

Welcome everyone to follow the Helix Life bioinformatics channel – Challenge Circle Linked WeChat account~