Academic Research
Analyzing Urbanization Strategy Mechanisms of Crowd Behavior: A Case Study in Suzhou
Exploring Urbanization Strategies by Dissecting Aggregate Crowd Behaviors: A Case Study in China
Abstract
Town development is an important stage of urbanization, and it has received increasing attention in sustainable economic growth strategies. Vitality, especially the vitality that measures crowd aggregation behavior, is regarded as a key development factor. Therefore, a comprehensive assessment of the driving factors of town vitality, particularly crowd vitality, is crucial for addressing challenges and monitoring progress. This study focuses on representative towns in China, using various datasets and XGBoost-SHAP to explore the impact mechanism of development environment factors on overall crowd vitality. The main findings of this study highlight the novelty and broader significance of the research: (1) The degree of industrial agglomeration is the most important factor affecting the dependent variable, providing new data-driven insights into the role of economic agglomeration in town development. (2) Other indicators, such as the minimum distance to the town center and friendliness to motor/non-motor vehicles, can also effectively predict town vitality, providing practical references for town planning. (3) Industrial innovation and diversification, reasonable planning of living circles, and improvement of town conditions are three key strategies to promote urbanization. This study enhances empirical insights by proposing strategies to address urbanization challenges, emphasizing how to use crowd data to guide urbanization policy and planning practices, and assisting urban planners in building more sustainable systems.
Keywords
Town development environment; XGBoost-SHAP; Nonlinear effects; Crowd vitality; Spatial dynamics
Introduction
The integrated development of urban and rural areas is a key driving force for sustainable economic growth and the urbanization process. As China’s urbanization rate exceeds 60% and urbanization strategies continue to advance, the rapid urbanization process has driven the transformation of the urban-rural dual structure. As a key node connecting cities and villages, towns face unique opportunities and challenges. From the perspective of more efficient resource utilization and environmental management, town vitality is seen as a fundamental catalyst for promoting town development, playing a key role in addressing urbanization challenges. Furthermore, with the application of big data and artificial intelligence technologies, the quantitative assessment and prediction models of town vitality have become important frontiers and hot topics in academic research, providing technical support for more scientific policy formulation. In this context, research on the town development system and vitality is not only of theoretical significance but also holds important practical value for promoting coordinated urban-rural development in China and achieving global sustainable development goals.
A comprehensive assessment of town vitality helps to analyze the characteristics and problems of its urbanization and monitor its development process. The assessment of town vitality should cover multiple aspects such as transportation, industry, spatial and economic factors, in order to formulate targeted and comprehensive development strategies. Currently, there are still some key and unresolved issues regarding the assessment of town vitality. First, existing research on town vitality and urbanization mostly focuses on the macro level of counties and cities, while discussions at the micro level of villages and towns are relatively scarce. Second, there is a lack of analysis on the relative importance of various indicators in the quantitative research on the development environment of towns. Third, many quantitative studies assessing town vitality often rely on traditional regression models and spatio-temporal comparative analysis methods, neglecting the interactions between different factors. Therefore, this study conducts an in-depth examination of data from two towns in Suzhou, Jiangsu province, to assess their levels of town vitality and urbanization process. The research builds a new scientific assessment framework using multi-source data and the latest advancements in machine learning, such as extreme gradient boosting (XGBoost). This paper measures three dimensions of rural development at the town scale (i.e., transportation, industry, and space) and analyzes two vitality indicators derived from location-based service (LBS) data and nighttime lighting (NTL) data, providing new scientific basis for enhancing town vitality and promoting urbanization processes.
Materials and Methodology
Analytical Framework of Current Research
To explore the impact of the development environment characteristics on town vitality, this study uses daytime crowd density based on location-based services (LBS) and NTL intensity as substitute indicators. In addition, since transportation, economy, and geographical location are the main determinants affecting the degree of population hollowing in towns, based on literature theory, this paper selects 15 important characteristics of the town development environment as independent variables. These indicators representing the town development environment are divided into three dimensions: transportation, industry, and space. First, we conduct descriptive analysis on the urbanization status data by observing the patterns of raw data. Subsequently, we use the extreme gradient boosting (XGBoost) model to explain the nonlinear relationships between multiple development environment variables and vitality variables in more detail. We introduce the Shapley additive explanations (SHAP) method to clarify the detailed mechanisms of different variables, thus more accurately assessing the contributions of development environment indicators to town vitality. Finally, based on the relative importance and nonlinear effects of each factor, this study proposes effective regional spatial planning and strategies to promote urbanization and prosperous development.
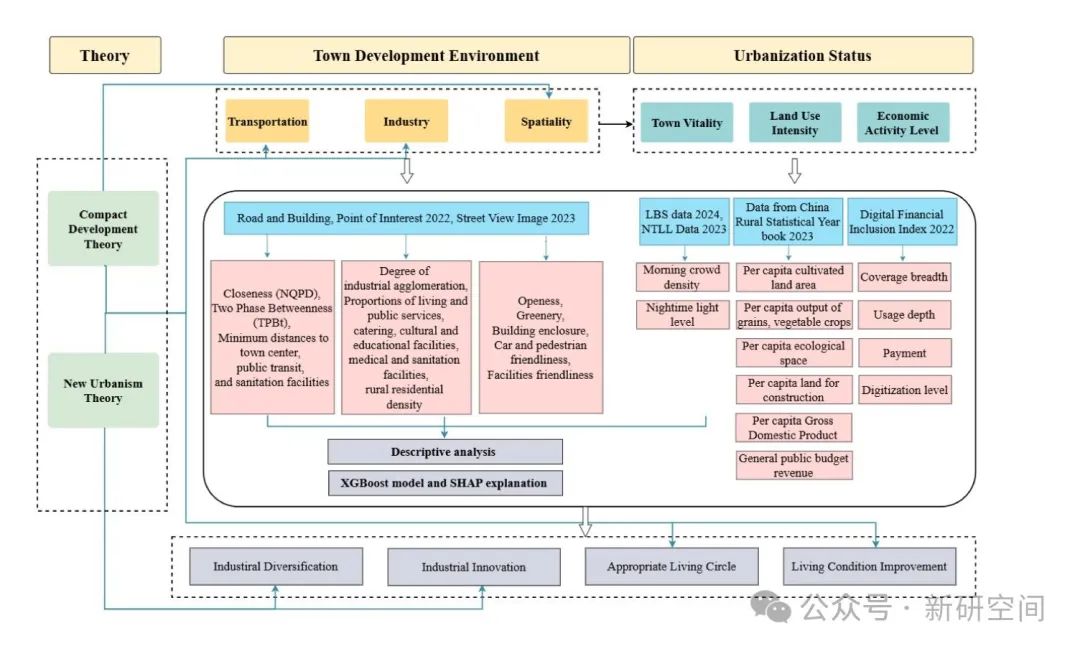
Figure 1. Research analytical framework.
Study Area and Its Representativeness
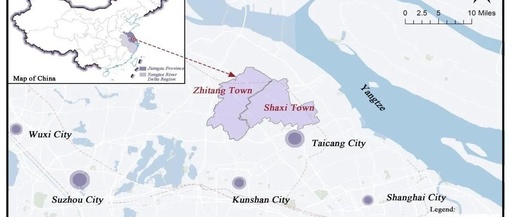
The urbanization process and high economic level of Suzhou make it a typical case for studying vitality and urbanization. This study selects Shitang Town and Shaxi Town in Suzhou as research subjects (Figures 2 and 3). Both towns belong to the economically developed Yangtze River Delta region and can represent the urbanization and vitality characteristics of towns in the region to some extent. Their varying degrees of industrial agglomeration, urban infrastructure, and socio-economic characteristics are considered representative and unique empirical cases in town development, enhancing the generalizability of research conclusions in similar urbanized towns.
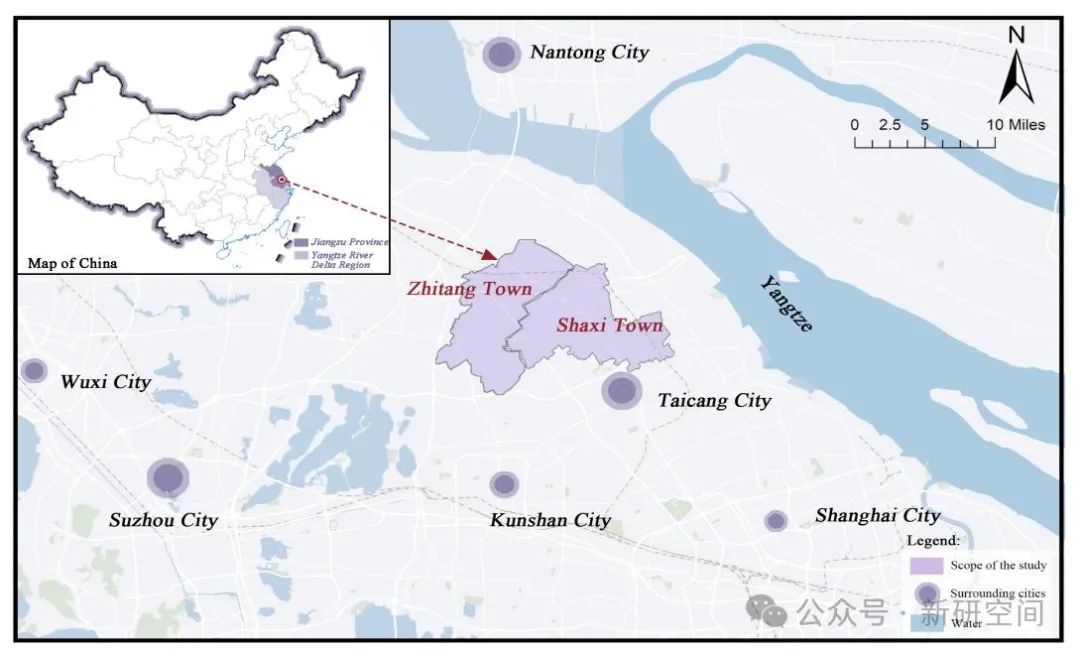
Figure 2. Locations of the study areas.
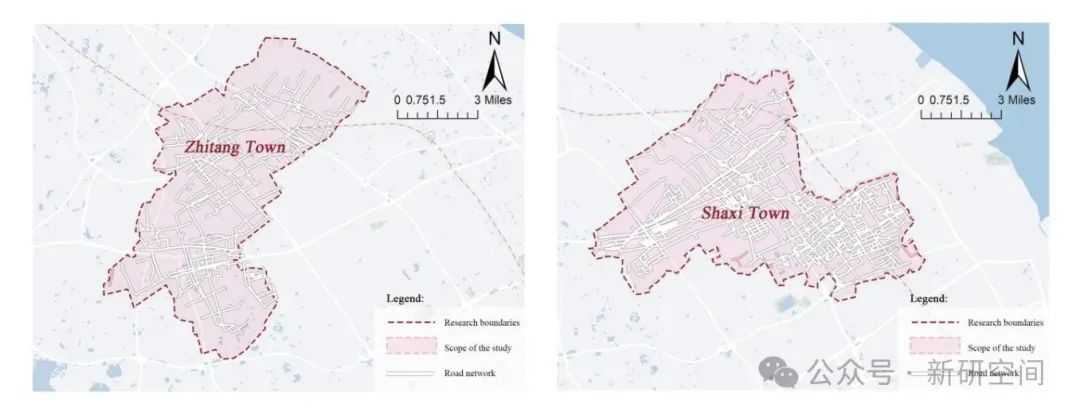
Figure 3. Texture maps of the Shaxi Town and Zhitang Town.
Indicator Construction and Data Collection
To construct a quantitative assessment system for town vitality, this study starts from a more micro perspective by first dividing the two studied towns into 549 main street segment units. Among them, Shaxi Town is divided into 366 units numbered from 1 to 366; Zhitang Town is divided into 183 street segment units numbered from 368 to 549, with each street segment length ranging from 200 meters to 500 meters. Subsequently, statistical analysis is conducted based on the data of all street segments.
Dependent Variables
This study selects the current dependent variable indicators as LBS daytime crowd distribution density and nighttime lighting data. MCD features directly reflect spatial vitality, while NTLL carries basic information on population activities, traffic flow, and logistics operations, with a broader coverage and more comprehensive information reflecting economic activity levels. Various types of LBS data have been used to showcase the vitality of social crowds, particularly at the micro level of street spaces. Vibrant streets are characterized by high participation in fixed or ongoing activities. Baidu heat maps utilize LBS platform mobile user geographic location data to depict real-time changes in urban crowd density through different color gradients.
Independent Variables
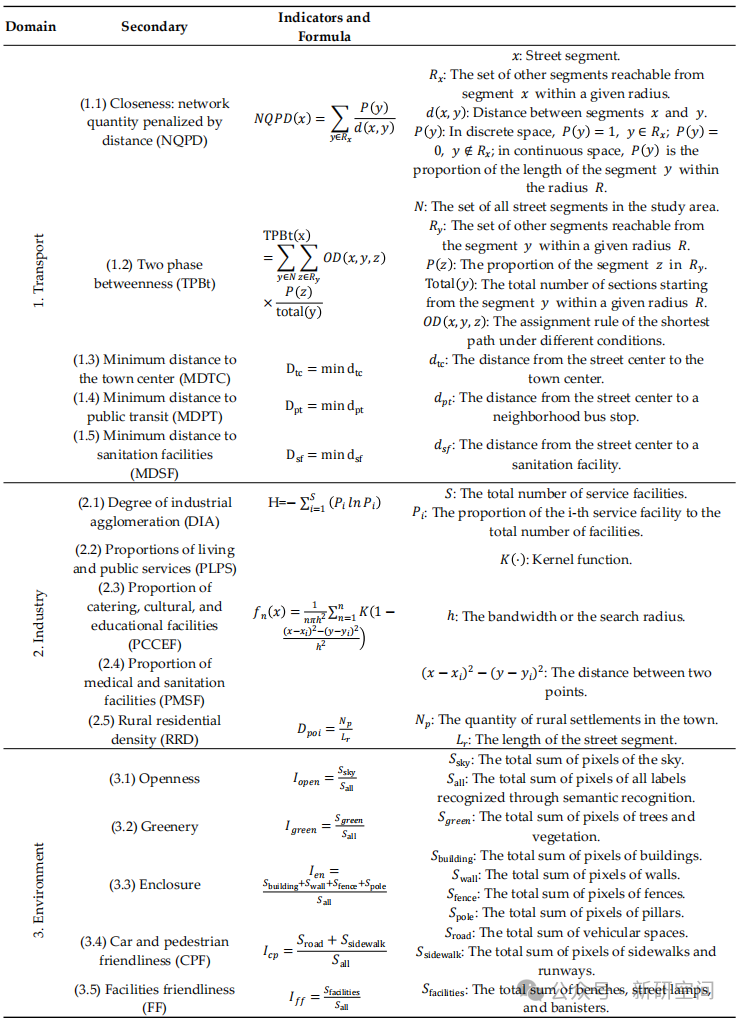
This study interprets and evaluates the development environment of the surveyed towns from three dimensions: transportation, industry, and space, through the examination of manually selected and field-surveyed street segments. A total of 15 independent variables are included in this study. (Table 1)
Table 1. Independent variables and data sources.
Statistical Methods
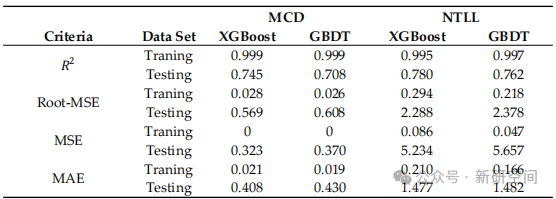
Compared to other machine learning models, XGBoost and GBDT perform better, especially in tasks that require efficient handling of nonlinear feature relationships, avoiding overfitting, and ensuring model interpretability. These features make it the preferred model for data prediction. In this study, we import the dataset into XGBoost and GBDT models to generate training and testing sets. Based on the performance results of the model fitting regression on the testing set (Table 2), we select the XGBoost model, which has a higher accuracy, to describe the specific impacts of control variables on the two types of dependent variables. The GBDT model serves as a robust baseline validation model and is trained using our dataset. The R-squared results of the two models are similar, which is a key indicator for assessing the goodness of fit of regression models. Through cross-validation calculations, the optimal parameter combinations can be determined. The closer the value is to 1, the stronger the model’s explanatory power over the data. Auxiliary parameters such as mean squared error (MSE) and mean absolute error (MAE) also play a crucial role in determining the reliability of the model. Therefore, the performance of the XGBoost model in this study is considered reliable. Finally, we use SHAP (Shapley additive explanations) to explain the complex relationships between development environment variables and town vitality variables.
Table 2. Model comparison for MCD and NTLL.
Results and Discussions
Descriptive Statistics
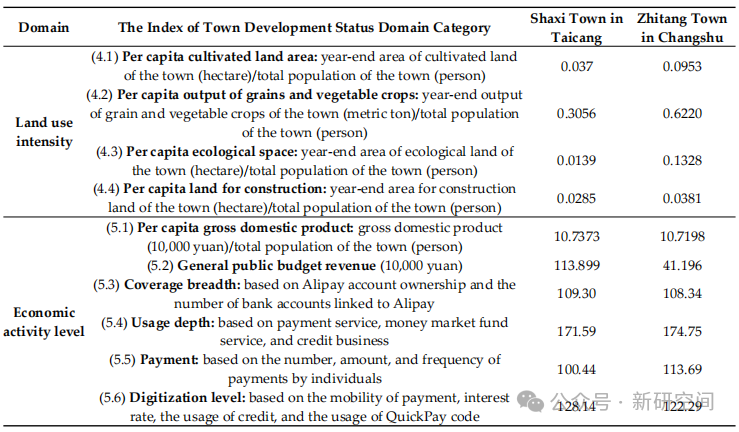
Table 3 provides the descriptive statistics for two outcome indicators measuring town vitality and 15 independent indicators representing the development environment. More importantly, to comprehensively understand the current situations of urbanization in Shaxi Town of Taicang and Zhitang Town of Changshu, it is crucial to consider not only vitality within the towns, i.e., the factors of MCD and NTLL as the dependent variables, but also the intensity of land use and economic activity level. Therefore, this paper calculates and analyzes various indicators for both towns as shown in Table 4.
Table 3. Descriptive statistics of variables.
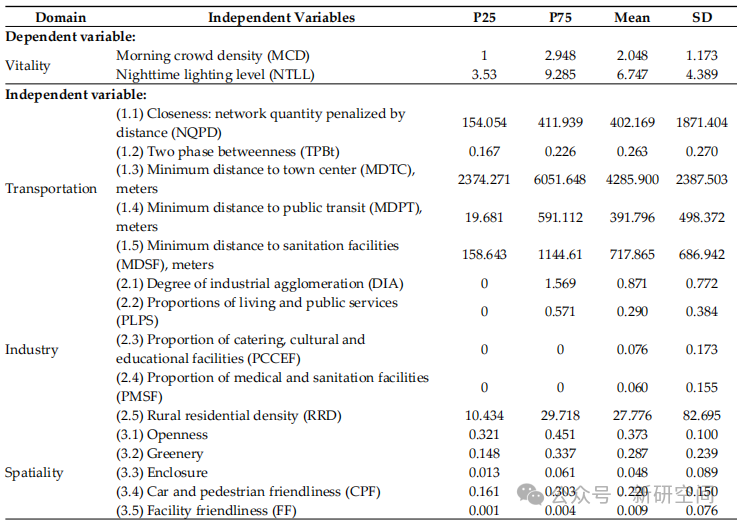
Table 4. Calculation and description of town development status indexes.
Feature Importance and Nonlinear Effect Based on SHAP
The results obtained from the XGBoost model, after parameter optimization, are used to specifically explain the differential effects of 15 independent variables on the two types of dependent variables through SHAP. Global and local feature importance plots based on SHAP (Figure 4) reveal how various features have positive and negative effects on target dependent variables. Each colored scatter in the figure represents a sample street segment, with the color indicating the value of each independent variable and the horizontal axis representing the SHAP values corresponding to the independent variables (i.e., how much difference in the dependent variable can be explained by each independent variable). Additionally, the distribution of SHAP values for individual explanatory variables and selected SHAP dependency plots for some key variables (relative importance >5%) are visualized in Figures 5 and 6. The horizontal axis represents the value of the independent variable, while the vertical axis represents the corresponding SHAP value. Based on the global features, SHAP explanations for key development environment variables and the nonlinear relationships between two types of dependent variables (MCD and NTLL) and independent variables, the following findings are presented.
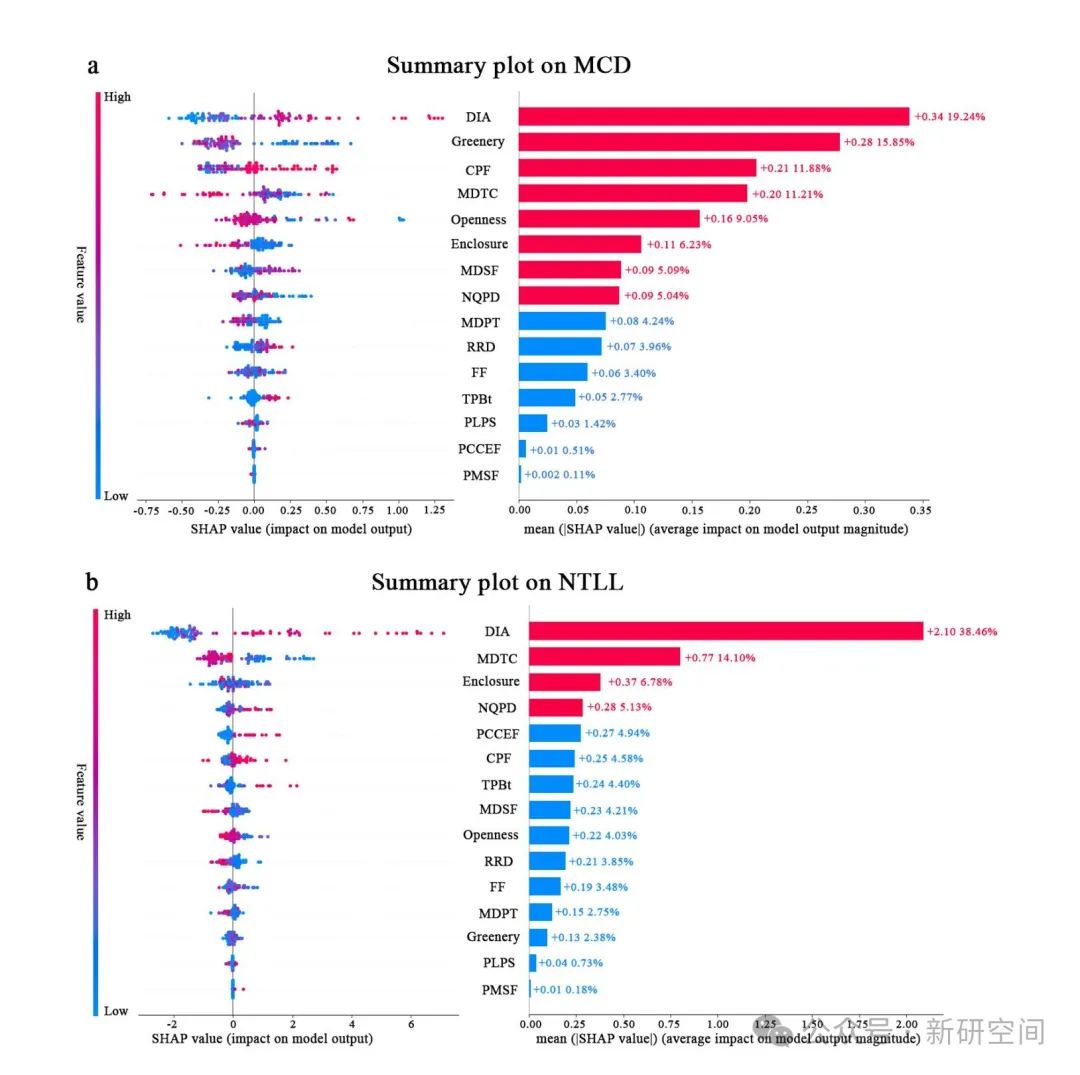
Figure 4. Local (left) and global (right) feature importance plots by SHAP.
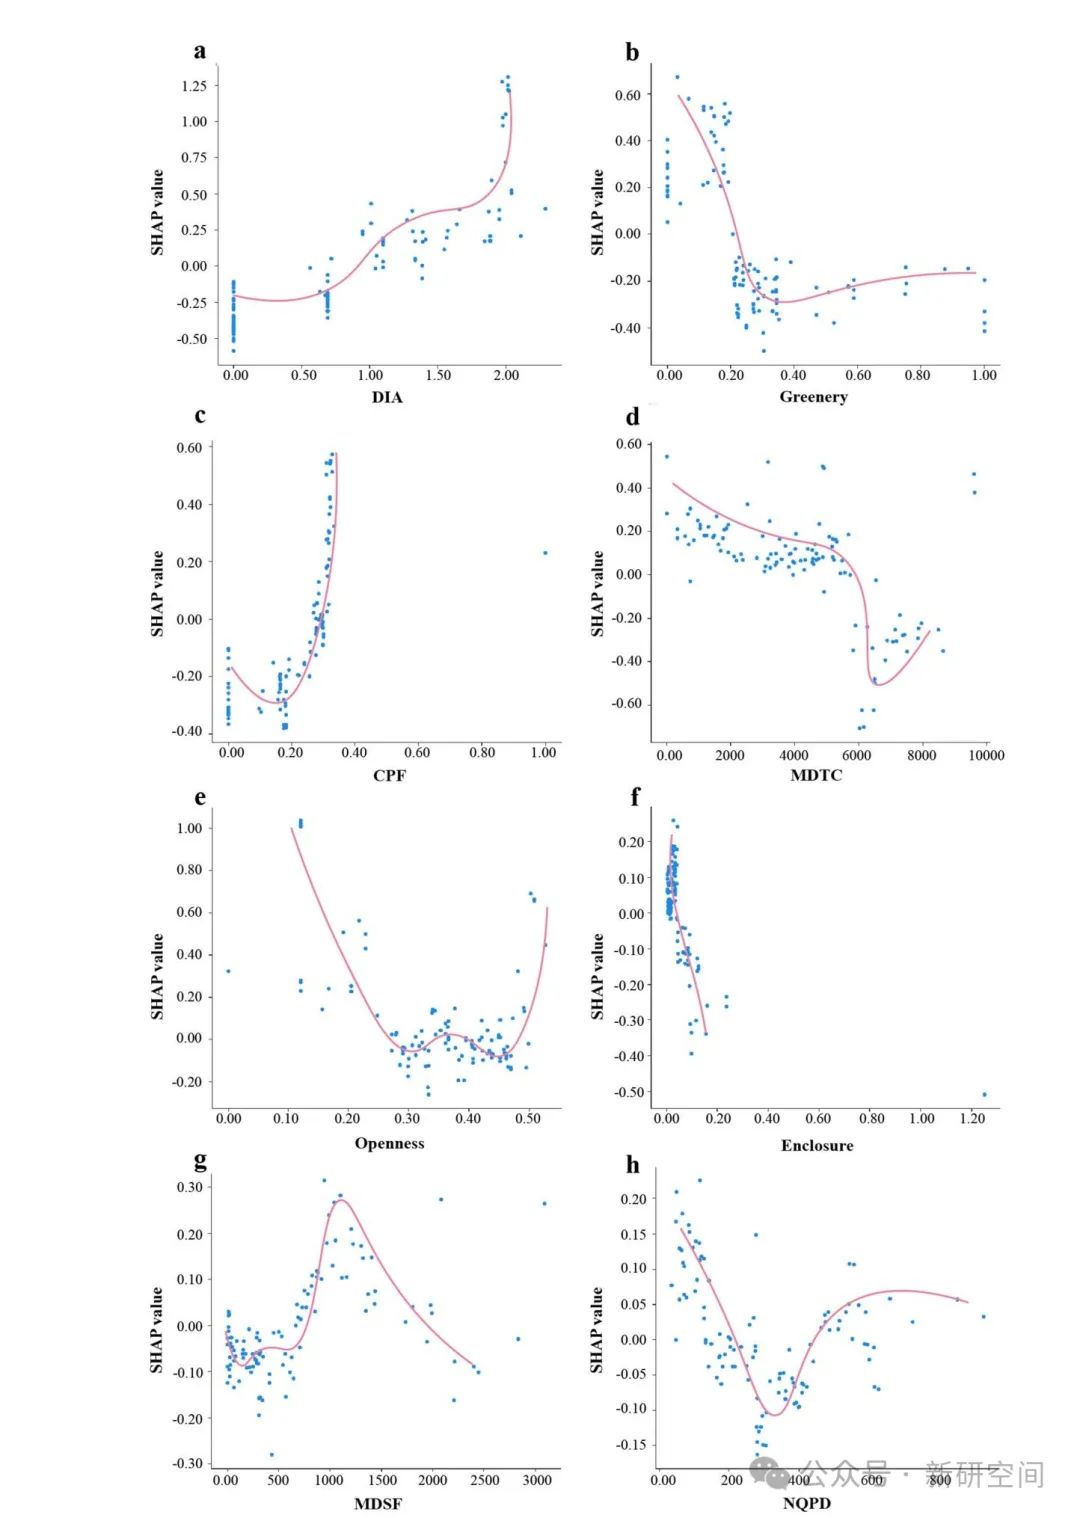
Figure 5. The nonlinear effects of key secondary variables on MCD.
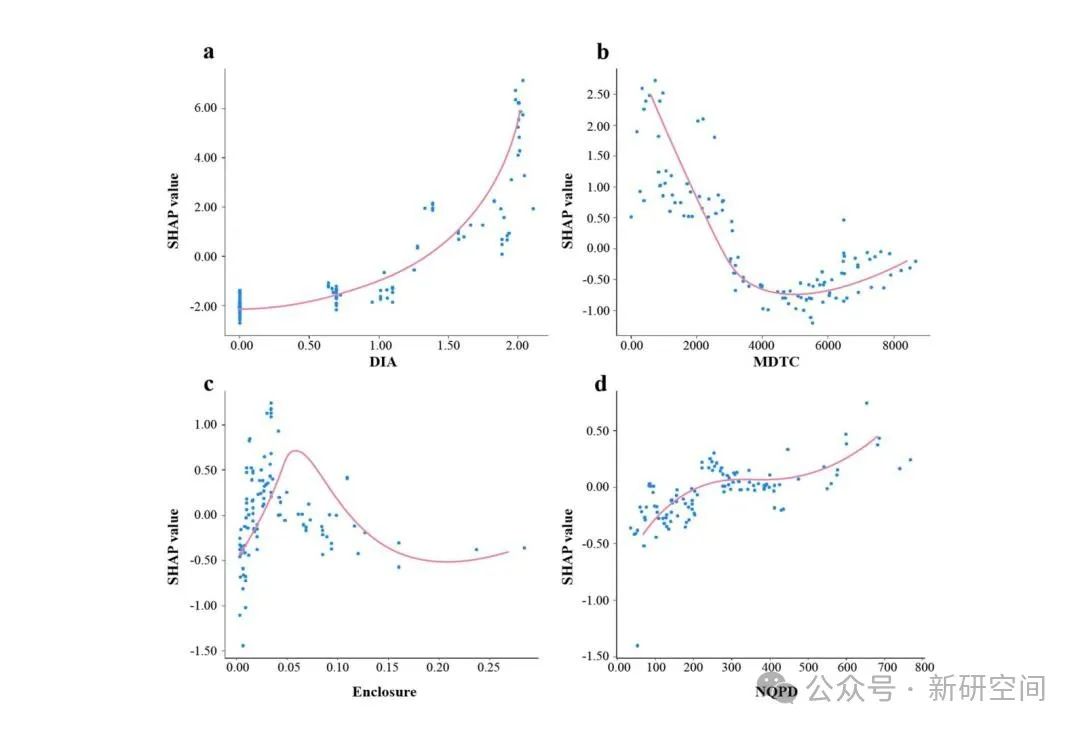
Figure 6. The nonlinear effects of key secondary variables on NTLL.
Interaction Effects of Independent Variables
After explaining the global features and nonlinear effects of single factors, this study further employed SHAP dependence plots to visually depict how the contribution of one variable depends on another variable, gaining deeper insights into the interaction effects between features. Based on the relative importance of global features, we selected key development environment variables for MCD and NTLL to analyze their interaction effects through SHAP dependence plots (Figures 7).
Next, regarding the interaction effects of influencing features on NTLL (Figure 8), we observe a negative impact on NTLL when the DIA falls within the range of 0 to 1.25 and when the enclosure is less than 0.04. However, as the DIA goes beyond 1.25 and the enclosure surpasses 0.06, this effect shifts from negative to positive. This outcome can be attributed to street segments with high industrial agglomeration and a relatively high enclosure, typically with more buildings and facilities, along with longer working hours, which helps maintain a high level of nighttime light usage.
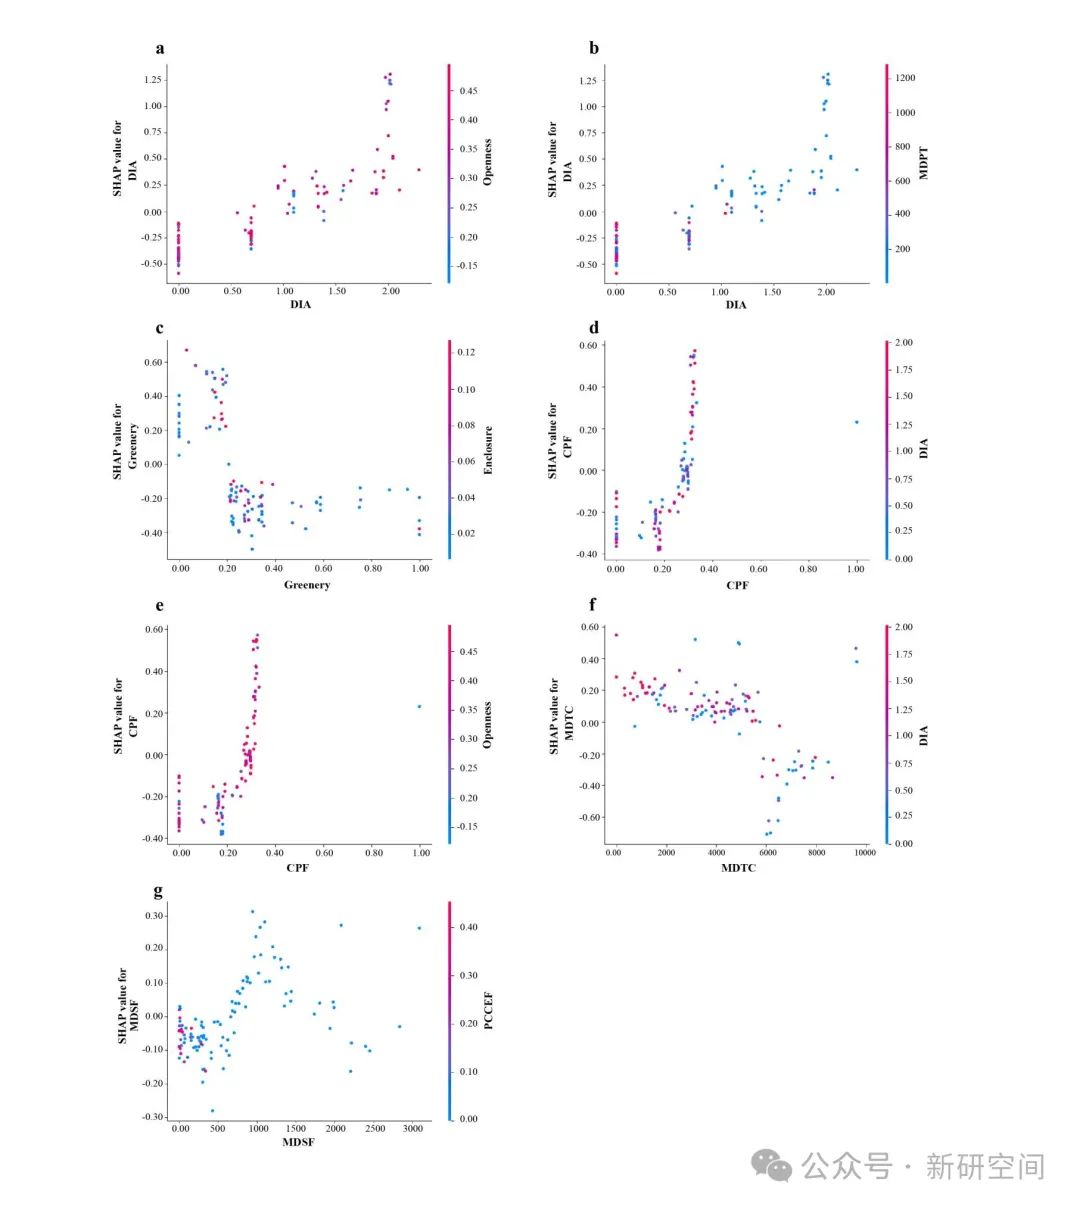
Figure 7. SHAP dependency plots for MCD.
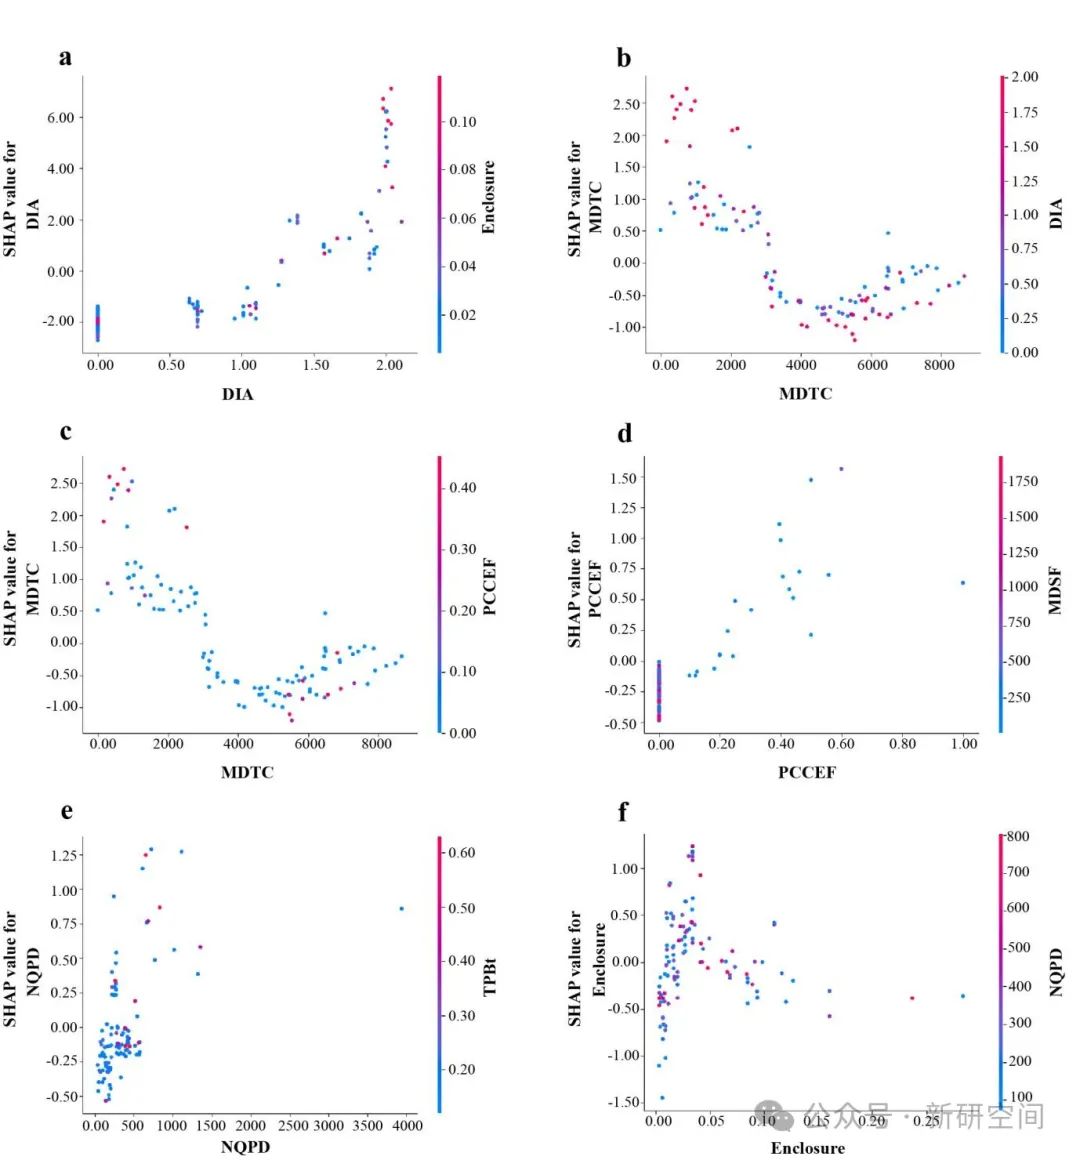
Figure 8. SHAP dependency plots for NTLL.
Policy Implications
Based on the predictive contributions of development environment factors to town vitality, as well as statistical data on land use and economic activity levels under the context of urbanization, this section proposes comprehensive town planning strategies tailored to local conditions, highlighting the development characteristics of central towns in the Yangtze River Delta economic zone. The development environment indicators of towns can effectively assess the vitality levels of towns in the Yangtze River Delta economic zone. By identifying the unique characteristics of different town developments and revealing regional patterns, this method can be flexibly applied to assess and compare the vitality of different types of town regions, providing empirical data support for the formulation and effective implementation of urbanization strategies.
Taking Shaxi Town as an example, an overview of the current distribution of enterprises in the town indicates that a large number of enterprises exhibit strong agglomeration effects (Figure 9). However, the overall output value is relatively low, failing to provide sufficient support for the development of Shaxi Town. In light of this, the following industrial strategies are proposed for Shaxi Town. First, Shaxi Town should adopt an urban-rural integration development model, leveraging the complementary advantages of regional resources to promote the bidirectional flow of urban and rural spatial elements. Additionally, the “production, processing, storage, transportation, and sales” processes of specialty agricultural products help to naturally extend the primary industry into the secondary and tertiary industries, thereby promoting industrial diversification and increasing the degree of industrial agglomeration. Secondly, this study proposes an innovative industrial unit structure that showcases the networked relationship between “core industries, supporting industries, and public services” (Figure 10). This primarily includes functions such as enterprise incubation, exhibitions, and commercial support services. These units can be freely combined, transforming the original balanced (dispersed) layout pattern into a functionally mixed intensive land use model, highlighting the core and presenting structurally reasonable and appropriately dense characteristics. Integrating dispersed industrial units helps to increase regional population density, enhance nighttime lighting vitality, and further promote urbanization and town development.
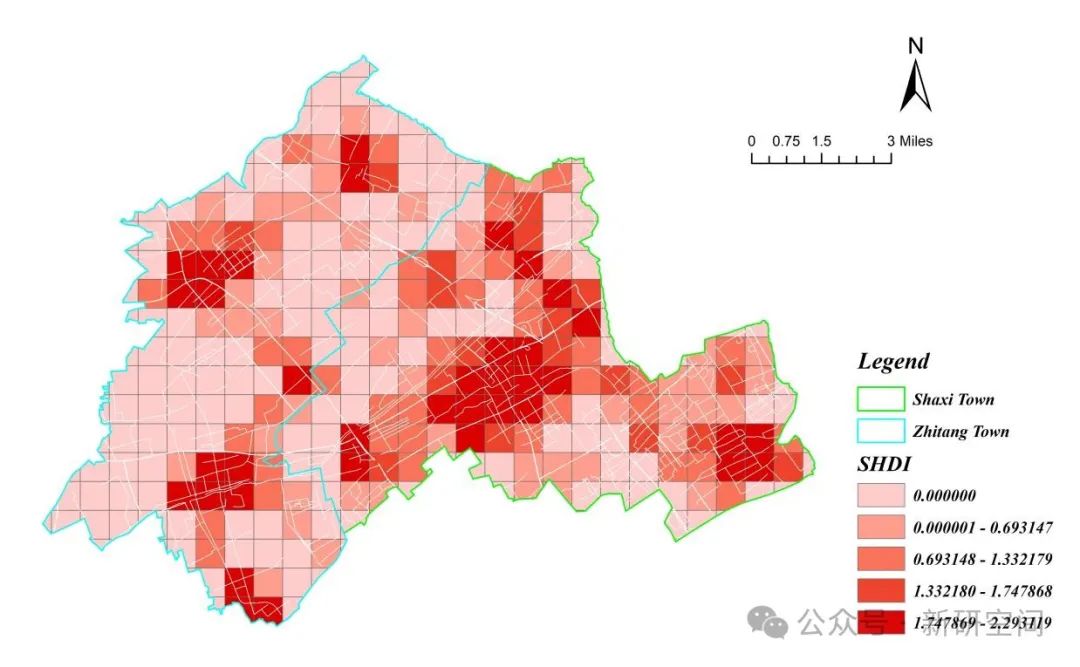
Figure 9. The degree of industrial agglomeration in the study area.
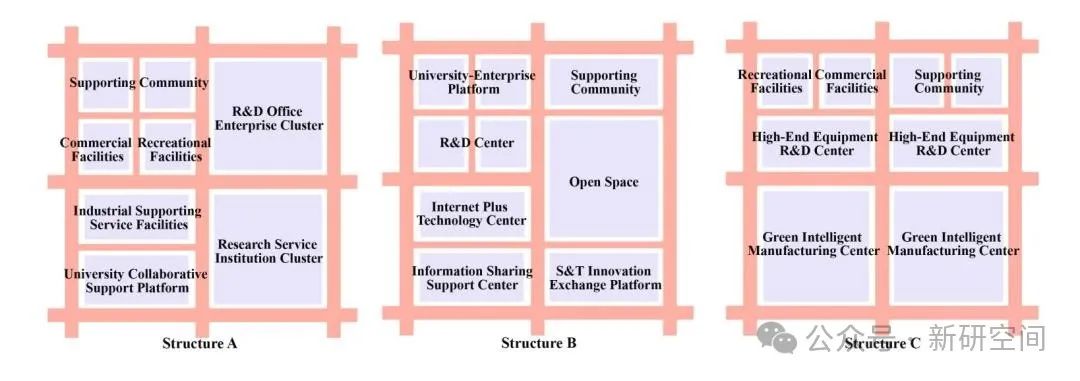
Figure 10. Diagram illustrating three types of innovative industry unit structures.
Our analysis of Shaxi Town and Zhitang Town indicates that urbanization requires not only a diversified industrial layout but also the construction of convenient living circles, improved infrastructure, and enhanced living environments. Proximity to the town center helps to improve the morning crowd density (MCD) and nighttime lighting level (NTLL) of the town area. Therefore, in comprehensive transportation planning, it is necessary to align with the development strategies of neighboring cities to create a more convenient integrated transportation system. Considering the impact of the shortest distance to public transportation (MDPT), a pedestrian-friendly system should be constructed, optimizing rapid bus and regular bus services. Guiding the diversion of pedestrians and vehicles will ensure the safety of residents and visitors while providing them with high-quality public transportation services. Additionally, optimizing residential layout planning is crucial for constructing a three-tier living circle composed of central town areas, towns, and rural community (Table 5). This initiative aims to meet the growing aspirations for a better life and provide corresponding infrastructure within rural community living circles (Figure 11).
Table 5. The three-tier living circle: “Central Town Area–Town–Rural community”.
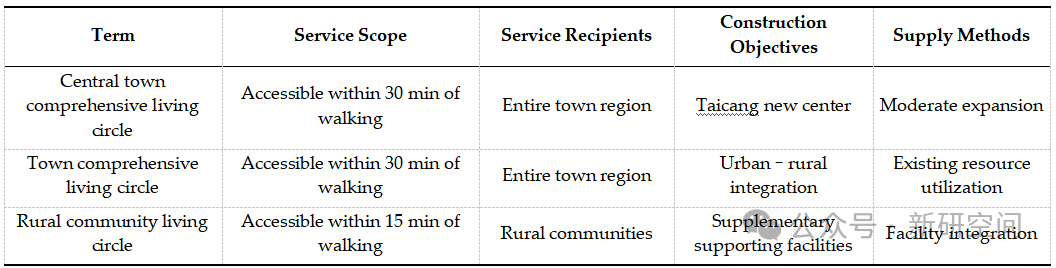
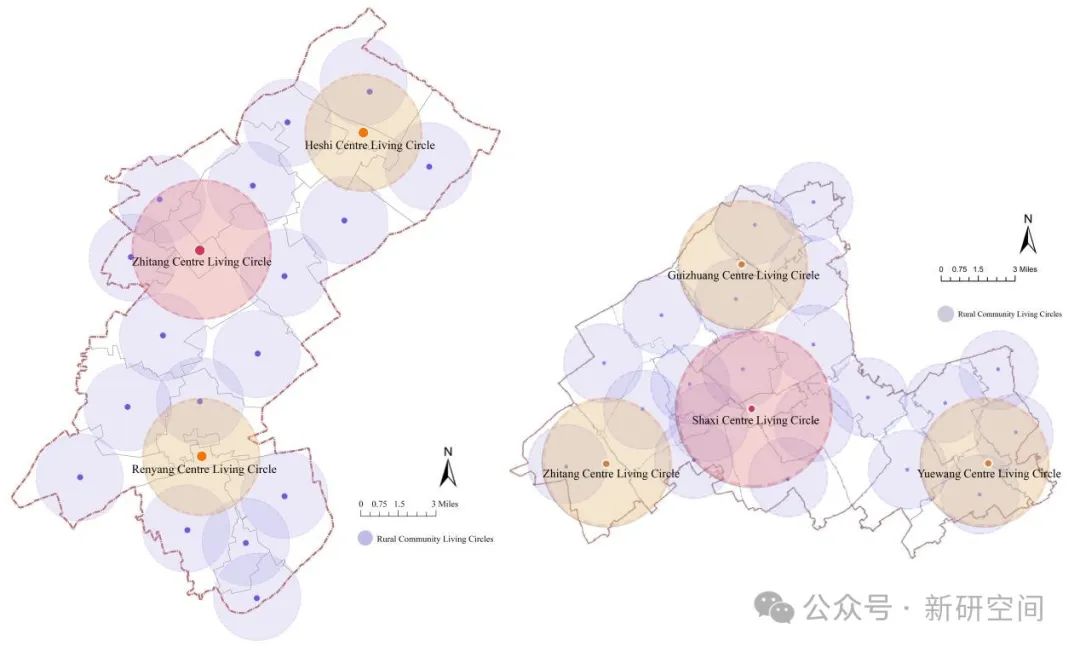
Figure 11. Planning maps for living circles.
Improving living conditions will affect variables such as motor/non-motor vehicle friendliness (CPF), greening level, and enclosure degree, which will, to some extent, help improve the daytime crowd density (MCD) and nighttime lighting level (NTLL) of the town. As shown in Figure 12, Shaxi and Zhitang should address issues such as mixed traffic and unclear road boundaries, effectively managing conflict areas between motor and non-motor vehicles to improve traffic operation efficiency. The greening level and openness are negatively correlated with MCD within a certain range, and towns can incorporate unique local landscape features at major road entrances while adjusting the enclosure degree to create appropriately sized comfortable courtyard spaces. Furthermore, efforts should focus on integrating and restoring fragmented water town textures, improving local residents’ public infrastructure, and promoting the construction of uniquely styled towns.
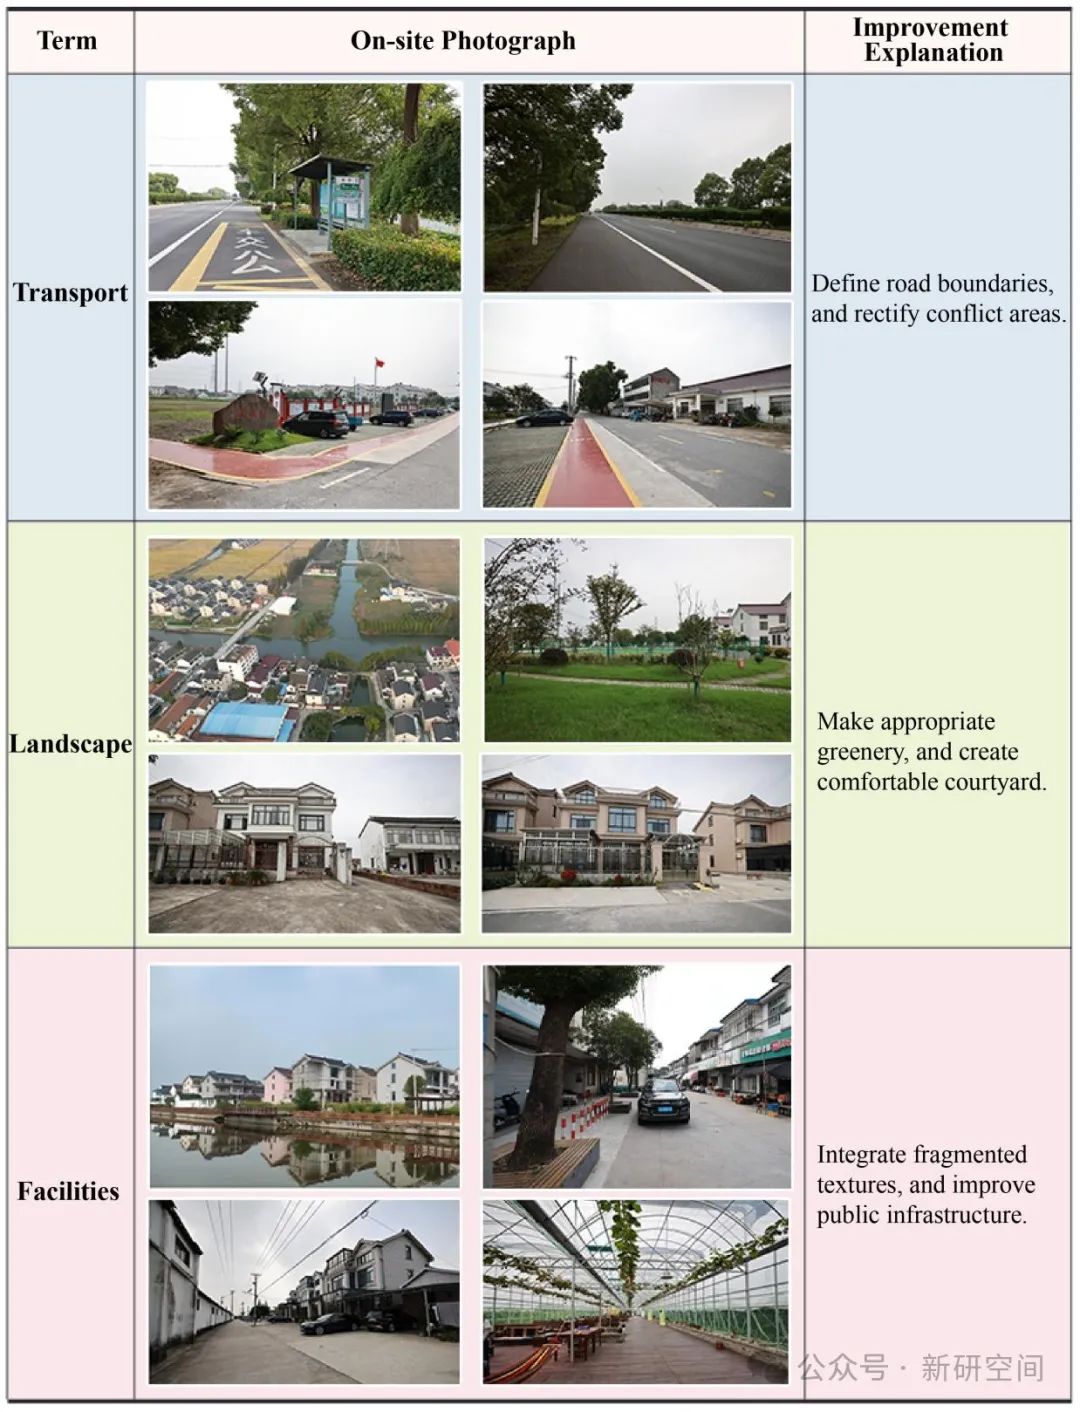
Figure 12. The improvement of living conditions in the town.
Conclusions
This study conducted a comparative analysis of the accuracy of the XGBoost and GBDT models in training and testing based on existing datasets. The results indicate that XGBoost performs better in predicting daytime crowd density (MCD) and nighttime lighting level (NTLL). Subsequently, we used the XGBoost model to study the impact of development environment factors on morning crowd density (MCD) and nighttime lighting level (NTLL). The study revealed complex nonlinear relationships between certain variables in the industrial, transportation, and spatial dimensions with MCD and NTLL, finding that the degree of industrial agglomeration (DIA), MDTC, and motor/non-motor vehicle friendliness (CPF) have significant impacts on both dependent variables. Finally, based on the relative importance and nonlinear assessment results of development environment and town vitality, this paper proposes three strategies for town spatial planning, focusing on industrial integration, moderate living circle planning, and improving the town landscape, to promote the urbanization process of the research base. Our research framework can be applied to other areas of urban-rural development, such as human-centered subjective perception data, ecological landscape data, and public transportation data, providing practical data-driven support for policymakers to clearly understand the current situation and make informed decisions. The visualized results can intuitively showcase research findings, test their applicability, and make it easier for local residents to understand and accept.
Furthermore, this study provides three important insights. First, this study utilizes SHAP explanations to present regression prediction results based on the XGBoost model, enhancing the interpretability of research findings and revealing the widespread existence of nonlinear and threshold effects. When feature variables exceed certain thresholds, negative impacts can be transformed into positive impacts. This underscores the necessity for urban planners to effectively allocate spatial resources by precisely identifying the efficient ranges of various indicators under limited conditions. Secondly, this study uses LBS data and nighttime lighting data as dependent variables, proposing development environment indicators that better reflect the characteristics of rural towns based on the differences between towns and cities, to explore urban-rural heterogeneity. Specifically, the contribution of development environment variables in the industrial dimension to daytime crowd density (MCD) and nighttime lighting level (NTLL) is more significant. Thirdly, this study proposes customized urbanization strategies for representative towns in the Yangtze River Delta economic zone. Traditional research on town development often derives general conclusions through empirical analysis, lacking sufficient data support to guide design practices. By combining data results derived from machine learning with the actual situation of other urbanization indicators in towns, this study proposes planning strategies and spatial renewal suggestions that are more in line with the specific conditions of the research area, greatly enhancing the applicability of the conclusions. As technology continues to advance, this paper looks forward to applying these research methods and analyses to a broader range of rural areas to obtain more meaningful insights and more targeted strategies.
END
References
Title: Exploring Urbanization Strategies by Dissecting Aggregate Crowd Behaviors: A Case Study in China
Authors: Yanbin Li, Xingyao Song, Leilei Sun*, Castiel Chen Zhuang, Jiayi Liu, Meng Yang
Source: “Systems” 2024
Date: 2024-11
DOI:10.3390/systems12110459