

The original text was published in the “Emotions and Communication” column of the Global Communication Journal, 2022, Issue 4.
Authors
Xu Xiang: Professor at the School of Arts and Communication, Tongji University.
Dong Jieyun: Undergraduate student at the School of Arts and Communication, Tongji University.
Abstract
[Abstract] This paper takes Sina Weibo users (N=2143) as a sample, employing the BERT model for sentiment analysis to examine how users’ emotional biases manifest as the depth of their information bubbles increases, and the characteristics of emotional convergence based on these biases. The study finds that the higher the degree of users’ information bubbles, the stronger the common emotional biases among different bubbles; among 32 emotions, the proportions of surprise, helplessness, reassurance, nostalgia, envy, pleasure, excitement, guilt, and pride can predict the degree of users’ information bubbles, with an adjusted R2 of 0.489. Based on emotional biases, as users’ information bubble depth increases, their emotions become increasingly similar to those of the “top” users within the bubble.
[Keywords]Social network users; Information bubbles; Emotional bias; Emotional convergence
1. Introduction
“Information bubbles” have become a research hotspot in recent years, with scholars expressing concerns about the bubble effect from a speculative perspective, while many others have explored the characteristics of social platform users trapped in these bubbles from an empirical standpoint. In a social platform that emphasizes relatively free expression and grants individuals the right to express, what emotional biases do users in information bubbles exhibit? Are the emotional characteristics of these users trapped in information bubbles random occurrences, or do they represent a systematic result influenced by social networks or other factors? This is not only an empirical question awaiting analysis but also a further exploration of the rules governing the generation and dissemination of emotions among social network users.
This paper discusses the emotional characteristics exhibited by users as the depth of their information bubbles increases in social network content production, conducting empirical research and consequence analysis based on theoretical analysis. The core issues are the following two related aspects: (1) Do different users exhibit common emotional biases as their information bubble depth increases, rather than falling into disparate emotional states, thus causing the “information bubble” to be “emotionally bound”? (2) If the above result holds, does the emotional similarity between different information bubbles tend to increase as their depth increases, leading to emotional convergence among users who are “emotionally bound” within these bubbles?
Through exploring and responding to these questions, the innovations and significance of this paper mainly lie in the following aspects: (1) Clarifying the emotional biases of social network users trapped in information bubbles, indicating that users are not only cognitively confined but also emotionally bound; (2) Analyzing the emotional tendencies of users’ information bubbles and to what extent these bubbles are emotionally bound; (3) Attempting to extend the theory from “information bubbles” to “emotional bubbles” and from “individual cages” to platform “public cages” in the formation of emotional biases within information bubbles.
2. Literature Review and Problem Analysis
(1) Information Bubbles
The concept of “information bubbles” was proposed by American scholar Cass R. Sunstein (2008) in “Information Utopia”. It refers to the phenomenon where, in the context of the rise of personalized information services in the digital age, we only hear what we choose and what pleases us, ultimately trapping ourselves in a cocoon-like bubble. With further research into information bubbles, several related concepts have emerged, such as “filter bubbles” and the “echo chamber effect.” These concepts are associated with “information bubbles” but have their distinct meanings. The “filter bubble” is a phenomenon similar to “information bubbles”. Pariser found that search engines can understand user preferences at any time and filter out heterogeneous information, creating a personalized information world for users, but this also builds an “isolation wall” that hinders the exchange of diverse viewpoints. Pariser termed this the “filter bubble” (Guo Xiaoan, Gan Xinyue, 2018). The “echo chamber effect” is one of the consequences of information bubbles, indicating that in a network space, if all you hear are echoes of your own opinions, you will believe your views represent the mainstream, distorting your understanding of general consensus (Sunstein, 2003).
Currently, there is some debate in academia about whether the information bubble effect exists, but most studies, both domestically and internationally, support this viewpoint and have examined and discussed the degree of singularity and homogeneity in users’ information acquisition. In terms of the actual measurement of information bubbles, academia currently approaches this from different dimensions of content consumption and content production. One approach measures the limitations and singularity of users’ information exposure from the perspective of information reception and reading, i.e., measuring the “information bubble” from the content consumption dimension. For example, Zhao et al. (2020) measured the “information bubble” by observing the diversity and concentration of topics recommended by the recommendation system as users’ online time (or clicks) increased. If users read a large number of articles belonging to a single thematic category, they are at greater risk of falling into an information bubble. Xu et al. (2020) utilized human behavior sequences as input for word embedding models to track the attention movement sequence of mobile reading users from one point to another, outlining each user’s bubble degree and the types of content they fell into. Yang Guang and She Jialing (2020) used survey methods to measure the information bubble effect in users’ usage of the Toutiao platform, discovering that the more immersed users are in the platform, the higher the homogeneity of recommended information and the lower the diversity of viewpoints. Another approach measures the homogeneity and closure of content users focus on from the perspective of information publication and production. For example, Zhang Shufang and Yang Ning (2019) argued that information bubbles affect users’ information production activities and externalize to the information they produce, narrowing users’ information acceptance while also narrowing and singularizing their information production. Chen Huashan and Wang Chengwei (2019) calculated users’ topic preference indexes based on the probability of different content replies on different category themes to measure the bubble effect in the Tencent News app. Di Marco et al. (2021) quantified users’ preference intensity based on comments made under different videos on YouTube, which had varying political biases and fact-checking indicators, providing evidence for the existence of the “echo chamber effect” on two dimensions: political bias and information channel credibility. Zheng & Gupta (2019) assessed users’ “interest narrowing” based on the diversity of content posted by users (i.e., the number of different words used in all posts made by users over a period). Jatowt et al. (2015) quantified users’ attention patterns and the diversity of discussion topics based on the content of tweets posted by users over a period.
This study focuses on the emotional biases reflected in the information production dimension of social network users’ information bubbles, exploring how the emotional biases of their information production manifest as the depth of their information bubbles increases. Researching the emotional biases and characteristics of “information bubbles” in the context of information production is crucial for a deeper understanding of emotional dissemination on social platforms.
(2) Emotional Biases of Information Bubbles
From the perspective of information production, most scholars in existing studies on information bubbles and emotional biases believe that the degree of users’ information bubbles can lead to negative emotional biases. Sunstein (2003) suggested that discussions among individuals with similar viewpoints lead to negative emotional biases. Bessi et al. (2015) found in empirical studies on social media that users’ content production around a specific worldview promotes the formation of homogeneous communities; within these homogeneous communities, whether faced with facts or rumors, the more content produced and the longer discussions last, the more likely emotional biases will turn negative. However, discussions about rumor posts often express more negative emotions than factual posts. Del Vicario et al. (2016) further discovered that users’ emotional behaviors are influenced by their participation in communities: the higher the participation in echo chambers, the more negative the emotional biases. In other words, the more frequently users produce the same or similar information, the more their emotions tend to be negative. However, while this research suggests that information bubbles have emotional biases, it has not sufficiently explored which specific emotional types users with high information bubble degrees tend to favor. As the depth of information bubbles increases, what emotional biases do social platform users exhibit, especially which specific emotions they lean towards, is the fundamental issue this paper addresses in its study of the emotional biases of information bubbles.
The relationship between information bubbles and emotional biases also involves the relationship between cognition and emotion, but current research on how emotions affect cognition and how they interact remains contentious. Early studies primarily focused on the effects of the positive and negative nature of emotions on cognition. Fredrickson (2001) proposed the “broaden-and-build” theory of emotions, suggesting that positive emotional experiences can help individuals cultivate a more open attitude towards information and more flexible thinking, broadening cognitive horizons. Based on this, some scholars have explained how emotions influence cognitive scope from the perspective of motivational intensity, providing new angles and research directions. Price & Harmon-Jones (2010) defined motivational intensity as the magnitude of motivational force and the dynamics of behavioral tendencies, finding that only low-motivational-intensity positive emotions can broaden cognitive scope, while high-motivational-intensity positive emotions narrow cognitive scope. Furthermore, Harmon-Jones et al. (2013) found that although past studies generally suggested that positive emotional states lead to broader cognitive scope while negative states lead to narrower scope, the reality is that cognitive scope is influenced by motivational intensity. Regardless of the positivity or negativity of the emotional state, low motivational intensity broadens cognitive scope, while high motivational intensity narrows it. Since the introduction of motivational intensity theory, many scholars have tested this theory. Liu et al. (2014) used behavioral and neurophysiological methods to verify that high motivational intensity emotional states expand attention scope. Ma & Li (2016) found that low-motivational-intensity negative emotions (sadness) compared to high-motivational-intensity negative emotions (disgust) increased attention flexibility in covert attention orientation tasks, indicating that low-motivational intensity negative emotions broaden attention focus. Yang et al. (2021) discovered through global-local task experiments measuring attention breadth that participants in high-intensity emotional environments made fewer global selections than in low-intensity environments, suggesting that attention width narrows. These studies explore the relationship between emotional type biases and cognitive narrowing, providing valuable references for this research, while further exploration of the relationship between emotion and cognition in social network platform content production and information dissemination is necessary.
The relationship between information bubbles and emotional biases may also be related to the characteristics of emotions themselves in social networks. Different types of emotions exhibit varying characteristics in social network dissemination. In group dissemination, Joiner (1994) pointed out that negative emotions spread more easily than positive emotions. Regarding new forms of dissemination such as electronic media or online media, they exhibit differences and complexities in emotional characteristics compared to the general human psychological tendency towards negativity. Belkin et al. (2006) studied the emotional dissemination characteristics of online users in network environments, finding that compared to negative emotions, positive emotions spread more widely and have a larger area of emotional contagion, also promoting future relationships. Thelwall et al. (2010) analyzed user comments on the MySpace platform, concluding that positive emotions have stronger dissemination capabilities. Wu et al. (2011) studied the relationship between information content and information decay speed on Twitter, revealing that rapidly decaying information contains significantly more negative emotions and behaviors, while long-lasting information contains more positive emotions and terms related to leisure and life. Hansen et al. (2011) examined the impact of emotions on retweets and their complex associations, finding that in random samples, positive emotions promote retweets for social messages, while negative emotions promote retweets for news content, which researchers termed as “saying nice things to friends while delivering bad news to the public.” Zhao et al. (2012) studied Sina Weibo, segmenting emotions into anger, joy, sadness, and disgust, finding that anger spreads more easily on Weibo, while sadness does not spread as easily.
At the same time, different types of emotions have different impacts on users’ cognition, attitudes, and expressions. Forgas (1998) noted the role of emotions in group polarization regarding tendencies and degrees: in positive emotional experience contexts, individuals’ decision-making judgments become more positive after group discussions, while in negative emotional contexts, they become more negative. Kramer (2012) found in a study based on Facebook that the positive and negative emotions expressed in online comments can influence audience emotions through emotional contagion, leading audiences to develop similar attitudes. Wollebæk et al. (2019) argued that anger strengthens echo chambers in the digital public sphere, while fear diminishes them. If information bubbles exhibit emotional biases, what characteristics the emotions biased within these bubbles exhibit among social network users is also a related question worth investigating.
Based on the above considerations, this paper poses the first question:
Q1: Do users’ information bubbles exhibit emotional biases, and if so, what are these biases? Do information bubbles possess distinct, differentiated emotional biases, or do they share common emotional biases?
The relationship between information bubbles and emotional biases may also relate to the emotional characteristics of the platform. In the case of Weibo, there is no unified conclusion regarding its dominant emotions. Some studies suggest that Weibo is primarily characterized by negative emotions. Sui Yan and Li Yan (2012) argued that in a context where personal emotions are freely expressed, the online space is filled with negative emotions such as blame and dissatisfaction. Liu Cong et al. (2015) categorized emotions in Weibo dissemination into recognition, fear, doubt, worry, opposition, anger, sadness, surprise, and neutral, discovering that anger and doubt emotions dominate among ordinary users. However, some empirical studies have found that Weibo is dominated by positive emotions. Chen Anfan et al. (2019) found that the proportion of users expressing positive emotions on Weibo exceeds those expressing negative emotions, indicating a “positivity dominating” trend. If information bubbles exhibit emotional biases, whether these biases align with the platform’s emotional tendencies is another question worth exploring.
The research on the emotional biases of information bubbles in this paper focuses on how social network users exhibit emotional characteristics as their information bubble depth increases. Previous research on information bubbles and related concepts generally suggests that users trapped in information bubbles lead to convergence of information and opinions. This convergence is reflected not only in the similarity of the content users receive in terms of themes and positions but also in the groups or circles users belong to, where their information and opinions also converge. The convergence of information and opinions, when reflected in information production, raises the question of whether it will lead to emotional convergence among users. Consequently, this paper continues to propose a question closely related to Q1:
Q2: If users exhibit the same emotional biases as their information bubble depth increases, do users with higher information bubble degrees exhibit more convergence rather than differentiation in their emotions?
Overall, as a carrier of users’ emotional expression, social platform information production has not received sufficient attention in the context of the relationship between information bubbles and emotional dissemination; whether information bubbles have emotional biases and what emotions they lean towards, as well as whether these biases lead to emotional convergence, require empirical exploration and characteristic analysis. Existing research has not adequately studied which specific emotional types users with high information bubble degrees lean towards; there is also a lack of large-scale quantitative research and empirical testing to analyze whether users’ emotional biases converge or diverge within groups as the depth of their information bubbles increases. Therefore, this study will depict the emotional biases of information bubbles and explore whether the emotions within these bubbles exhibit convergence or divergence characteristics, aiming to investigate the “emotional biases of information bubbles” and their consequences.
3. Research Approach and Hypotheses
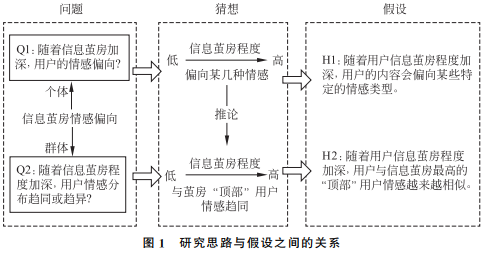
Before conducting quantitative research and empirical testing on the above questions, we need to further discuss the issues. Regarding question Q1, the following hypothesis is proposed:
H1: In social network content production, as the depth of users’ information bubbles increases, their content will lean towards certain specific emotional types rather than random emotional tendencies.
If hypothesis H1 is valid, then the deeper the information bubble, the more concentrated it will be on a few specific types of emotions, indicating that users with higher information bubble degrees are converging towards a few emotions, all moving towards similar goals; users with the highest information bubble degrees are closer to this goal, while those with lower degrees are further away. Thus, while users with the highest information bubble degrees do not represent the direction of emotional convergence, they approximate or reflect this direction. Therefore, the following hypothesis is proposed:
H2: As users’ information bubble depth increases, their emotions become increasingly similar to those of the “top” users within the information bubble.
Here, the “top” users with the highest information bubble degrees among all users are referred to as top bubbles, meaning that H2 is equivalent to: If the degree of user U’s information bubble increases, the similarity of their emotions to those of the top bubbles also increases. The phenomenon of emotional similarity referred to in H2 is termed top convergence.
The hypothesis H1 implies the hypothesis H2, addressing question Q2. The overall research approach of this paper is illustrated in Figure 1.
4. Research Plan and Implementation Process
(1) Data Collection and Preprocessing
Sina Weibo (2021) reported that in September 2020, the monthly active users of Sina Weibo were 511 million, with daily active users of 224 million. In terms of data collection methods, this study adopts a “snowball” sampling method that is broad in coverage and relatively low in cost.
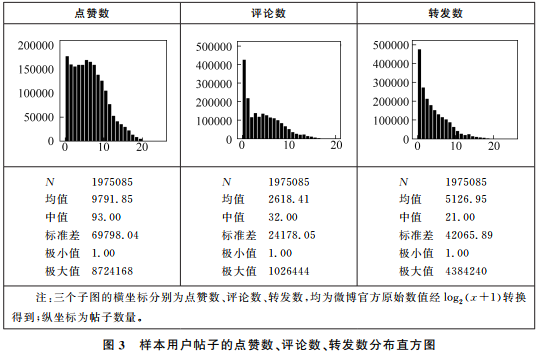
First, the research team utilized the open-source scraping tool “Octopus” and wrote a dynamic web scraping program using Python and Selenium to collect online data. From 47 content sections on the Sina Weibo homepage, posts were scraped twice a day for a month, accumulating 65,650 posts. These posts were widely and roughly evenly distributed across the 47 sections. From the publishers of these posts, 500 users were randomly selected as seed users; for each seed user, one user was randomly selected from their top five followers to obtain the next round of 500 sample users; this process was repeated for 20 rounds to obtain 10,000 sample users (500×20). The final effective user count was 2,143, with a total of 1,975,085 posts published. The analysis results are shown in Figures 2 and 3.

(2) Measuring Post Similarity and User Information Bubble Degree Based on Word2Vec
This paper calculates the similarity of the 300 posts of 2,143 users based on the Word2Vec model to measure the degree of users’ information bubbles. Information bubbles can influence users’ information production activities and externalize to the information they produce, leading to a narrowing and singularization of users’ information acceptance (Zhang Shufang, Yang Ning, 2019). An increased rate of similar or repetitive content indicates a narrowing of individuals’ information perspectives, as they become increasingly indifferent to external voices and shift towards inward growth. Therefore, it is necessary to consider content self-similarity and redundancy as one of the dimensions for measuring narrowing (Xu Xiang, Jin Jing, 2021). For any user’s 300 posts, this study calculates the similarity between each post after vectorization to determine the degree of similarity: the higher the similarity among these 300 posts, the more the user’s themes and interests concentrate on the same or similar content, thus indicating a higher degree of information bubble.
First, the Word2Vec word vectors and their average pooling method are used to quantify post content. Shen et al. (2018) found that averaging word vectors performs better than recurrent and convolutional networks in most cases. Word2Vec is a shallow neural network language model proposed by Mikolov et al. (2013b). It transforms text data into low-dimensional real-valued vectors through unsupervised training, training semantic and syntactic information through language models and projecting into multiple vector spaces to achieve structured processing of text. The vector space model is a common text representation model that covers a wide range of features, but it does not solve the problems of lexical similarity and the “lexical gap.” Word2Vec, based on neural network word embeddings, effectively addresses this issue (Mikolov et al., 2013a).
For the construction and training of the Word2Vec model, the open-source module Gensim (Rehurek & Sojka, 2011) was used. The corpus used to train Word2Vec consisted of 26GB of Chinese corpora, including media news archives, captured posts from online forums, classic literature, and literary texts, resulting in embedded representations for 5,830,979 vocabulary items with good training outcomes.
The calculation method for Word2Vec word vectors and average pooling is as follows. The Word2Vec word vectors are averaged to form sentence vectors, with the parameters set to a 300-dimensional space. Each word in the posts is converted into a 300-dimensional word vector based on the results of word segmentation, and the average value of each word vector is calculated to obtain the sentence vector for the post or short text. Specifically, each word in post T1 is represented as a vector of the form V=[0.01, 1.002, -0.02, …2.26, 0.05, 3.97]. Then, the average value of all word vectors in T is calculated (i.e., average pooling):

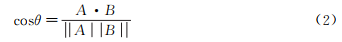
The similarity between posts is calculated using cosine similarity after vectorizing the posts. The larger the cosine similarity, the higher the content similarity of the sentence vectors in semantic space. The cosine value of the angle θ between two post vectors A and B is expressed as:
For the similarity among a user’s 300 posts, i.e., the degree of information bubbles, this can be developed using the “class average method.” The cosine similarity between any two posts (post a and post b) is represented as S(a, b). For the average similarity of n posts from a user, it reflects and measures the average similarity among the posts based on the mutual similarity of the posts: the number of samples for each user is n, excluding the n values equal to 1 in the diagonal position, and averaging the remaining n×(n-1) values, which can be expressed as:
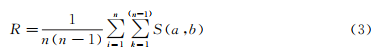
The higher the mutual similarity among users’ posts, the more these contents become similar, identical, or even repetitive, indicating a higher degree of information bubble; conversely, the more heterogeneous the content, the greater the differences among these contents, indicating a lower degree of information bubble.
(3) Emotion Classification
This study categorizes emotions into 32 types based on the research subjects of Weibo social networks. Paul Ekman (2008) identified six common basic emotions: happiness, sadness, anger, disgust, surprise, and fear, a view widely recognized. Plutchik & Kellerman (1980) divided human emotions into eight basic types: fear, anger, joy, sadness, acceptance, disgust, anticipation, and surprise. Xu Linhong et al. (2008) built a classification system based on Ekman’s six major emotion categories, including eight categories: joy, good, anger, sadness, fear, disgust, surprise, and neutral, further subdividing into 23 subcategories. Liu Cong et al. (2015) designed a nine-category emotion scale, including recognition, fear, doubt, worry, opposition, anger, sadness, surprise, and neutral. This study integrates the somewhat ambiguous emotions into 32 categories, specifically: respect, envy, regret, guilt, annoyance, pride, sadness, surprise, shock, reassurance, confusion, helplessness, disgust, being moved, doubt, anger, anticipation, jealousy, disappointment, excitement, sympathy, shame, suspicion, surprise, fear, pleasure, praise, love, nostalgia, panic, recognition, and neutrality.
The emotional type of posts is determined based on their textual content. Due to the large sample size, manual classification is challenging; thus, this study employs machine learning methods, specifically using deep neural networks. First, samples of posts were “tagged” for emotion classification by one coder, who classified 32,000 posts, followed by a second trained individual conducting partial checks. These manually coded samples came from Weibo posts and exhibit basic similarities in short text characteristics and meet the colloquial characteristics of social networks. Each emotion type has 1,000 samples, ensuring equal sample sizes across all emotion types, resulting in a total of 32×1000=32,000 samples for machine learning. The classification of 32 emotional categories is complex, with certain overlaps and ambiguities between categories; for example, “surprise” and “pleasure” may overlap in some contexts, and “annoyance” and “disgust” may also overlap; even manually categorizing posts into a single dominant emotion can be challenging. To verify the accuracy of manual emotion classification, 20 (posts) × 32 (categories) = 640 posts were randomly selected from the manually classified results for re-evaluation by another coder, achieving an agreement rate of 98.9%.
Subsequently, the Bert neural network was employed for machine learning and large-scale emotion determination of posts. The implementation of the Bert neural network model was done using Python 3.8.0 + Keras 2.8.0, with the key parts of the Bert model constructed using the open-source module Keras_Bert, combined with Google’s pre-trained Chinese model (Chinese_L-12_H-768_A-12). The final model had a total parameter count of 101,683,208. If the input posts exceed 64 characters, only the first 64 characters are retained. Weibo posts are typically short, and 64 characters are usually sufficient to reflect the emotions of the post; 70% of posts in the sample are no longer than 63 characters, with a median length of only 35 characters.
After machine classification results were obtained, to examine the accuracy of the machine-determined emotions, 10 posts from each emotion category (totaling 320 posts) were randomly selected for re-evaluation by the coder, achieving a Kappa value of 0.777, with a 95% confidence interval for the Kappa statistic of (0.730, 0.824). The consistency level of Kappa statistics is categorized as follows: 0.55 < Kappa ≤ 0.70 indicates high consistency; 0.70 < Kappa ≤ 0.85 indicates very high consistency; and Kappa > 0.85 indicates extremely high consistency. The high level of consistency between manual and machine emotion classification results further supports the credibility of the analysis results (Monserud & Leemans, 1992).
(4) Hypothesis Transformation
1. Examination of Hypothesis H1
To examine whether users’ emotions narrow towards common emotional states as the depth of their information bubbles increases, the relative distribution of the 32 emotions for each user needs to be calculated, and a correlation analysis between users’ information bubble degrees and the distribution of the 32 emotions must be conducted. For N (N=2143) users, the degree of each user’s information bubble is calculated, expressed as vector Vc; the distribution proportions of the 32 emotions for each user are calculated, yielding 32 vectors, each with a length equal to N, represented as V1, V2, …, V32. Thus, for hypothesis H1, we need to test whether there is a significant positive correlation between Vc and the 32 vectors V1, V2, …, V32, and which vectors show positive correlation.
2. Examination of Hypothesis H2
Hypothesis H2 suggests that the higher the degree of users’ information bubbles, the greater the similarity of their emotions to those of users with high information bubble degrees. Therefore, we calculate the emotional similarity between users and the top k users with the highest information bubble degrees and conduct a correlation analysis between users’ information bubble degrees and this similarity to validate hypothesis H2. The number of top information bubbles is set to different values of k, namely 1, 30, 50, and 100. On one hand, the value of k should be small enough so that these users are among the highest information bubble degree users; on the other hand, in social science research, k ≥ 30 or 50 is an acceptable sampling threshold, ensuring sufficient stability in the statistical results.
For a user and k users’ emotional similarity, we can calculate the emotional similarity between the user and k users pairwise, then use the “class average method” to calculate the average emotional similarity between the user and the k users. The distribution proportions of the 32 emotions for each user are expressed as 32-dimensional vectors, allowing us to calculate the emotional similarity between any two users based on these vectors. The similarity calculation also employs cosine similarity. To calculate the emotional similarity between a user and the top k users with the highest information bubble degrees, we use cosine similarity R(Um, Un) and obtain the average emotional similarity between the user and the k users using the “class average method,” as shown in the following formula:

5. Empirical Analysis Results
(1) Testing Hypothesis H1
The testing results for hypothesis H1 indicate that for all sample users, those with higher degrees of information bubbles are more likely to converge towards a few common emotional biases rather than diverging into various emotional biases. As shown in Table 1, the correlation coefficients between the degree of information bubbles and the emotions of envy, surprise, reassurance, excitement, helplessness, nostalgia are 0.269, 0.196, 0.339, 0.201, 0.142, 0.207, and 0.279, respectively, indicating a certain positive correlation, with p < 0.01, which is statistically significant. The degree of information bubbles also shows a positive correlation with pride and pleasure, with correlation coefficients of 0.071 and 0.068, respectively, both significant at p < 0.01, although these two emotional correlations are relatively small.
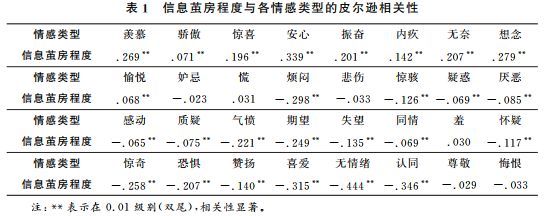
The test results for H1 indicate that users with higher degrees of information bubbles tend to favor a limited set of emotions, such as envy, surprise, reassurance, excitement, helplessness, nostalgia, pride, and pleasure, rather than a broader range of emotions. Among these nine emotions, envy, surprise, reassurance, excitement, pride, and pleasure are characterized by positive emotional traits. Overall, users with higher degrees of information bubbles exhibit a common emotional bias, and these biases tend to have positive emotional characteristics. Being trapped in information bubbles means not only being “emotionally bound” but also being confined to a few specific types of emotions.
To further explore the impact of these nine positively biased emotions on users’ information bubble degrees, this paper employs a stepwise regression strategy to analyze how much these emotions can explain the degree of users’ information bubbles, as shown below.
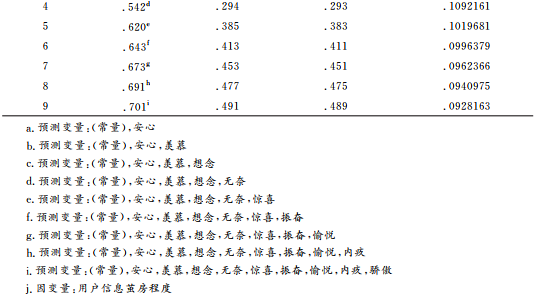
In terms of correlation strength, as the number of emotions increases, the model’s determination coefficient gradually increases, and the standard estimation error gradually decreases (see Table 2). The final model’s adjusted R2 is 0.489, with the F value corresponding to a probability value close to 0. The nine emotions positively correlated with the degree of information bubbles can explain approximately 48.9% of the variations in information bubble degrees.

From the significance of the regression equation, the F value is 228.847, with a corresponding probability value close to 0. When the regression coefficients are not zero, there exists a significant linear relationship between the degree of information bubbles and the nine emotions, validating the choice of a linear model.
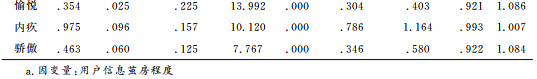
Regarding the significance of regression coefficients, the probability values for each variable are all close to 0, indicating that the regression coefficients for the nine emotions are statistically significant, with no variables to be excluded. The importance of each emotion in relation to the degree of information bubbles is as follows: surprise, helplessness, reassurance, nostalgia, envy, pleasure, excitement, guilt, and pride, with standardized coefficients of 0.382, 0.368, 0.342, 0.259, 0.247, 0.225, 0.197, 0.157, and 0.125, respectively. In terms of multicollinearity diagnostics, the tolerances for reassurance, envy, nostalgia, helplessness, surprise, excitement, pleasure, guilt, and pride are 0.907, 0.901, 0.926, 0.854, 0.785, 0.869, 0.921, 0.993, and 0.922, respectively, with variance inflation factors of 1.103, 1.110, 1.080, 1.172, 1.275, 1.151, 1.086, 1.007, and 1.084, indicating weak multicollinearity in the model (see Table 3).

Analyzing the residuals of the regression equation, the residuals follow a normal distribution, and the regression model meets normality requirements. The variance of the residuals does not show an increasing or decreasing trend with the increase in explanatory variables, indicating no significant heteroscedasticity.
The final multiple regression equation is as follows:

The linear regression equation indicates that the increase in these nine emotions will deepen the degree of information bubbles. Being trapped in a few specific types of emotions also leads to being trapped in information bubbles. Moreover, based on the proportions of these specific emotions, users’ information bubble degrees can be predicted, with an adjusted R2 reaching 0.489.
(2) Testing Hypothesis H2
To validate hypothesis H2, we examine the correlation between users’ information bubble degrees and the emotional similarity between users and the top k users with the highest information bubble degrees. The results indicate that within a certain range, the degree of users’ information bubbles positively correlates with their emotional similarity to the top users.
As shown in Table 4, for k values of 1, 30, 50, and 100, the Pearson correlation coefficients between users’ information bubble degrees and their emotional similarity to the top users are 0.254, 0.260, 0.226, and 0.208, respectively, with p values all less than 0.01, indicating significant correlations. For the emotional similarity between users and the top users, when the k value is 30, the positive correlation is stronger than when k is 1. This relates to the randomness of the most recent users in terms of information bubble degrees. Overall, as the degree of information bubbles increases, users’ emotions become increasingly similar to those of users with high information bubble degrees, indicating that users’ information bubbles exhibit emotional convergence towards the top bubbles.
6. Further Discussion
The findings of this paper, which indicate that the emotional biases have positive characteristics, contrast with existing literature. This discrepancy may be attributed to the emotional biases associated with different platforms. Different media forms or dissemination methods have varying emotional appeals, and different social platforms may trap users with high information bubbles in different emotional states. To verify whether the emotional biases of high information bubble users align with the platform’s emotional tendencies, this paper groups users based on the types of emotions they lean towards and conducts independent sample t-tests to examine whether there are significant differences in post emotional heat, post quantity ratios, and the centrality of post content feature vectors. The emotional heat of posts, the proportion of posts, and the centrality of post content feature vectors reflect the influence, production capacity, and dissemination capacity of that emotion on the platform, indicating its dominance.
The emotional heat of posts is calculated based on the number of likes and comments for each post. First, each indicator value xi is transformed using a logarithmic function with base 2: log2(xi + 1). Then, Min-Max normalization is applied, with the formula being: (xi – min(x)) / (max(x) – min(x)). Both the number of comments and likes are normalized to values between [0, 1], and their equally weighted sum serves as the emotional heat value indicator of the posts.
The post quantity ratio refers to the proportion of a certain type of emotion among all post samples.
The centrality of the content feature vectors of posts refers to the “mainstream” degree of the content of posts of a certain type of emotion or the centrality degree in the class similarity matrix. Specifically, the calculation method is as follows: first, the posts of 32 emotional categories are converted into 300-dimensional vectors using the average pooling method described earlier; for any category of posts (with mi posts), an mi×300 two-dimensional array is formed; then, for any two categories of posts (with mi and mj posts respectively, represented as mi×300 and mj×300), the content similarity between these two arrays is calculated using the previously described “class average method”; finally, the content similarity among the posts of the 32 emotional categories results in a 32×32 similarity matrix. The centrality of each emotion’s content in the global context can be obtained by calculating the centrality using the NetworkX module in Python. In centrality analysis, connections to significant nodes are more noteworthy than mere connections to numerous insignificant nodes (Zafarani et al., 2015).
Whether significant differences exist in the average emotional heat, post quantity ratios, and the centrality of post content feature vectors between different grouped samples is examined through t-tests, as shown in Table 5.
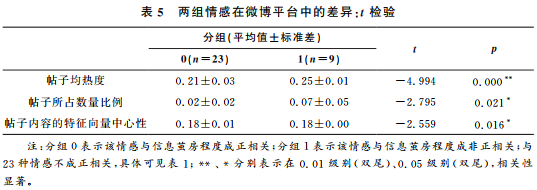
The test results indicate that significant differences exist in the average emotional heat, post quantity ratios, and the centrality of post content feature vectors between different groups (p < 0.05). Specifically, the groups show a significance level of 0.01 in average emotional heat (t = -4.994, p = 0.000), with the average emotional heat of posts not positively correlated with the information bubble degree being 0.21, noticeably lower than the average emotional heat of posts positively correlated with the information bubble degree, which is 0.25. The groups show a significance level of 0.05 in post quantity ratios (t = -2.795, p = 0.021), with the average emotional heat of posts not positively correlated with the information bubble degree being 0.02, significantly lower than the average emotional heat of posts positively correlated with the information bubble degree, which is 0.07. As for the centrality of posts, although no significant differences were observed in the average values between different groups, a significance level of 0.05 was still noted (t = -2.559, p = 0.016). Overall, the emotions favored by users with high information bubble degrees exhibit higher average emotional heat, post quantity ratios, and centrality of post content than other emotions. This indicates that the emotional types with “information bubble emotional biases” align with the dominant emotions of the platform, validating the previous conjecture.
This finding can also be corroborated by some existing studies. Chen Anfan et al. (2019) found that Weibo platforms exhibit “positivity dominating,” where users favoring positive emotions tend to express their information in a more narrow manner, and such information is more likely to disseminate. Wu et al. (2012) pointed out that users who enjoy posting positive Weibo messages receive higher attention, and the accuracy of predictions for these users is higher than for those who post negative Weibo messages.
For the Weibo platform, positive emotions dominate the platform. Individuals are not only confined within their limited information worlds but also bound by the common emotional biases of platform users. The emotional biases of users’ information bubbles not only reflect individual “emotional bindings” but also illustrate a form of “platform emotional cage.”
7. Conclusion
The empirical analysis shows that users trapped in information bubbles exhibit two emotional characteristics: emotional bias and the phenomenon of top convergence. Based on the Weibo platform, as the depth of information bubbles increases, users’ emotions primarily lean towards positive emotions such as envy, surprise, reassurance, excitement, helplessness, and nostalgia. Additionally, the emotional biases of information bubbles are accompanied by the phenomenon of “top convergence,” where as users’ information bubble degrees increase, their emotions become increasingly similar to those of the top users in the information bubble.
Information bubbles exhibit common emotional biases rather than being neutral or random. Information bubbles are emotional and have specific directions and types of emotions. This also implies the theoretical possibility and practical significance of transitioning from “information bubbles” to “emotional bubbles.” In researching social platforms, we should not only focus on the issue of “information bubbles” but also direct our attention towards “emotional bubbles,” examining the emotional characteristics associated with being “emotionally bound” within information bubbles.
Under the premise of emotional biases in information bubbles, they lead to similar emotional states, resulting in emotional convergence towards the top of the bubbles. The emotional convergence at the top of the bubbles implies that platform users are not only trapped by information but also “emotionally bound.” Users are increasingly immersed in similar emotional patterns and characteristics, becoming automated and mechanical emotional subjects. Although users’ emotions appear to be autonomous, they actually lack the freedom of autonomous emotions, as their emotions are consciously or unconsciously influenced or controlled by assimilation, trending towards users with high bubble degrees.
Information bubbles can be partially explained by the emotions they favor. This indicates that information bubbles are not solely determined by technology but result from multiple dimensions working together, among which emotion is a crucial dimension. Diverse emotional content not only benefits individual emotional expression but also facilitates users in breaking through their personal information bubbles to some extent.
Moreover, the emotional biases of information bubbles align with the dominant emotions of the platform. To enable users to successfully break out of their “information bubbles,” we should consider not only promoting the diversification of users’ emotional expressions but also the regulatory function of platforms on users’ emotional guidance. The relative balance of the platform’s emotional environment may also help users break through information bubbles to some extent.
As individuals, we live not only in the “personal bubbles” of limited information worlds but also in the “public bubbles” constructed by media space and its emotions. Social platforms carry individuals’ perceptions, experiences, and judgments regarding their “information environment” and “emotions.” At the same time, they determine how we express emotions, act emotionally, and the emotional imprints we bear. The emotional dimensions and emotional cages behind the platform significantly influence the types of information and emotional bubbles we are trapped in. The various institutional norms in social networks shape network relationships into an institutionalized form, and the “public bubbles” are a result of this layer’s discipline and constraint on individuals, leading to a certain degree of suppressed state. Users are bound not only within their individual information and emotional bubbles but also within the relatively more invisible public “emotional shackles” of the platform.
This article is a phased research outcome of the National Natural Science Foundation project “Mechanism Analysis of Users’ ‘Information Narrowing’ in Social Network Interaction: Based on Data Mining of Weibo” (Project Approval Number: 71804126).
The references for this article are omitted; please refer to the original publication for the complete version.
Reference Format: Xu Xiang, Dong Jieyun: “Research on the Emotional Bias of Users in Information Bubbles in Social Network Content Production,” Global Communication Journal, 2022, Issue 4, Pages 78-99.