Full Link: https://tecdat.cn/?p=34635
Analyst: Lingzi Lu
Customer churn is a serious problem that exists in various industries, and it has also attracted the attention of numerous telecom service providers—because the cost of acquiring a new customer far exceeds the cost of retaining an existing customer(Click “Read the Original” at the end for complete data)。
Related Video
Therefore, it is crucial to explore relevant indicators that may significantly impact customer churn and to predict the future based on existing information. This can help service providers identify potential risks of customer churn and propose targeted plans, thereby effectively improving customer retention rates. The key challenge of the project lies in identifying the most influential factors on customer churn and evaluating various machine learning models to select the best one for prediction.
Solution
Task/Objective
Explore relevant indicators that may significantly impact customer churn; select suitable machine learning models for prediction.
Data Source
The telecom customer churn dataset used for analysis(See the end for free access to the data) covers service categories, demographic characteristics, and account information of over 7,000 telecom business users. The dataset contains a total of 20 variables. The dependent variable is the customer churn indicator, recording whether a customer has churned in the last month. The other 19 independent variables describe customers from multiple perspectives.
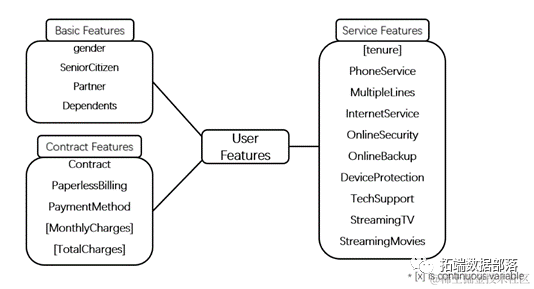
To better understand these characteristics and analyze their relationship with customer churn, I categorized them into three groups. As shown in the figure below, the first category describes the basic characteristics of customers, such as gender, whether they are elderly, and whether they have partners or relatives. These features are closely related to the user’s daily life and may influence their churn behavior. The second category pertains to the characteristics of telecom contracts. This category describes contract duration, whether paperless billing is used, payment methods, and numerical features such as monthly fees and total costs. These features reflect customer choices related to telecom contracts and play a crucial role in customer churn. For example, customers who choose long-term contracts may have a lower chance of churning. The final category focuses on service functions, highlighting indicators related to telephone and internet services.
Exploratory Data Analysis
Exploratory data analysis was conducted through visualizing categorical variables with stacked bar charts and studying the distribution of numerical variables, box plot visualization, and correlation calculations. Based on this, features significantly impacting the target churn variable were selected. Regarding categorical variables, first, elderly customers without partners or relatives have a higher churn rate. Second, customers who choose fiber optic network services over other network services have a higher churn rate. Third, customers with monthly contracts, paperless billing, and electronic check payment methods have a higher churn rate. For numerical variables, customers with shorter total tenure and lower total payments are more likely to leave. Charges are positively correlated with total tenure. The findings provide valuable references for machine learning research and have certain commercial application value.
Data Processing
All categorical variables were converted to dummy variables, and all numerical variables underwent z-normalization to eliminate differences in magnitude between different variables.
Construction
Before building the model, the data was randomly split into a training set and a testing set, with a ratio of 3:1; during model tuning, 5-fold cross-validation was used.
Modeling
KNN
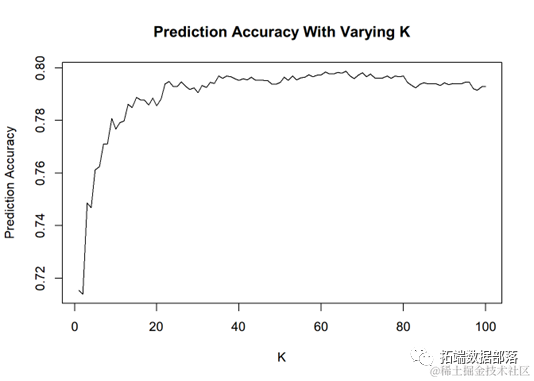
The K-Nearest Neighbors (KNN) classifier is one of the most classic and intuitive methods in supervised learning. The concept of the nearest point is defined by Euclidean distance, so it is necessary to transform features into a standard range to avoid the dominance of some large-range features. Since the data has already undergone z-normalization, this will not be an issue for the model.
During parameter adjustment, different values of K from 1 to 100 were tried. The prediction accuracy of 5-fold cross-validation is shown in the figure below. Ultimately, the optimal K was selected as 66.

Naive Bayes
Logistic Regression
I performed backward selection, forward selection, and stepwise selection on features through 5-fold cross-validation, where the accuracy shown in the table is calculated by averaging performance on the validation dataset. Based on their performance, stepwise selection was ultimately chosen as the model.
According to the p-values of the logistic regression coefficients, total tenure, monthly fee, and telephone service are the top three significant variables. Total tenure and telephone service have a negative impact on customer churn, while monthly fee has a positive impact. In other words, if a new customer has a short total tenure, lacks telephone service, and pays a high monthly fee, they are likely to churn. This is intuitive, as long-term customers are more loyal. Moreover, without telephone service, customers’ reliance on a specific telecom service provider is not strong. Additionally, high monthly fees may deter customers from continuing to use a telecom company’s services.
LDA/QDA
I implemented two forms of discriminant analysis: Linear Discriminant Analysis (LDA) and Quadratic Discriminant Analysis (QDA). The former is more flexible than the latter but does not require estimating too many parameters.
Random Forest
A forest is built randomly, consisting of many decision trees, where each decision tree in the random forest is uncorrelated. Once the forest is obtained, when a new input sample enters, each decision tree in the forest makes a judgment on which class the sample should belong to (for classification algorithms), and then the class chosen the most is predicted as that class for the sample.
Support Vector Machine
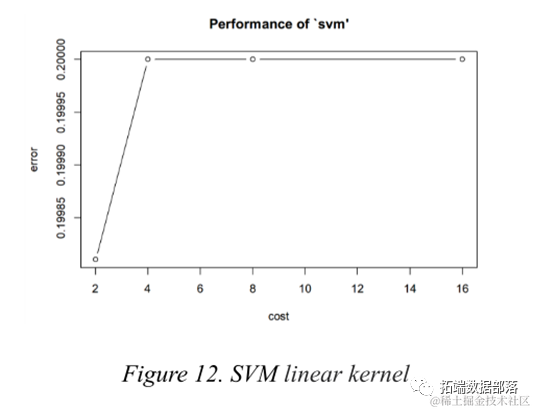
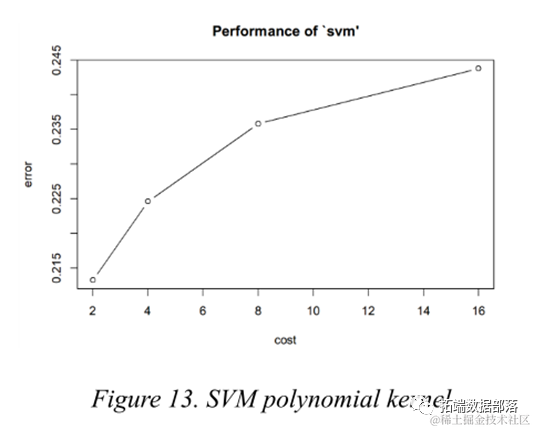
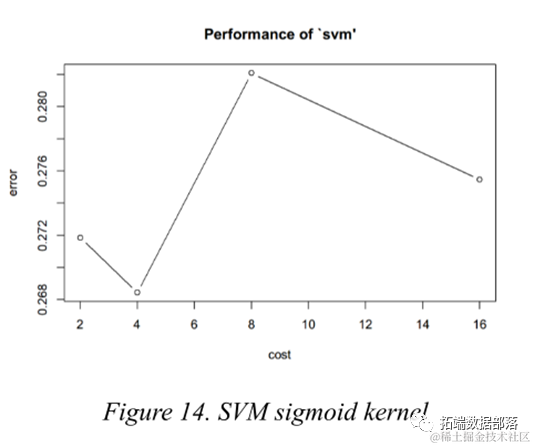
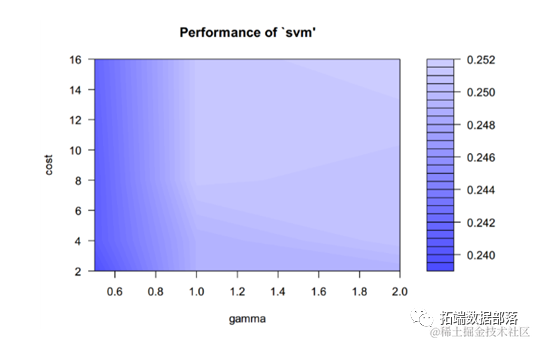
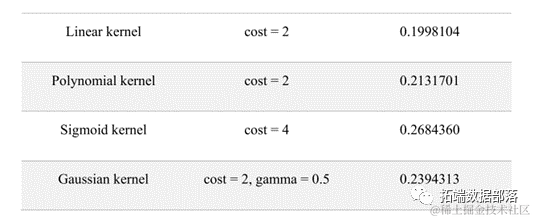
The Support Vector Machine finds a hyperplane to separate classes with the maximum margin. To some extent, it is similar to Logistic Regression and LDA, but Support Vector Machine performs quite well when classes are almost separable. Furthermore, kernel support vector machines can draw nonlinear boundaries, making the modeling very flexible. The most common kernel functions are linear, polynomial, Gaussian RBF (radial), and Sigmoid.
During parameter adjustment, different kernel types can be chosen, as well as different values for the penalty parameter c. To obtain a more accurate estimate of model prediction performance, 5-fold cross-validation was employed.
Click the title to view previous content

Data Sharing | R Language Decision Tree and Random Forest Classification of Telecom User Churn Data and Parameter Tuning, ROC Curve Visualization

Swipe left to see more

01
02

03
04
CART
Classification and Regression Trees (CART) are tree-based models that involve stratifying and partitioning the prediction space. The splitting behavior can be summarized as a tree, also known as a decision tree.
In the classification tree, I used the Gini index to measure the purity of nodes, and then recursively performed binary splits on the nodes to search for the optimal partition. Finally, I stopped at leaf nodes based on certain stopping conditions.
However, due to overfitting, classification trees may perform well on training sets but poorly on testing sets. Therefore, we need to prune the tree to make it less complex for better performance on test data. The method I adopted is Cost Complexity Pruning (CCP) and 5-fold cross-validation.

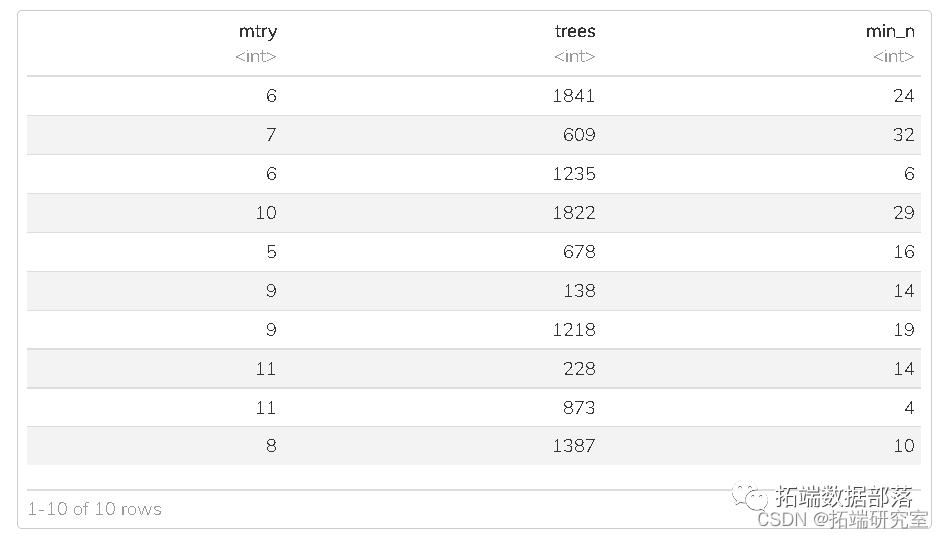
Random Forest
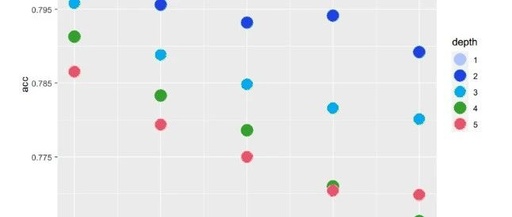
Trees are easy to understand and visualize, but they sometimes lack good predictive accuracy. To address this, we adopted some ensemble learning methods to improve their performance. Random forests take it a step further by randomly selecting features for bagged trees. This selection can break the correlation of bagged trees, making the average result of the trees more reliable. In the randomForest() function, ntree represents the number of decision trees included in the random forest, and max_depth represents the number of nodes from the root node to the furthest leaf node. They are very useful when tuning parameters; we tried setting ntree from 50 to 500 with a step of 50 and max_depth from 10 to 100 with a step of 10. The performance of models with different ntree and max_depth is shown in the figure below.
In the random forest model, we can also know the importance of different variables by averaging the reduction in the Gini index. The most important variables found are TotalCharges, MonthlyCharges, and tenure.
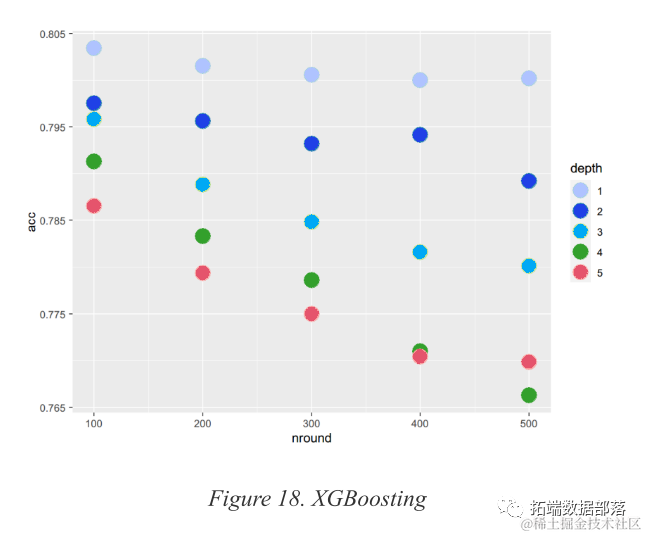
XGBoost
Boosting is another ensemble learning method to improve model performance. The boosting algorithm handles underlying training data by iteratively re-weighting the observations of the training data. Among all boosting algorithms, XGBoosting (Extreme Gradient Boosting) is considered one of the most powerful models. It can use regularization to avoid overfitting, effectively handle missing data, and build trees at extremely fast speeds.
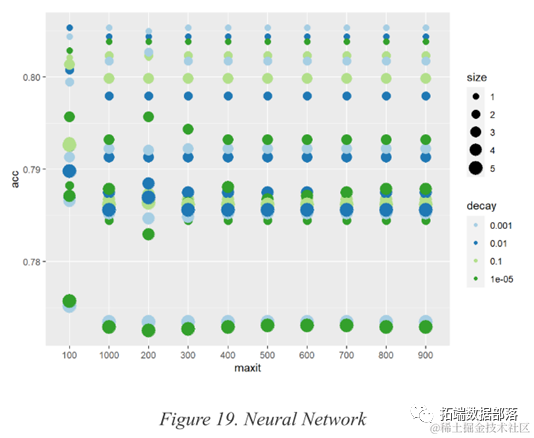
Neural Network
Feedforward neural networks, as a powerful deep learning method, are also used to enhance predictive performance. Feedforward neural networks are a type of neural network where there is no recursive relationship between units, and information only propagates forward in the network. The network is trained through forward and backward computation phases. The R package “nnet” is used to construct feedforward neural networks with hidden layers.
Model Comparison
Metric Selection
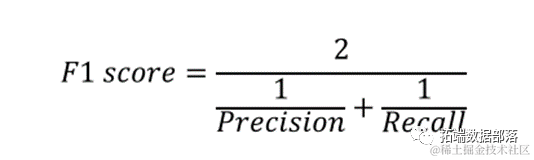
Precision represents the proportion of correctly predicted churn customers among all predictions. Telecom companies want to ensure that the cost of retaining these customers is economically effective. In other words, they are likely to spend money to retain FN+TN customers, but in reality, only TN customers have churned. Therefore, Precision is an important metric for measuring the effectiveness of customer retention programs.
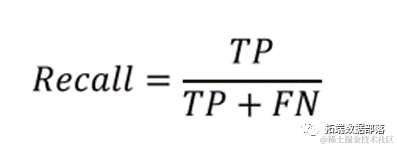
Recall represents the proportion of correctly predicted churn customers among all churn customers. For telecom companies, the more customers with churn tendencies are retained, the better. Therefore, Recall is an effective metric for measuring the ability to successfully identify churn customers.
Comparison
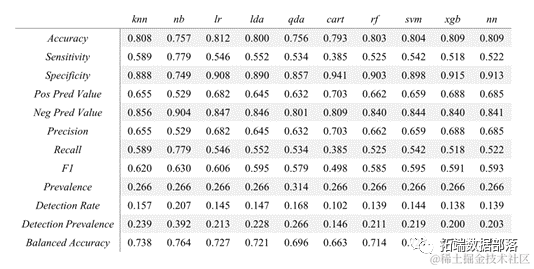
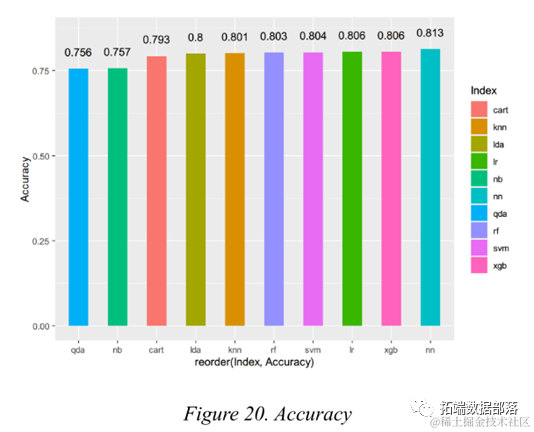


Based on observations from the exploratory data analysis section and the importance metrics in logistic regression and random forests, telecom companies should pay special attention to key variables such as total tenure, monthly fee, and telephone service. If a customer is new, pays high monthly fees, or lacks telephone service, the telecom company is likely to lose that user. Except for the Naive Bayes model and the CART model, the performance of other models is quite good and very similar to each other. If one were to choose one as a recommended method for telecom companies to apply customer churn prediction, the feedforward neural network model may be chosen, as it performs relatively consistently across different metrics.
Based on the above conclusions, the following recommendations are proposed from a business perspective:
1. Based on the feedforward neural network model, create a list of users with high churn rates. Conduct real-time monitoring, user surveys, and follow-ups on listed users.
2. For new customers, discounts such as half-year coupons can be offered to navigate through the peak churn period.For fiber optic users and those with additional streaming TV and movie services, the focus should be on improving network experience and value-added service experience.Enhancing the technical department to improve network metrics is necessary.Additionally, the company should commit to providing target users with free network upgrades and monthly free TV and movie services to increase user stickiness.
3. For value-added services such as online security, online backup, device protection, and technical support, the company should offer discounts primarily based on user referrals and promotions, such as a free experience for the first month or half-year.
4. For monthly contracted users, launch annual contract payment discount activities to convert monthly contracted users into annual contracted users.
About the Analyst
Here, I would like to sincerely thank Lingzi Lu for her contributions to this article, focusing on data cleaning, machine learning, financial data analysis, etc. She is proficient in R and Python.
Data Acquisition
Reply “Telecom on the public account backend to get complete data for free.

This article’s analyzed data is shared in the member group. Scan the QR code below to join the group!

Click “Read the Original” at the end
to get the complete data.。
This article is excerpted from “Customer Churn Prediction in Telecom: KNN, Naive Bayes, Logistic Regression, LDA/QDA, Random Forest, Support Vector Machine, CART, Neural Networks”.


Click the title to view previous content