
Click on the above “Beginner Learning Vision”, and select to add a “Star Mark” or “Top”
Heavyweight content delivered promptly
【Guide】Hello everyone, I am Yongyu. A coder who enjoys exploring and sharing AI knowledge!
Regression analysis provides a solid foundation for many machine learning algorithms.In this article, we will introduce the concept of regression analysis, 7 important regression models, 10 key regression problems, and 5 evaluation metrics.
What is Regression Analysis?
Regression analysis is a predictive modeling technique that studies the relationship between the dependent variable (target) and independent variables (predictors). This technique is commonly used in predictive analysis, time series models, and discovering causal relationships between variables. For example, the relationship between reckless driving and the number of road traffic accidents is best studied using regression.
Regression analysis is an important tool for modeling and analyzing data. Here, we use curves/lines to fit these data points, in such a way that the distance differences from the curve or line to the data points are minimized. I will explain this in detail in the following sections.

Why Do We Use Regression Analysis?
As mentioned above, regression analysis estimates the relationship between two or more variables. Let’s illustrate this with a simple example:
For instance, in the current economic conditions, you want to estimate a company’s sales growth. Now, you have the latest data from the company, which shows that sales growth is approximately 2.5 times the economic growth. Therefore, using regression analysis, we can predict the future sales of the company based on current and past information.
There are many benefits to using regression analysis. Specifically:
-
It indicates a significant relationship between independent and dependent variables;
-
It shows the strength of the influence of multiple independent variables on a single dependent variable.
Regression analysis also allows us to compare the interrelationships between variables measured on different scales, such as the relationship between price changes and the number of promotional activities. This helps market researchers, data analysts, and data scientists to exclude and estimate a set of optimal variables for building predictive models.
How Many Types of Regression Models Do We Have?
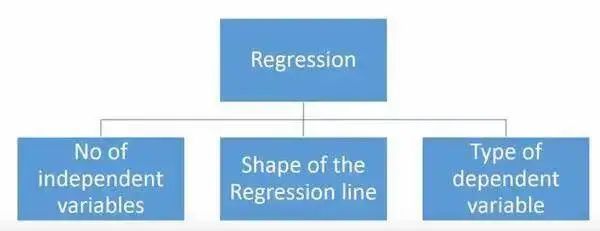
There are various regression techniques used for prediction. These techniques mainly have three metrics (the number of independent variables, the type of dependent variable, and the shape of the regression line). We will discuss them in detail in the following sections.
For those creative individuals, if you feel it necessary to use a combination of the parameters mentioned above, you can even create a regression model that has never been used before. But before you start, first understand the following most commonly used regression methods:
1. Linear Regression
It is one of the most well-known modeling techniques. Linear regression is often one of the preferred techniques when people learn predictive models. In this technique, the dependent variable is continuous, while the independent variables can be continuous or discrete, and the nature of the regression line is linear.
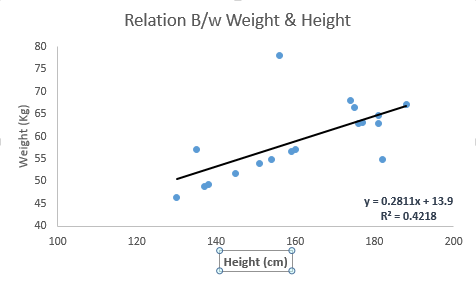
Linear regression establishes a relationship between the dependent variable (Y) and one or more independent variables (X) using the best fitting straight line (the regression line).
It can be represented by the equation Y=a+b*X+e, where a is the intercept, b is the slope of the line, and e is the error term. This equation can predict the value of the target variable based on given predictor(s).
The difference between univariate linear regression and multivariate linear regression is that multivariate linear regression has more than one independent variable (>1), while univariate linear regression typically has only one independent variable. Now the question is, “How do we get the best fitting line?”
How to Obtain the Best Fitting Line (Values of a and b)?
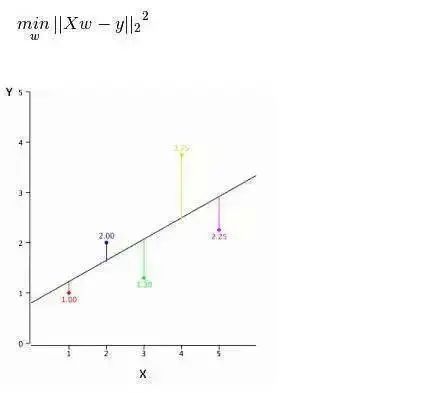
This question can be easily accomplished using the least squares method. The least squares method is also the most commonly used method for fitting regression lines. For the observed data, it calculates the best fitting line by minimizing the sum of the squares of the vertical deviations of each data point from the line. Since the deviations are squared when summed, positive and negative values do not cancel each other out.
We can use the R-square metric to evaluate model performance. To learn more about these metrics, you can read: Model Performance Metrics Part 1, Part 2.
Key Points: 1. There must be a linear relationship between the independent and dependent variables. 2. Multivariate regression may have multicollinearity, autocorrelation, and heteroscedasticity. 3. Linear regression is very sensitive to outliers. It can severely affect the regression line and ultimately impact the predicted values. 4. Multicollinearity increases the variance of coefficient estimates, making the estimates very sensitive to slight changes in the model. The result is that the coefficient estimates are unstable. 5. In the case of multiple independent variables, we can use forward selection, backward elimination, and stepwise selection to choose the most important independent variables.
2. Logistic Regression
Logistic regression is used to calculate the probabilities of “Event=Success” and “Event=Failure”. (Further reading: Comprehensive Analysis and Implementation of Logistic Regression (Python), Summary of Logistic Regression Optimization Techniques (Complete))
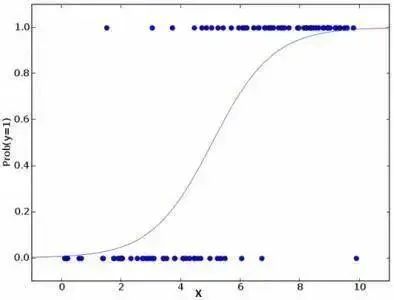
When the type of the dependent variable is binary (1/0, true/false, yes/no), we should use logistic regression. Here, the value of Y ranges from 0 to 1, which can be represented by the following equation.
odds= p/ (1-p) = probability of event occurrence / probability of not event occurrence ln(odds) = ln(p/(1-p)) logit(p) = ln(p/(1-p)) = b0+b1X1+b2X2+b3X3….+bkXk
In the above equation, p represents the probability of having a certain characteristic. You might ask the question: “Why do we use log in the formula?”
Because we are using a binomial distribution (dependent variable), we need to choose a link function that is best for this distribution. It is the Logit function. In the above equation, parameters are chosen by maximizing the likelihood estimates of the observed samples, rather than minimizing the sum of squared errors (as used in ordinary regression).
Key Points:
1. It is widely used for classification problems.2. Logistic regression does not require a linear relationship between independent and dependent variables. It can handle various types of relationships because it uses a nonlinear log transformation for the relative risk index OR of predictions.3. To avoid overfitting and underfitting, we should include all important variables. A good way to ensure this is to use stepwise selection to estimate logistic regression.4. It requires a large sample size because maximum likelihood estimation performs poorly compared to ordinary least squares when the sample size is small.5. Independent variables should not be correlated with each other, i.e., no multicollinearity. However, in analysis and modeling, we can choose to include the effects of interaction among categorical variables.6. If the value of the dependent variable is ordinal, it is called ordinal logistic regression.
7. If the dependent variable is multiclass, it is called multinomial logistic regression.
3. Polynomial Regression
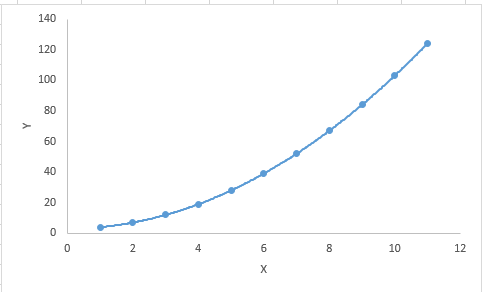
If the exponent of the independent variable in a regression equation is greater than 1, then it is a polynomial regression equation. As shown in the following equation: y=a+b*x^2
In this regression technique, the best fitting line is not a straight line. Instead, it is a curve used to fit the data points.
Key Points:
While there may be an inducement to fit a high-degree polynomial and achieve lower errors, this may lead to overfitting. You need to frequently plot the relationship graph to see how well it fits and focus on ensuring a reasonable fit without overfitting or underfitting.
Below is an illustration to help understand:
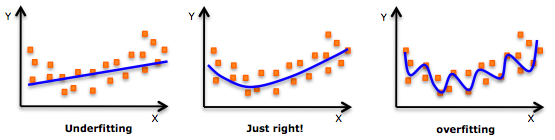
Clearly look for curve points at both ends to see if these shapes and trends are meaningful. Higher-degree polynomials may ultimately produce bizarre inferential results.
4. Stepwise Regression
When dealing with multiple independent variables, we can use this form of regression. In this technique, the selection of independent variables is done in an automated process, which includes non-human operations.
This feat is accomplished by observing statistical values such as R-square, t-stats, and AIC metrics to identify important variables. Stepwise regression fits the model by simultaneously adding/removing covariates based on specified criteria.
Below are some of the most commonly used stepwise regression methods:
- Standard stepwise regression does two things: it adds and removes the required predictions at each step.
- Forward selection starts with the most significant predictors in the model and then adds variables at each step.
-
Backward elimination starts with all predictors in the model and then eliminates the least significant variables at each step.
The goal of this modeling technique is to maximize predictive capability using the fewest number of predictor variables. This is also one of the methods for handling high-dimensional datasets.
5. Ridge Regression
Ridge regression analysis is a technique used for data with multicollinearity (highly correlated independent variables). In cases of multicollinearity, although ordinary least squares (OLS) treats each variable fairly, their differences are large, causing observations to deviate from the true values. Ridge regression reduces the standard error by adding a bias degree to the regression estimates.
Above, we saw the linear regression equation. Remember? It can be represented as:
y=a+b*x, this equation also has an error term. The complete equation is:
y=a+b*x+e (error term), [error term is the value needed to correct for a prediction error between the observed and predicted value]
=> y=a+y= a+ b1x1+ b2x2+….+e, for multiple independent variables.
In a linear equation, prediction errors can be decomposed into two subcomponents. One is bias and the other is variance. Prediction errors can be caused by either of these two components or both. Here, we will discuss the errors caused by variance.
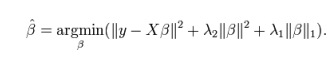
Ridge regression addresses multicollinearity issues by shrinking the parameters λ (lambda). See the formula below:
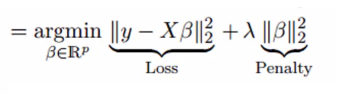
In this formula, there are two components. The first is the least squares term, and the second is λ times β2 (the square of β), where β is the correlation coefficient. The purpose is to shrink the parameters to achieve a very low variance.
Key Points:
1. Except for the constant term, the assumptions of this regression are similar to those of least squares regression;2. It shrinks the values of correlation coefficients but does not reduce them to zero, indicating that it does not have feature selection functionality;3. This is a regularization method, and it uses L2 regularization.
6. Lasso Regression
It is similar to ridge regression; Lasso (Least Absolute Shrinkage and Selection Operator) also penalizes the absolute size of regression coefficients. Moreover, it can reduce variance and improve the accuracy of linear regression models. See the formula below:
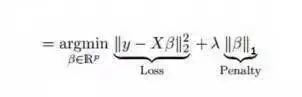
Lasso regression differs from ridge regression in that the penalty function used is the absolute value rather than the square. This leads to a penalty (or equal to the sum of the absolute values of the constrained estimates) that causes some parameter estimates to equal zero. The larger the penalty value, the further estimates will shrink towards zero. This will lead us to select variables from the given n variables.
Key Points:
1. Except for the constant term, the assumptions of this regression are similar to those of least squares regression;2. It shrinks coefficients towards zero (equal to zero), which indeed helps with feature selection;
3. This is a regularization method using L1 regularization;
If a set of predicted variables is highly correlated, Lasso will select one of the variables and shrink the others to zero.
7. ElasticNet Regression
ElasticNet is a hybrid of Lasso and Ridge regression techniques. It uses L1 for training and L2 as a regularization matrix. ElasticNet is useful when there are multiple correlated features. While Lasso randomly selects one of them, ElasticNet will choose both.
The practical advantage of ElasticNet over Lasso and Ridge is that it allows ElasticNet to inherit some stability from Ridge in cyclic states.
Key Points:
1. It produces group effects in the case of highly correlated variables;2. There is no limit to the number of variables selected;
3. It can withstand dual shrinkage.
In addition to these 7 most commonly used regression techniques, you can also look at other models such as Bayesian, Ecological, and Robust regression.
How to Properly Choose a Regression Model?
When you only know one or two techniques, life is often simple. I know of a training institution that tells its students to use linear regression if the result is continuous, and logistic regression if it is binary! However, in our processing, the more options there are, the harder it is to choose the right one. Similar situations also occur in regression models.
In multiclass regression models, based on the types of independent and dependent variables, the dimensions of the data, and other fundamental characteristics of the data, it is very important to choose the most suitable technique. Here are the key factors to choose the right regression model:
1. Data exploration is an inevitable part of building predictive models. When selecting the appropriate model, such as identifying relationships and influences among variables, it should be the first step.
2. By comparing the advantages of different models, we can analyze various metric parameters, such as statistically significant parameters, R-square, Adjusted R-square, AIC, BIC, and error terms; another is Mallows’ Cp criterion. This is mainly done by comparing the model with all possible sub-models (or cautiously selecting them) to check for potential biases in your model.
3. Cross-validation is the best method to evaluate predictive models. Here, you split your dataset into two parts (one for training and one for validation). You measure your predictive accuracy using a simple mean square error between observed and predicted values.
4. If your dataset contains multiple mixed variables, then you should not choose an automatic model selection method, as you would not want to put all variables into the same model at the same time.
5. It will also depend on your purpose. There may be cases where a less powerful model is easier to implement compared to a highly statistically significant model.
6. Regression regularization methods (Lasso, Ridge, and ElasticNet) perform well in high-dimensional datasets and in cases of multicollinearity among variables.
What Are the Assumptions of Linear Regression?
Linear regression has four assumptions:
- Linearity: There should be a linear relationship between the independent variable (x) and the dependent variable (y), meaning that changes in x values should also change y values in the same direction.
- Independence: Features should be independent of each other, meaning minimal multicollinearity.
- Normality: The residuals should be normally distributed.
- Homoscedasticity: The variance of data points around the regression line should be the same for all values.
What Are Residuals, and How Are They Used to Evaluate Regression Models?
Residuals refer to the errors between predicted values and observed values. They measure the distance between data points and the regression line. They are calculated by subtracting predicted values from observed values.Residual plots are a good way to evaluate regression models. It is a chart that displays all residuals on the vertical axis and features on the x-axis. If the data points are randomly scattered around a line without patterns, then the linear regression model fits the data very well; otherwise, we should use a nonlinear model.

How to Distinguish Between Linear Regression Models and Nonlinear Regression Models?
Both are types of regression problems. The difference lies in the data they are trained on.Linear regression models assume a linear relationship between features and labels, meaning that if we take all data points and plot them, a linear (straight) line should fit the data.Nonlinear regression models assume there is no linear relationship between variables. A nonlinear (curved) line should be able to correctly separate and fit the data.

Here are the three best methods to determine whether the data is linear or nonlinear:
- Residual plots;
- Scatter plots;
- Assuming the data is linear, train a linear model and evaluate it based on accuracy.
What Is Multicollinearity, and How Does It Affect Model Performance?
Multicollinearity occurs when certain features are highly correlated with each other. Correlation is a measure of how much one variable is affected by the change of another variable.If an increase in feature a leads to an increase in feature b, then these two features are positively correlated. If an increase in a leads to a decrease in feature b, then these two features are negatively correlated. Having two highly correlated variables in training data can lead to multicollinearity because the model cannot find patterns in the data, resulting in poor model performance. Therefore, it is crucial to eliminate multicollinearity before training the model.
How Do Outliers Affect the Performance of Linear Regression Models?
Outliers are data points that differ significantly from the average range of data points. In other words, these points are different from the data or fall outside the third standard deviation.

The linear regression model attempts to find the best fitting line that minimizes residuals. If the data contains outliers, the best fitting line will shift slightly towards the outliers, thereby increasing the error rate and yielding a model with a very high MSE.
What Are MSE and MAE, and What Is the Difference Between Them?
MSE stands for Mean Squared Error, which is the square difference between actual values and predicted values. MAE is the absolute difference between target values and predicted values.MSE penalizes larger errors, while MAE does not. As the values of MSE and MAE decrease, the model tends to a better fitting line.
What Are L1 and L2 Regularizations, and When Should They Be Used?
In machine learning, our primary goal is to create a model that performs better on both training and testing data. However, basic linear regression models often overfit when data is very limited, so we use L1 and L2 regularization.L1 regularization or lasso regression adds the absolute values of the slopes as a penalty term within the cost function. It helps remove outliers by eliminating all data points with slope values below a certain threshold.L2 regularization or ridge regression adds a penalty term equivalent to the square of the coefficient size. It penalizes features with high slope values.L1 and L2 are useful in cases of limited training data, high variance, and when the number of predictor features exceeds the number of observations, as well as in cases of multicollinearity in the data.
What Does Heteroscedasticity Mean?
It refers to the situation where the variance of data points around the best fitting line is not uniform within a range. It leads to uneven dispersion of residuals. If it exists in the data, the model tends to predict invalid outputs. One of the best ways to test for heteroscedasticity is to plot residual plots.One of the main causes of heteroscedasticity within data is the huge differences between range features. For example, if we have a column ranging from 1 to 100000, increasing values by 10% will not change lower values but will create very large differences at higher values, leading to significant variance differences in data points.
What Is the Role of the Variance Inflation Factor?
The Variance Inflation Factor (VIF) is used to find the extent to which a variable can be predicted using other independent variables.Let’s take an example dataset with features v1, v2, v3, v4, v5, and v6. Now, to calculate the VIF of v1, treat it as a predictor variable and try to predict it using all other predictor variables.If the VIF value is small, it is best to remove that variable from the data. Because a smaller value indicates high correlation between variables.
How Does Stepwise Regression Work?
Stepwise regression is a method for creating regression models by adding or removing predictor variables with the help of hypothesis testing. It predicts the dependent variable by iteratively testing the significance of each independent variable and removing or adding features after each iteration. It runs n times and tries to find the best combination of parameters to minimize the error between observed and predicted values of the dependent variable.It can manage large datasets very efficiently and address high-dimensional problems.
Are There Other Important Metrics for Regression Besides MSE and MAE?
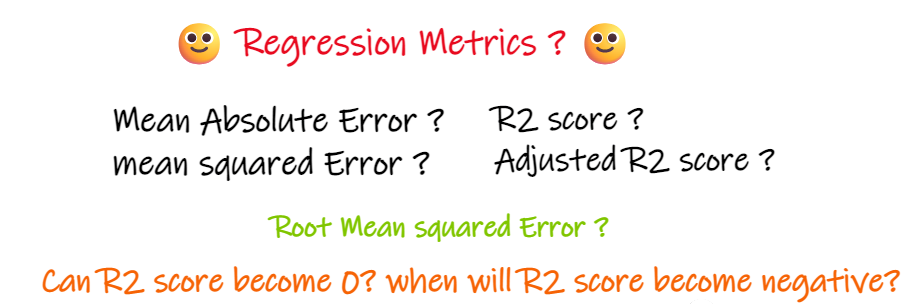
We introduce these metrics with a regression problem where our input is work experience and output is salary. The following diagram shows the linear regression line plotted for predicting salary. Further reading:In-depth Analysis of Model Evaluation Methods
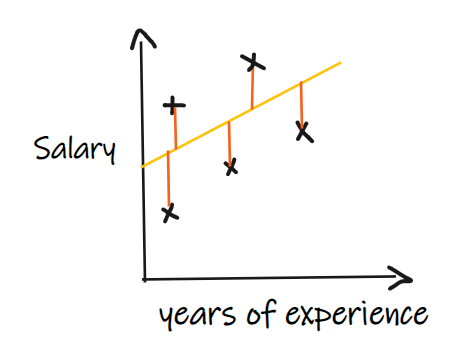
Metric 1: Mean Absolute Error (MAE)
Mean Absolute Error (MAE) is the simplest regression metric. It adds up the differences between each actual value and predicted value and finally divides by the number of observations. For the regression model to be considered good, MAE should be as small as possible.Advantages of MAE:Simple and easy to understand.The results will have the same units as the output.For example:If the units of the output column are LPA, then if MAE is 1.2, we can interpret the result as +1.2LPA or -1.2LPA, MAE is relatively stable against outliers (compared to some other regression metrics, MAE is less affected by outliers).Disadvantages of MAE:MAE uses the absolute function, but the absolute function is not differentiable at all points, so it cannot be used as a loss function in many cases.
Metric 2: Mean Squared Error (MSE)
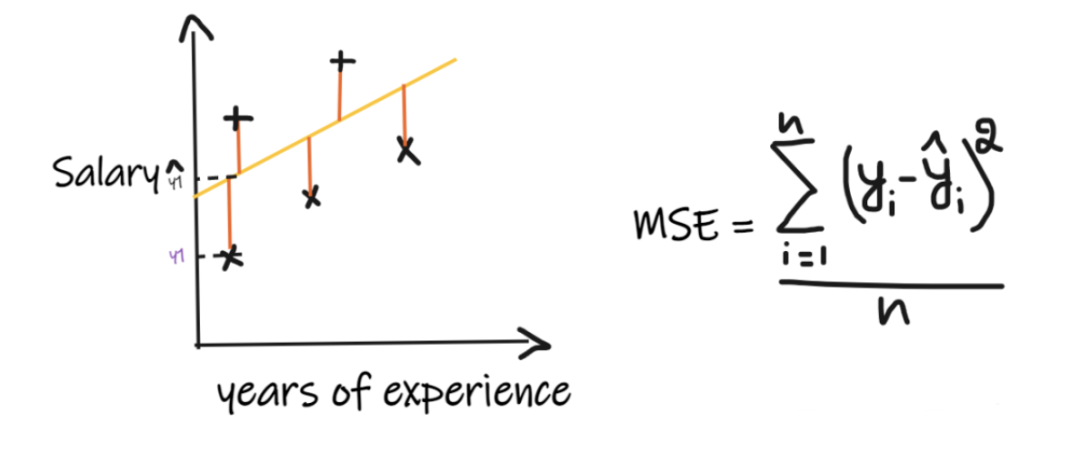
MSE takes the differences between each actual value and predicted value, squares the differences, adds them up, and finally divides by the number of observations. For the regression model to be considered good, MSE should be as small as possible.Advantages of MSE:The square function is differentiable at all points, so it can be used as a loss function.Disadvantages of MSE:Since MSE uses the square function, the unit of the result is the square of the output unit. Therefore, it is difficult to interpret the results. Because it uses the square function, if there are outliers in the data, the differences will also be squared, making MSE unstable against outliers.
Metric 3: Root Mean Squared Error (RMSE)
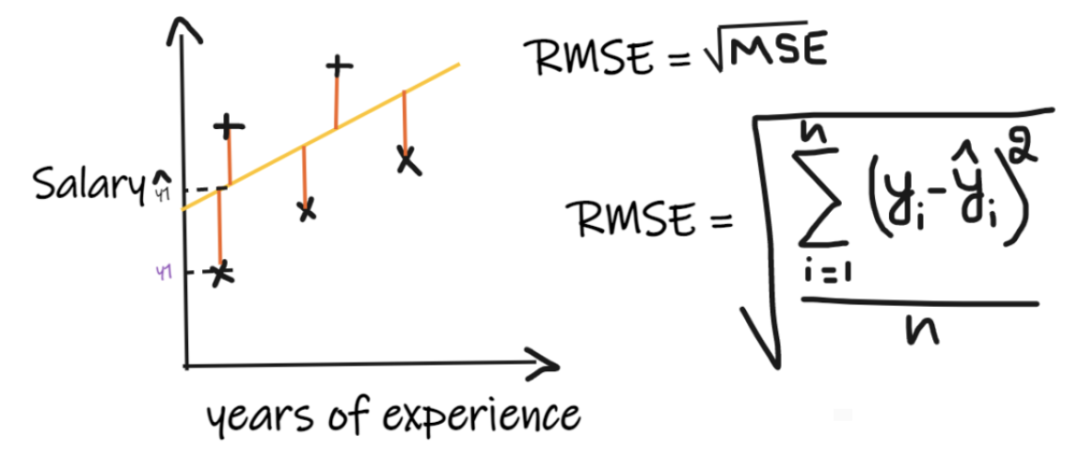 Root Mean Squared Error (RMSE) takes the differences between each actual value and predicted value, squares the differences, adds them up, divides by the number of observations, and then takes the square root of the result. Therefore, RMSE is the square root of MSE. For the regression model to be considered good, RMSE should be as small as possible.RMSE solves the problem of MSE, as the unit will match the output unit because it takes the square root, but it is still less stable against outliers.The above metrics depend on the context of the problem we are solving; we cannot judge the quality of a model just by looking at the values of MAE, MSE, and RMSE without understanding the actual problem.
Metric 4: R2 Score
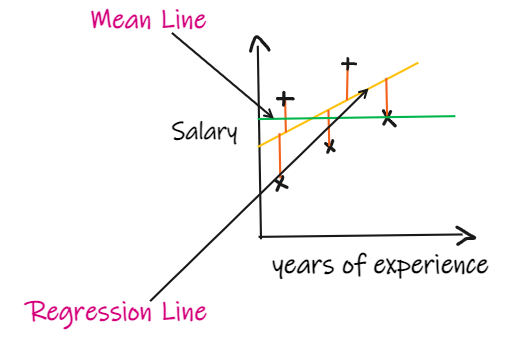 If we have no input data but want to know how much salary a person can get in this company, the best we can do is give them the average salary of all employees.
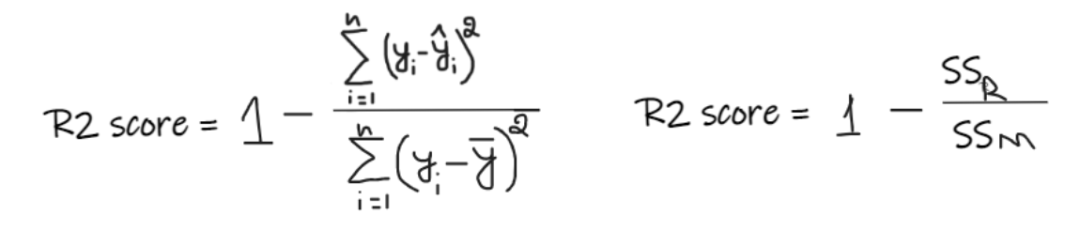
The R2 score gives a value between 0 and 1, which can be interpreted for any context. It can be understood as the goodness of fit.SSR is the sum of squares of errors of the regression line, and SSM is the sum of squares of errors of the mean line. We compare the regression line with the mean line.
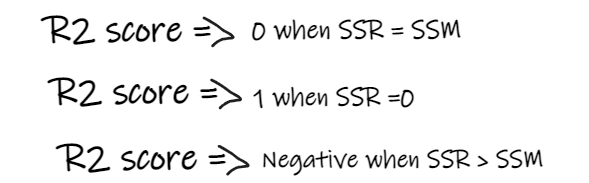
- If the R2 score is 0, it means our model is the same as the average line, thus needing improvement.
- If the R2 score is 1, the right-hand side of the equation becomes 0, which only occurs when our model fits every data point perfectly without errors.
- If the R2 score is negative, it indicates that the right-hand side of the equation is greater than 1, which may happen when SSR > SSM. This means our model is worse than simply taking the average for predictions.
If our model’s R2 score is 0.8, it means that we can say the model can explain 80% of the output variance. In other words, 80% of the salary changes can be explained by the input (years of experience), but the remaining 20% is unknown.If our model has 2 features, years of experience and interview score, then our model can explain 80% of the salary changes using these two input features.Disadvantages of R2:As the number of input features increases, R2 tends to increase or remain the same but never decrease, even if the input features are not important to our model (for example, adding the temperature on the day of the interview to our example will not decrease R2, even if temperature is not important to the output).
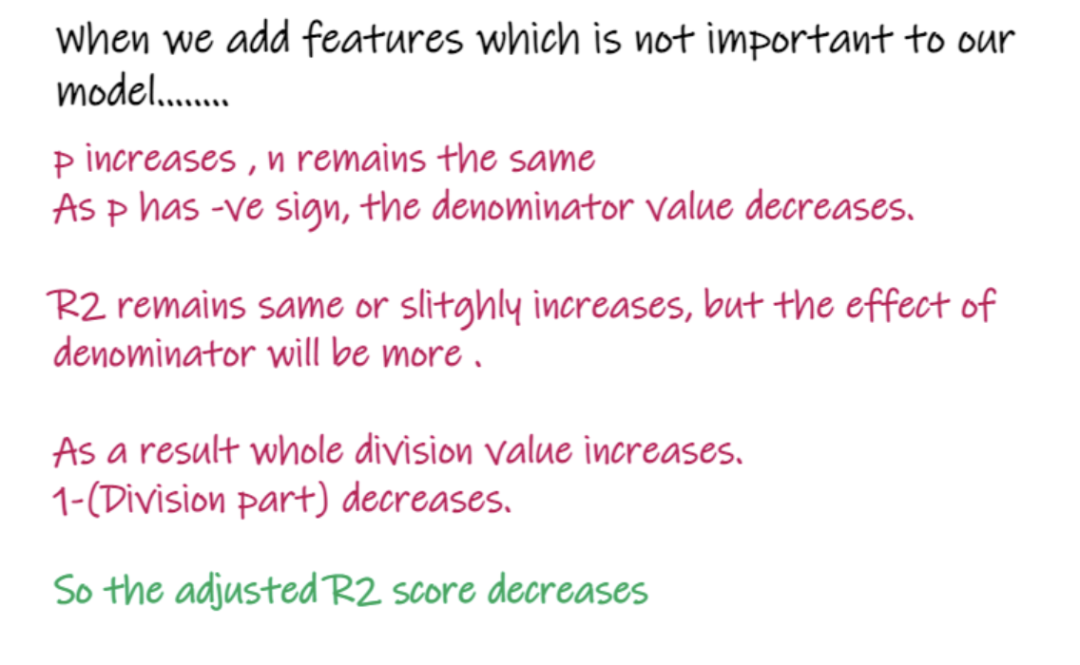
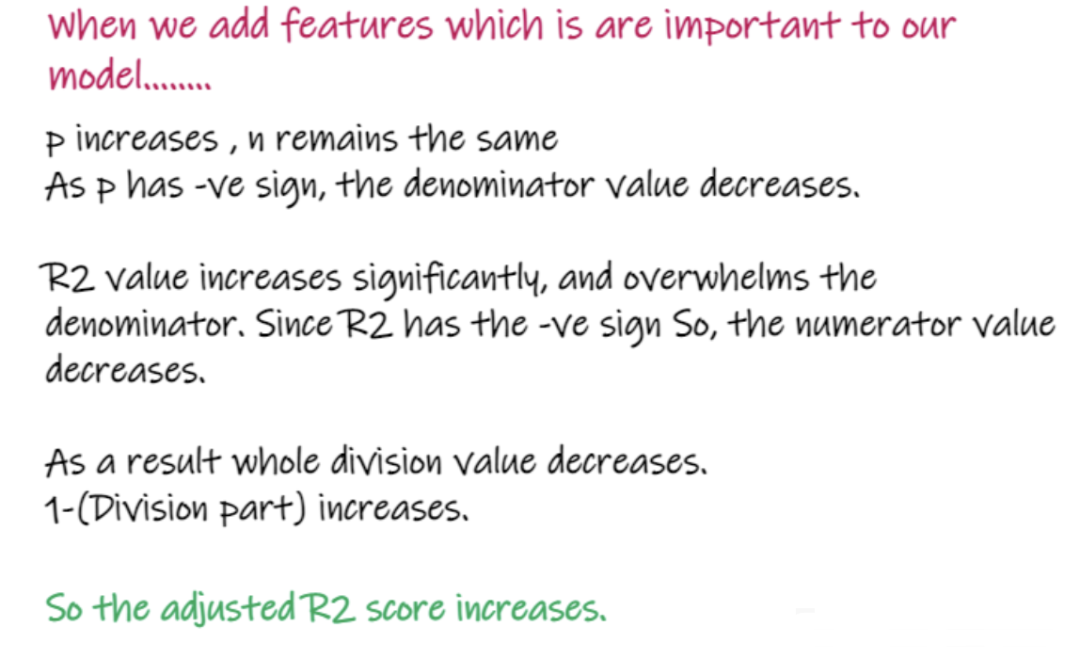
Metric 5: Adjusted R2 Score
In the formula above, R2 is R2, n is the number of observations (rows), and p is the number of independent features. Adjusted R2 addresses the issues of R2.When we add features that are not very important to our model, such as adding temperature to predict salary…
When adding features that are very important to the model, such as adding interview scores to predict salary…
Download 1: OpenCV-Contrib Extension Module Chinese Version Tutorial

Reply "Extension Module Chinese Tutorial" in the "Beginner Learning Vision" public account backend to download the first OpenCV extension module tutorial in Chinese, covering installation of extension modules, SFM algorithms, stereo vision, target tracking, biological vision, super-resolution processing, and more than twenty chapters of content.

Download 2: Python Vision Practical Project 52 Lectures

Reply "Python Vision Practical Project" in the "Beginner Learning Vision" public account backend to download 31 vision practical projects including image segmentation, mask detection, lane line detection, vehicle counting, eye line addition, license plate recognition, character recognition, emotion detection, text content extraction, face recognition, etc., to help quickly learn computer vision.

Download 3: OpenCV Practical Projects 20 Lectures

Reply "OpenCV Practical Projects 20 Lectures" in the "Beginner Learning Vision" public account backend to download 20 practical projects based on OpenCV, achieving advanced learning of OpenCV.

Group Chat

Welcome to join the public account reader group to communicate with peers. Currently, there are WeChat groups for SLAM, 3D vision, sensors, autonomous driving, computational photography, detection, segmentation, recognition, medical imaging, GAN, algorithm competitions, etc. (These will gradually be subdivided). Please scan the WeChat ID below to join the group, and note: "nickname + school/company + research direction", for example: "Zhang San + Shanghai Jiao Tong University + Vision SLAM". Please follow the format; otherwise, you will not be approved. After successful addition, invitations to relevant WeChat groups will be sent based on research direction. Please do not send advertisements in the group; otherwise, you will be removed from the group. Thank you for your understanding~