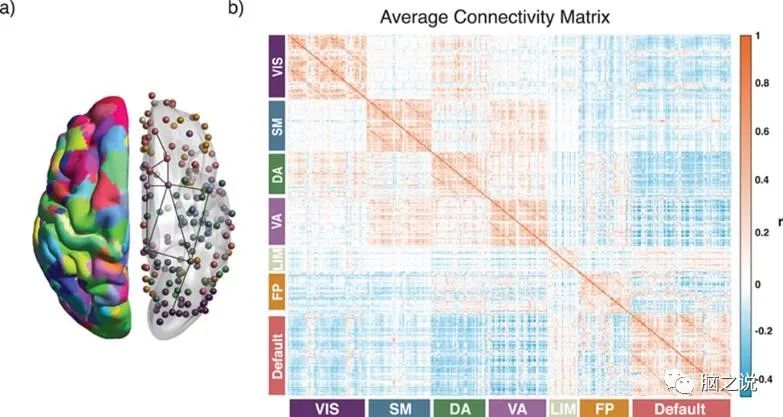
1. Background The development of the brain is influenced by multiple factors, with a higher socioeconomic status (higher socioeconomic status, SES) being one of the important factors. SES during childhood and adolescence is associated with stronger cognitive abilities, academic achievements, and lower rates of mental illness, and can even affect the development of the cerebral cortex in infancy. Some existing studies have found a close relationship between SES and the structural development of the brain, specifically manifested as accelerated brain structural development in individuals with low SES. This indicates that SES may modulate the relationship between age and brain structural development; it remains unclear whether such a modulation exists in brain functional development, prompting further investigation into whether and how socioeconomic status affects the development of functional networks in adolescents. In most of these studies, research on SES has been conducted at the family level, including family income, member education levels, etc., while some studies have also focused on the impact of neighborhood community SES. However, existing research results are still insufficient to clearly reveal the relationship between SES and the functional development of the brains of children and adolescents, and how SES influences this development, particularly regarding the interaction with age. This study utilizes a large cross-sectional imaging dataset across ages in Philadelphia to investigate the relationship between age, SES, and the topology of brain functional networks, examining the impact of SES on functional network topology from the whole-brain level, network level, and individual brain region level, using two network metrics: clustering coefficient and modularity index, studying the influence of SES on the functional network topology structure during adolescent development from a global to a local perspective. This study provides evidence for the connection between SES and the development of functional network topology, offering deeper insights into how early growth environments affect brain neuroactivity.2. Materials and Methods1. Subjects and Data A total of 1012 children and adolescents aged between 8 to 22 years were selected from the Philadelphia Neurodevelopmental Cohort (PNC) dataset, meeting exclusion criteria, with an average age of 15.78 and 552 females. SES measurement combined various characteristics from the subjects’ communities, including marriage rates, poverty rates, family income, neighborhood family income, education ratios, population density, employment rates, etc., to calculate their SES scores. Structural and functional data preprocessing was conducted using the ANTs and XCP toolkits, mapping functional data onto the cortex for subsequent functional network analysis.2. Constructing Functional Networks For each subject, BOLD signals from N = 360 cortical regions were extracted, and the functional connectivity between pairs of regions was represented by calculating Pearson correlation coefficients, resulting in a 360*360 functional connectivity matrix, as shown in Figure 1. Due to the variability and limitations of individual data, only 359 nodes were included in subsequent analyses.
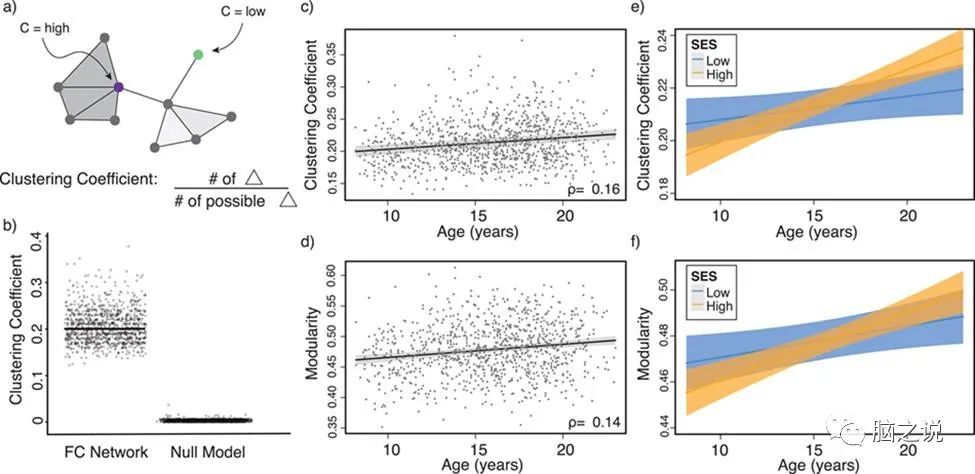
Figure 1: Schematic of the functional connectivity matrix of 360 nodes and 7 subnetworks3. Network Statistics The study primarily focuses on the impact of SES on local and mesoscopic connections of the functional network by calculating the clustering coefficient (Figure 2a) to represent the local connectivity ability of the functional network, and the modularity index of regions to quantify the strength of mesoscopic connectivity in the functional network. These two metrics allow researchers to observe the different impacts of SES on adjacent and extended areas of the brain’s functional network.
Figure 2: The relationship between age and SES variations and the whole-brain functional network topology4. Sensitivity Analysis The study also calculated the impact of the number of excluded template nodes on the functional network under different templates (N = 400), to rule out whether the topology of the brain network is significantly different from those randomly expected topological properties. To gain a more comprehensive understanding of the neural mechanisms between age and functional network topology, the ReHo values of N = 360 regions were also computed as supplementary understanding.5. Modeling Analysis The relationships between various indicators of brain development and age are not always linear, nor is the relationship with SES. Therefore, data were first examined to determine whether there is a nonlinear relationship between the clustering coefficient and age. Analysis was conducted using the R package mgcv. After confirming no significant nonlinear relationships, linear models were used for subsequent analyses, focusing on the effects of age, the interaction between age and SES on functional network topology, controlling for the influences of sex, race, head motion, and the average weight of edges in the functional network. The average edge weight was used as a covariate to ensure that subsequent results reflect changes in network topology rather than global differences in connection strength. Data were fitted using lm() (multiple least squares linear regression) in R:
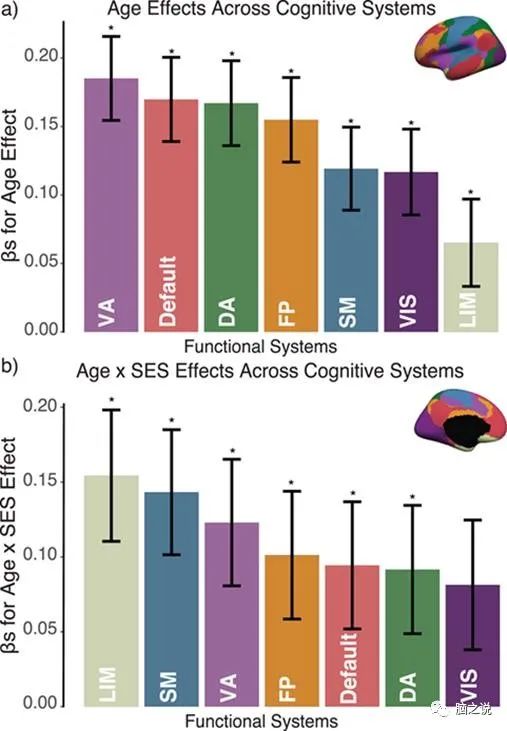
where C is the global clustering coefficient. To observe the relationship between SES and the development of functional networks, the 360 nodes were assigned to 7 functional subnetworks, and the average clustering coefficient of nodes within each network, as well as the linear relationships with age and the interaction between age and SES, were calculated. To study the relationship between ReHo and clustering coefficients, researchers examined the pairwise partial correlations between the two metrics across regions, controlling for other variables as covariates.First fMRI Dynamic Indicators/Functional Connectivity Workshop (Zhengzhou, 2020.8.28—8.31)3. Results1. Age,SES Variations Related to Whole-Brain Network Topology The paper found that age can predict changes in the average clustering coefficient, with older children showing higher average clustering coefficients (Figure 2c, β = 0.17, p < 1 x 10⁻⁷), and a significant interaction between SES and age was also observed; for instance, youths with high SES exhibited a stronger positive correlation between age and average clustering coefficient compared to those with low SES (Figure 2e, p < 0.004). A similar analysis was conducted for mesoscopic connections, finding that age can also predict the modularity index (Figure 2d, β = 0.16, p < 1 x 10⁻⁶), with a relatively significant interaction between SES and age (Figure 2f, p = 0.05).2. Age,SES Variations Related to Subnetwork Topology Researchers divided the 360 nodes of the cerebral cortex into 7 networks and observed the effects of age, SES, and their interactions on the topology of each network (Figure 3). The study found that the impacts of age and SES on different networks varied, with significant effects on the default network, ventral attention network, and dorsal attention network (p < 1 x 10⁻⁷).
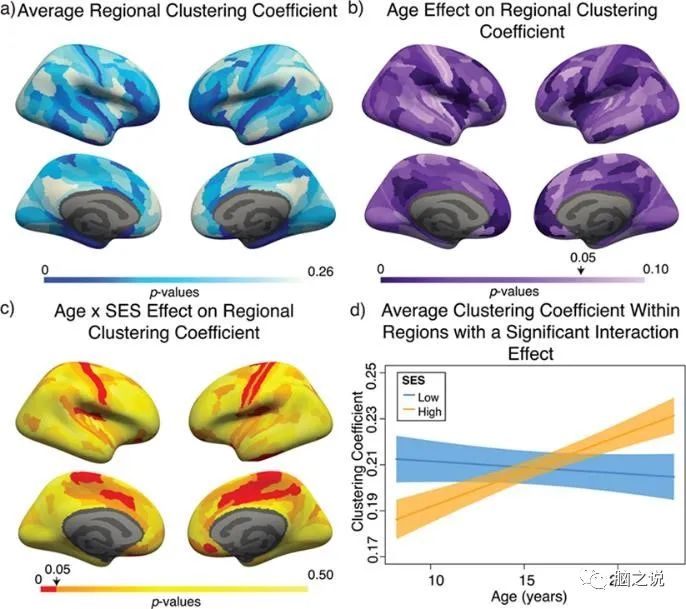
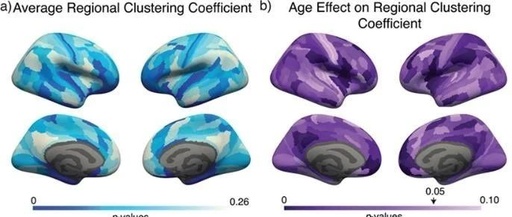
Figure 3: The relationship between age and SES variations and functional subnetwork topology3. Age, SES Variations Related to Specific Brain Region Network Topology This study observed whether the interaction between age and SES appears within cognitive systems at the level of individual brain regions. Researchers noted that the bilateral posterior cingulate and precuneus, bilateral middle temporal gyrus, and insula had the highest clustering coefficients (Figure 4a); in the bilateral orbitofrontal cortex and anterior cingulate cortex, bilateral insula, right precuneus, and bilateral inferior parietal lobule, the clustering coefficients increased with age (pFDR < 0.05, Figure 4b). The moderating effect of SES on age’s clustering coefficient was primarily concentrated in the bilateral anterior and right posterior cingulate, bilateral orbitofrontal, and somatomotor areas (all age × SES effects pFDR < 0.05, Figure 4c), where high SES youths exhibited a stronger correlation between age and clustering coefficient compared to low SES youths (Figure 4d).
Figure 4: The relationship between age, SES, and brain functional networks4. Conclusion This paper studied the relationship between SES and brain network topology. Using a multi-level approach, the study investigated the whole-brain network topology, finding that older age is associated with stronger local connectivity in the network. Compared to adolescents with lower SES, those with higher SES exhibited a stronger positive correlation between local connectivity and age. The findings provide evidence for an association between SES and resting-state functional brain network topology during adolescent development. Additionally, it was observed that SES moderates the effects of race, reducing differences, which aligns with the explanation that adolescents from high SES communities exhibit faster brain functional development. The findings strengthen the evidence of the impact of social environments on adolescent development and can guide government and social organizations to intervene and enhance construction in low SES areas to promote the healthy growth of children and adolescents in these regions.Note: Interpretation is not easy; please share widely for support. Your every share is the best support for us! For the original text and additional materials, please contact Teacher Zhao via WeChat (WeChat ID: 15560177218).
Scientific Research Services
First fMRI Dynamic Indicators/Functional Connectivity Workshop (Zhengzhou, 2020.8.28—8.31)First Magnetic Resonance Data Analysis Techniques Basic Course (Xi’an, 2020.9.25-9.29)Second EEG Data Analysis Techniques Practical Course (Zhengzhou, 2020.8.15—8.20)EEG Data Processing and Machine Learning Analysis ServicesfMRI Data Processing ServicesBrain Imaging Data MVPA and Machine Learning Analysis ServicesStructural MRI Data Processing ServicesFollow Us