For friends who opened the article to read, you must know a bit about MCP (click here to learn more about the product). Today, let’s summarize several important parameters: gain and pulse height distribution, dark current, resistance and current, output linearity, time response, spatial resolution, lifetime characteristics, detection efficiency for ions, electrons, ultraviolet spectra, VUV, and particle beams.
Gain and Pulse Height Distribution
The gain (g) of the Microchannel Plate (MCP) can be expressed as g=exp(G · α), where α (=L/d) is the ratio of the microchannel length to diameter, and G is the secondary electron emission coefficient of the microchannel wall, also known as the gain coefficient. The gain coefficient is an inherent property of the microchannel wall material and can also be expressed as a function of the electric field strength within the microchannel. Figure 1 shows the MCP made from microchannel materials with the same gain, illustrating the trend of gain variation when the α value changes from 40 to 80.
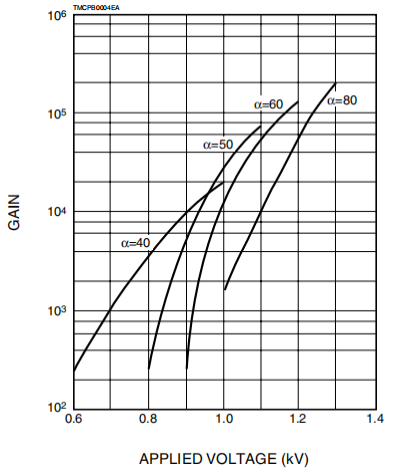
Figure 1 Gain variation curve of MCP at different α values
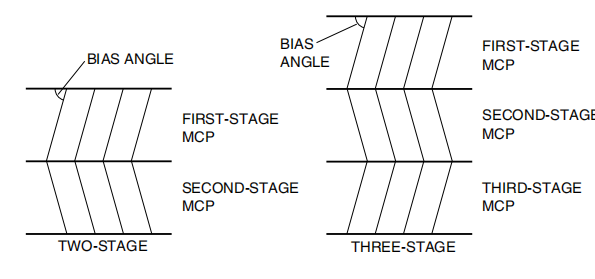
Figure 2 Cross-section of 2-stage and 3-stage MCP components
As can be seen from the figure, as α increases, the gain increases with the increase in voltage and reaches a maximum. However, when the gain exceeds 104, noise increases due to ion feedback, so the gain of MCP cannot increase indefinitely. Generally, α is usually designed to be between 40 and 60, and when the voltage is 1 kV, the gain value is 104.
If higher gain is required, two or three MCPs can be stacked to form a 2-stage or 3-stage MCP. Stacked MCPs are very effective in pulse counting mode, where, unlike analog measurements, weak incident pulse signals can be converted into binary signals. However, when the gain increases to a certain level, the noise caused by the ion feedback effect can also become a problem. When residual gas molecules in the MCP channel collide with the multiplied electrons, ion feedback occurs, and the generated ions return to the input side of the MCP along the electric field, creating false signals and reducing the signal-to-noise ratio. To reduce this phenomenon, two or three MCPs can be stacked adjacently with their angles alternately connected oppositely, as shown in Figure 2. This structure can effectively reduce noise caused by the ion feedback effect because the ions generated by residual gas can be absorbed at the junction between each stage of the MCP, further improving the gain.
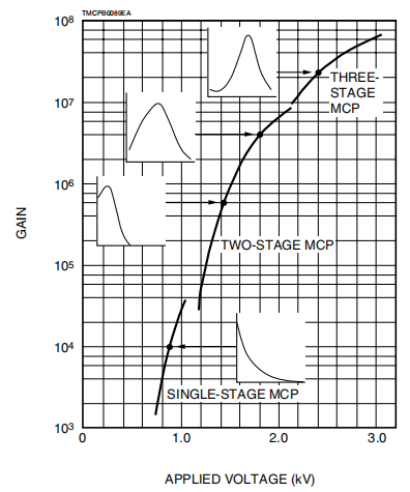
Figure 3 Typical gain curves of single-stage, double-stage, and triple-stage MCPs. As shown in the figure, at a supply voltage of 1 keV, a single-stage MCP can achieve a gain greater than 104, a double-stage MCP can achieve a gain greater than 106, and a triple-stage MCP can achieve a gain greater than 107. However, in the cases of double-stage and triple-stage MCPs, the overall gain is slightly lower than that of single-stage MCPs, because charge loss occurs each time the charge passes through an MCP, and gain saturation also occurs due to the space charge effect within the channel.
Figure 3 Gain characteristics and pulse height distribution curves of different stages of MCP
Figure 4 shows a typical pulse height distribution curve. It is well known that when the gain of the MCP increases to a certain level, space charge saturation occurs. The gain saturation of the channel is primarily due to the electrostatic repulsion between the electrons generated during the multiplication process and the newly emitted secondary electrons. When observing the unsaturated area with a single-stage MCP, the pulse height distribution (PHD) decreases almost exponentially. However, in the area dominated by space charge saturation, the pulse height distribution reaches a peak with smaller dispersion. As the channel diameter decreases, the gain at charge saturation will decrease. For example, for an MCP with a standard channel diameter of 12 µm, the optimum gain for each channel is between 3×10³ and 5×10⁵. Pulse height resolution (PHR) is usually represented by the dispersion of specified pulse heights. As shown in Figure 4, PHR is defined as the ratio of the maximum value of the full width at half maximum (FWHM) in the pulse height distribution to the peak channel value A, as follows, the smaller the PHR value, the smaller the pulse height dispersion:
At the same time, the resolution also depends on the power voltage of the MCP, channel diameter, angle, and distance between MCPs. Typically, the resolution for double-stage MCPs is 120%, while for triple-stage MCPs it is 80%.
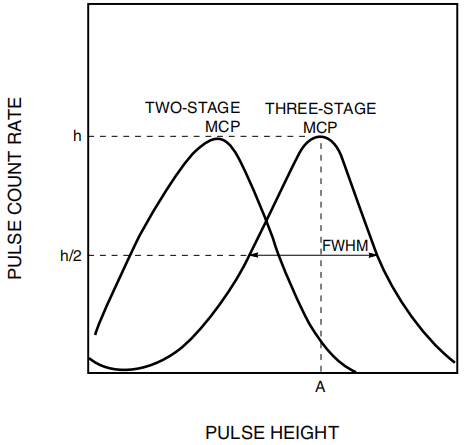
Figure 4 Pulse height distribution characteristic curve
Dark Current
The sources of dark current in MCP mainly include the following points:
① Electric field emission from the inner wall of the channel;
② Ionization of residual gas;
③ Partial discharge of the high potential electric field;
④ Photoelectron emission formed by the scintillation produced by the MCP support part.
We can effectively reduce the dark current caused by partial discharge by improving the manufacturing process, structure, and materials of the MCP. However, regardless, when the power voltage is 1 kV, the MCP will exhibit dark current, with a dark current value of less than 0.5 pA/cm2. In double-stage and triple-stage MCPs, the dark count is also relatively low, under 3 s-1/cm2 at a power voltage of 1 kV per stage. However, in cases where the input signal level is very low, for example at 10 s-1, the MCP operating in gate mode can effectively reduce dark noise because the MCP only operates normally when there is an input signal.

Resistance and Current
The resistance of the MCP can be changed by controlling the material composition and manufacturing process. Considering output saturation, a lower resistance is required. However, since the temperature of the MCP increases with power consumption during operation, the resistance of the MCP can only be reduced to a certain value. The resistance value of the MCP depends on its structural type, usually between 100 MΩ and 1000 MΩ. Low-resistance MCPs with resistance values between 5 MΩ and 30 MΩ are widely used in applications with high output current.
The current refers to the conduction current flowing over the surface of the MCP, as shown in the following formula: Is=V/R.
Where R is the resistance of the MCP, and V is the operating voltage. It can be seen that when the resistance of the MCP is 100 MΩ and the operating voltage is 1000 V, the conduction current is 10 µA.
When the MCP outputs a large current, due to the large amount of secondary electron emission, the channel wall near the output end becomes charged. This phenomenon affects the distribution of potential, weakens the electric field strength, and suppresses the subsequent electron multiplication and emission. However, this charging effect can be neutralized by the conduction current of the channel wall. But since the conduction current of the channel wall is very small and the resistance is high, this neutralization also takes time, which is why this period is also referred to as dead time.
When the output current reaches 5% to 6% of the conduction current, gain decreases and saturation effects occur. Figure 5 shows the saturation characteristic curves of normal resistance MCP (550 MΩ) and low resistance MCP (10.8 MΩ) operating in DC mode. It can be seen that as the conduction current increases, the saturation characteristics improve. In other words, the level of saturation effect is actually proportional to the conduction current of the MCP and determined by the resistance of the MCP. The same results are observed in double-stage and triple-stage MCPs operating in counting mode.
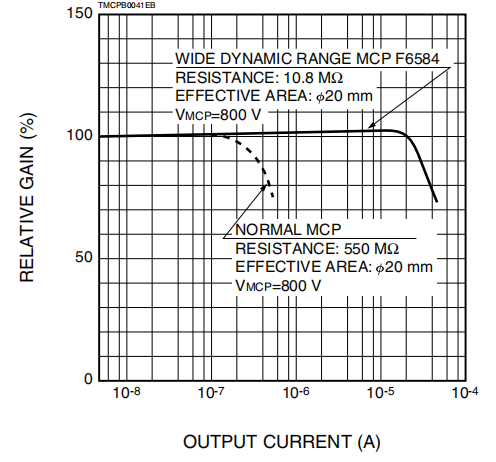
Figure 5 MCP saturation characteristics (analog mode)
Figure 6 shows the typical counting rate characteristics of double-stage MCPs with different resistance values in counting mode. As seen in Figure 7, in DC mode, the increase in counting rate of low-resistance MCPs is proportional to the conduction current.
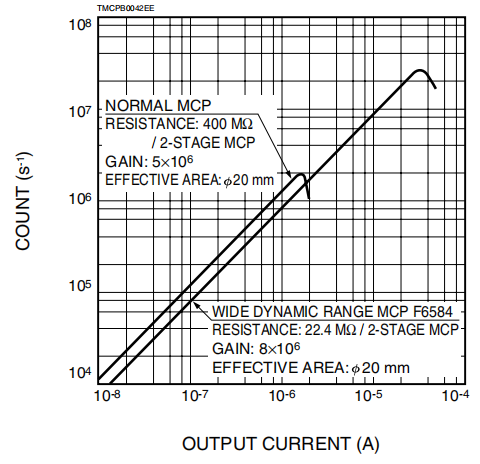
Figure 6 MCP saturation characteristics (counting mode)
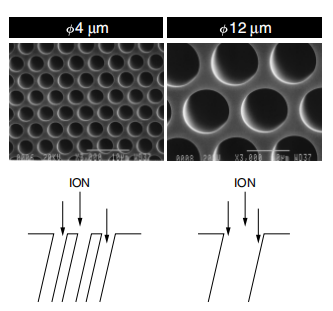
Changing the channel diameter is a very effective way to improve the counting rate. For example, if the diameter of the microchannel is reduced by half, the number of channels occupying a unit area can increase fourfold. Similarly, if the channel diameter is reduced to one-third, the number of channels will increase ninefold. This means that even if the repetition frequency of the input signal increases, the probability of signals entering the same channel is very low, which can effectively reduce dead time and improve counting rate, as shown in Figure 7.
Figure 7 Improving counting rate by reducing channel size
The gain of the MCP is determined by α (=L/d). If the gain is kept at a fixed value, the size of the MCP can be reduced except for the channel diameter and channel length. Figure 8 shows the output waveform and size profile measured for the high-speed MCP component F4655-13 (effective area diameter of 14.5 mm). This component uses a two-stage MCP with a channel diameter of 4 µm. The thickness of the double-stage MCP is very uniform (less than 0.5 mm), corresponding to the electron transfer distance, greatly shortening the electron transfer time, achieving excellent time response characteristics with a rise time of 293 ps and a fall time of 539 s.
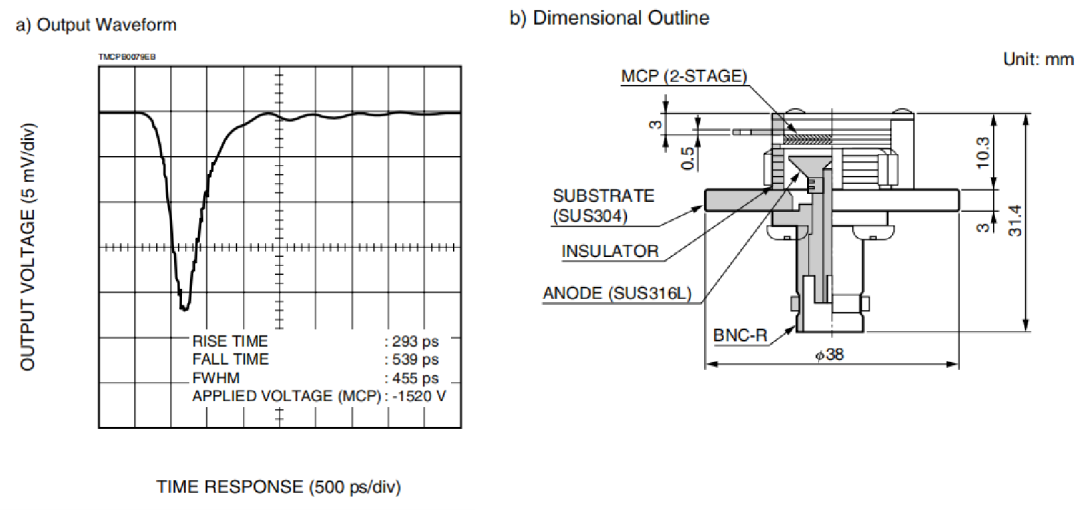
Figure 8 Output waveform and size profile of high-speed MCP component F4655-13

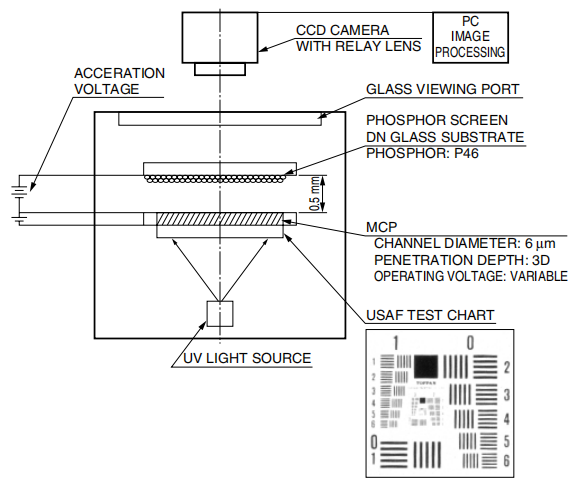
Since each individual channel of the MCP can act as an independent electron multiplier, the spatial resolution of the MCP depends on the diameter and spacing of the two-dimensional channels. When observing the output of the MCP on a fluorescent screen, the spatial resolution also depends on the penetration depth of the MCP output electrode in the channel, the distance between the MCP and the fluorescent screen, and the acceleration voltage. Figure 9 is a schematic diagram of the measurement system for the limit resolution of an MCP with a channel diameter of 6 µm.
Figure 9 Schematic diagram of resolution measurement
In the above measurement system, the U.S. Air Force vision test chart is printed on a glass plate, then directly coupled to the input surface of the MCP and illuminated with a UV light source. The multiplied electrons generated in the MCP strike the fluorescent screen, converting the electrons into visible light that can be observed through a CCD camera. The limit resolution refers to the minimum chart level that can be clearly identified. In this case, when the gain is 1000, the obtained limit resolution is 20~25 µm. In the case of stacked MCPs (2 stages), the overall spatial resolution is lower than that of a single MCP. The main reason is that the electrons diffuse into other channels when they enter the subsequent channel after multiplication in the first channel. Another reason is that when the electron flow is released from the output side of the MCP, the charge density increases, leading to an increase in electrostatic repulsion in the space, which further enlarges the diffusion of electrons between the MCP and the fluorescent screen.

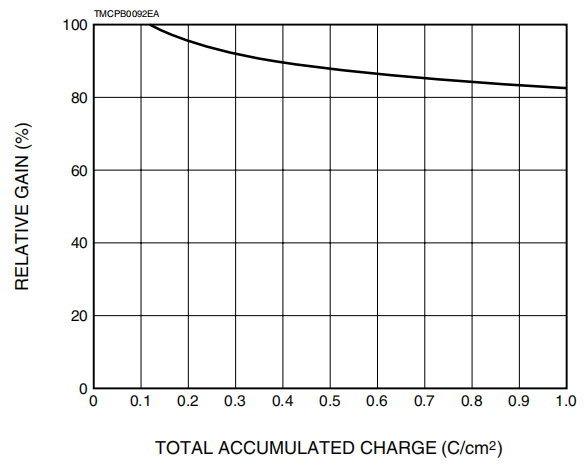
The lifetime of the MCP is proportional to the total charge multiplied in the MCP, but the surrounding environmental gases and vacuum levels also affect the lifetime of the MCP. Figure 10 shows the lifetime characteristic curve of the MCP operating in DC state. This MCP is a single-stage MCP with a channel diameter of 6 µm, installed in a vacuum chamber at 1.3×10⁻⁴ Pa. After aging to stabilize the gain at 0.1 C, continuous operation is performed to measure lifetime data. The degradation of gain can be attributed to the decrease in density of alkali oxides (high δ material MCP glass material) caused by electron collisions with the channel wall, leading to an increase in work function. It can also be attributed to the deformation of the potential distribution caused by changes in resistance near the MCP output.
Figure 10 Lifetime characteristic curve

Detection Efficiency for Ions, Electrons, Ultraviolet Spectra, VUV, and Particle Beams
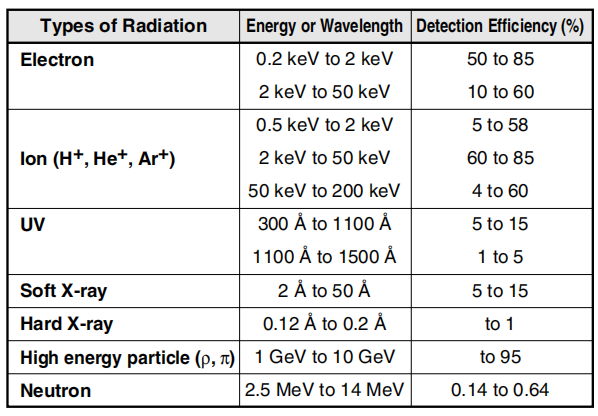
The MCP is sensitive to ultraviolet, x-rays, α particles, charged particles, neutrons, as well as electron and ion beams. Table 1 shows the detection efficiency data of the MCP for different particles. Detection efficiency may vary due to the MCP open area ratio (OAR), the angle and energy of the incident particle beam, and whether the MCP surface is coated.
Table 1 MCP Detection Efficiency
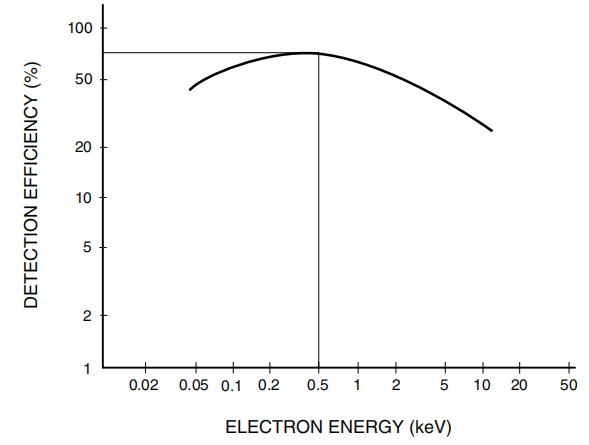
Figure 11 shows the relationship between detection efficiency of electron beams and incident energy, while Figure 12 shows the variation of relative sensitivity measured by changing the angle of the incident electron beam. It can be seen that the detection efficiency is maximized in the electron energy range of 500 eV to 1000 eV. Although sensitivity also depends on incident energy, the maximum detection sensitivity can be obtained when the incident angle is 13° within the same energy range.
Figure 11 Detection Efficiency & Electron Beam Energy

Figure 12 Relative Sensitivity & Electron Incident Angle
Figure 13 shows the detection efficiency of He ions and He neutral particles. From the figure, it can be seen that there is no significant difference in detection efficiency between ions and neutral particles, indicating that within the incident energy range of 1 keV~10 keV, the detection efficiency is relatively high, approximately 50%.

Figure 13 Detection Efficiency of Ions and Neutral Particles & Event Energy
Figure 14 shows the PHD (pulse height distribution) data measured at ion energies of 10 keV, 60 keV, and 100 keV. These data indicate that the results obtained at different energies are almost identical and do not depend on the energy range. Within the energy range of 1 keV~100 keV, the detection efficiency for He ions may be almost the same.
Figure 14 Pulse Height Distribution of Chlorine Ions at 10 keV, 60 keV, and 100 keV
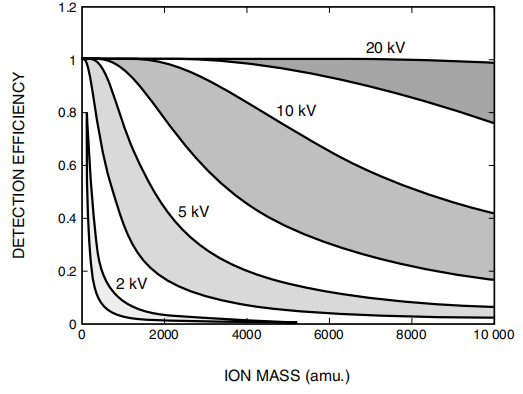
Figure 15 shows the detection efficiency of Cr cluster ions (upper curve) and hydrocarbons (lower curve) measured by varying the accumulated energy, with ion mass numbers up to 10000 amu. This indicates that as the ion acceleration energy increases, the detection efficiency tends to improve. For example, for ions with a mass number of 10000 amu, the detection efficiency is about 80% at an acceleration voltage of 20 kV, but drops below 5% at 5 kV. Compared to metal cluster ions, the detection efficiency for hydrogen-containing ions is often lower even with the same mass number.
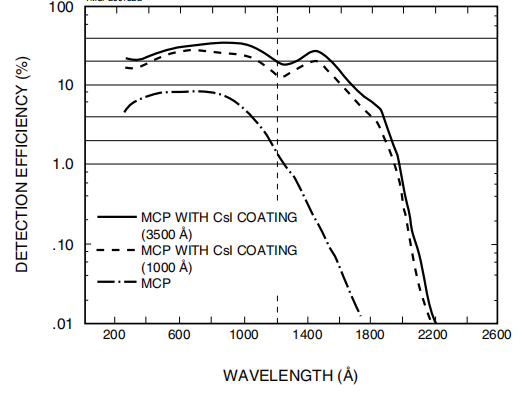
Figure 15 Variation of Detection Efficiency of Cr Cluster Ions (Upper Curve) and Hydrocarbons (Lower Curve) with Acceleration Voltage from 2 kV to 20 kV
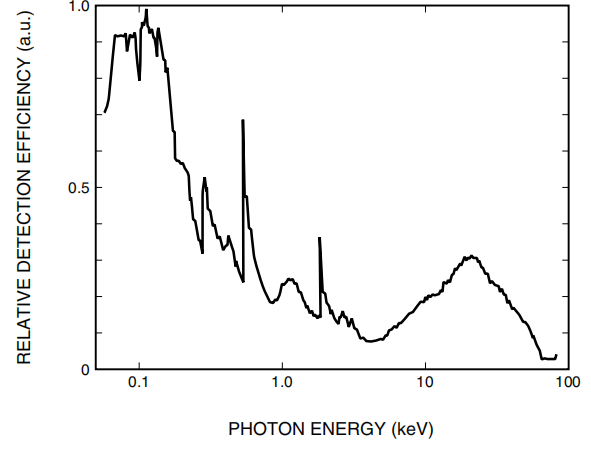
Figures 16 and 17 show the relative detection efficiency in the ultraviolet to hard x-ray region and the detection efficiency with respect to soft x-ray photon energy, respectively. Like electrons, the detection efficiency of these photons is angle-dependent. Moreover, as the energy increases, the angle at which maximum detection occurs becomes shallower. This phenomenon is related to the relationship between the position of secondary electron generation and their escape depth. The detection efficiency for ultraviolet is relatively low compared to electrons and ions. Coating the MCP input surface with photoelectric materials can effectively improve detection efficiency. Typical photoelectric materials include cesium iodide, copper iodide, potassium bromide, and Au, among which cesium iodide is the most commonly used.
Figure 16 Detection Efficiency & Photon Energy in the Ultraviolet to Hard X-ray Region
Figure 17 Detection Efficiency & Soft X-ray Photon Energy
The effect of cesium iodide coating on detection efficiency is shown in Figure 18. Alkali halides like cesium iodide are active materials that can react with moisture in the air and may dissolve in a short time. To prevent this from happening, the materials should be stored in a vacuum. When taking them out of the vacuum, ensure that the environmental humidity is low enough and install them in the shortest time possible.

Figure 18 Detection Efficiency & Ultraviolet Wavelength
The explanation of MCP parameter performance has concluded. If you have any questions, feel free to ask in the comments section, and the engineers will respond as soon as possible.