
Author: Wang Student Source: Submission
Editor: Senior Sister
1. Basic Concepts
1.1 KNN
k-nearest neighbor (k-NN) is a basic classification and regression method.
The input of k-nearest neighbor is the feature vector of the instance corresponding to the point in feature space; the output is the class of the instance, which can be multi-class.
The k-nearest neighbor method assumes that a training dataset is given, with the instance classes already determined. When classifying a new instance, it predicts based on the classes of the k nearest training instances to the new instance, using majority voting or similar methods. Therefore, the k-nearest neighbor method does not have an explicit learning process.
The k-nearest neighbor method was proposed by Cover and Hart in 1968.
1.2 K-means
K-means is a clustering method, which is a data analysis problem that merges given samples into several “classes” or “clusters” based on their feature similarity or distance.
The purpose of clustering is to discover characteristics of the data or to process the data through the obtained classes or clusters.
Clustering is a type of unsupervised learning because it classifies based solely on the similarity or distance of the samples, without prior knowledge of the classes or clusters.
1.3 Comparison of KNN and K-means
KNN
-
Classification algorithm -
Supervised learning -
Dataset contains labeled data -
No explicit training process, based on memory-based learning -
K value meaning – For a sample X, to classify it, first find the K closest data points in the dataset around X, and classify it into the class that has the most instances.
K-means
-
Clustering algorithm -
Unsupervised learning -
Dataset is unlabeled, chaotic data -
Has a clear training process -
K value meaning – K is a predetermined number that divides the dataset into K clusters, relying on prior knowledge.
2. KNN Principle and Implementation Process
2.1 KNN Principle:
The most straightforward approach of the KNN algorithm is to calculate the distances between the prediction point and all other points, then save and sort them, selecting the top K values to see which classes are most frequent, thus determining the class of the predicted point.
2.2 KNN Process:
For each point in the dataset with unknown class attributes, perform the following operations:
-
(1) Calculate the distance between points in the known class dataset and the current point; -
(2) Sort in increasing order of distance; -
(3) Select the K points that are closest to the current point; -
(4) Determine the frequency of classes among the top K points; -
(5) Return the class with the highest frequency among the top K points as the predicted class of the current point.
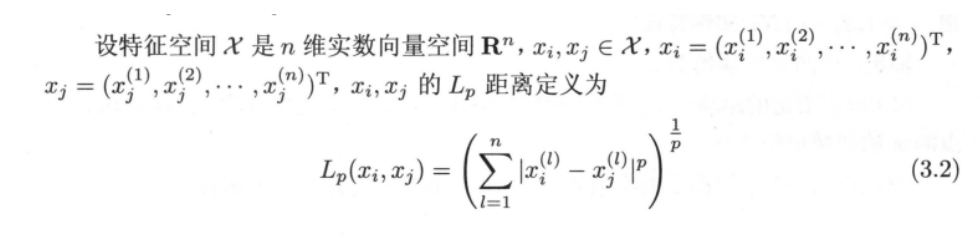
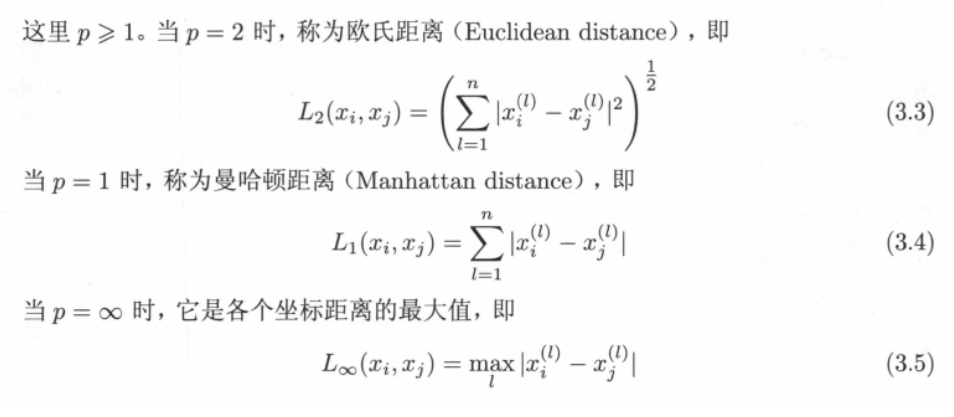
2.2.1 Distance Metrics (1)
2.2.2 K Value Selection (3)
2.2.2.1 When K is Too Small:
-
If a small k value is chosen, it is equivalent to using training instances in a small neighborhood for prediction, which will reduce the approximation error, as only training instances that are close to the input instance will influence the prediction. -
However, the disadvantage is that the estimation error will increase, making the prediction very sensitive to nearby instance points. If the nearby instance points happen to be noise, the prediction will be incorrect. -
In other words, reducing k means making the overall model more complex, leading to potential overfitting.
2.2.2.2 When K is Too Large:
-
If a large k value is chosen, it is equivalent to using training instances in a large neighborhood for prediction. -
The advantage is that it can reduce the estimation error, but the disadvantage is that the approximation error will increase. In this case, training instances that are far from the input instance will also influence the prediction, leading to errors. -
In other words, increasing k means making the overall model simpler.
If k=N, then regardless of what the input instance is, it will simply predict it belongs to the most frequent class in the training instances. This makes the model too simple, completely ignoring a lot of useful information in the training instances, which is undesirable.
2.2.2.3 How to Determine a Good Value for K?
The answer is through cross-validation (splitting the sample data into training and validation data in a certain ratio, for example, splitting into 60:40 for training and validation), starting with a small K value, gradually increasing K, then calculating the variance of the validation set to find a more suitable K value.
2.2.3 Determine the Frequency of Classes Among the Top K Points (4)
For example, when K is 4, it includes 3 red points and 1 blue point.
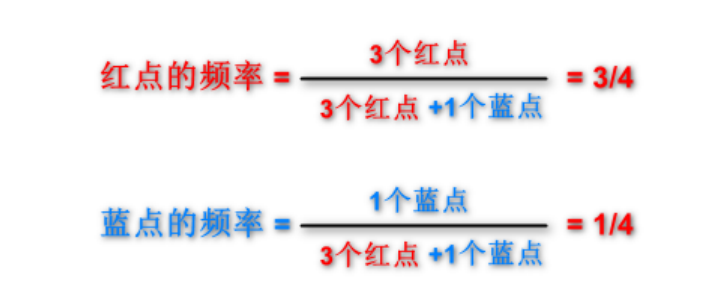
2.2.4 Return the Class with the Highest Frequency as the Predicted Classification of the Current Point (5)
Since >, the predicted point belongs to the red class, completing KNN.
3. K-means Principle and Implementation Process
3.1 K-means Principle:
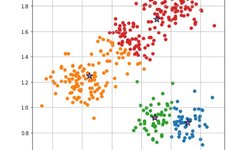
The characteristic of the K-Means algorithm is that the number of classes is artificially predetermined. If the machine is allowed to find the number of classes itself, through repeated processes of selecting centroids and calculating distances for classification – then selecting new centroids, until all data in the grouped results no longer change, the final clustering result is obtained.
3.2 K-means Process:
-
(1) Randomly select k centroids (k value depends on how many classes you want to cluster into) -
(2) Calculate the distance from samples to centroids, classifying those closest to the centroid into one class, forming k classes -
(3) Calculate the new centroid for each class after classification -
(4) Again calculate the distance from samples to the new centroids, classifying those closest to the new centroids into one class -
(5) Determine if the new and old clusters are the same; if they are the same, it means clustering is successful; if not, repeat steps 2-4 until they are the same.
3.2.1 Randomly Select k Centroids (k value depends on how many classes you want to cluster into)
Assuming I want to cluster into 4 classes, we randomly select four pentagons as centroids (big brothers).
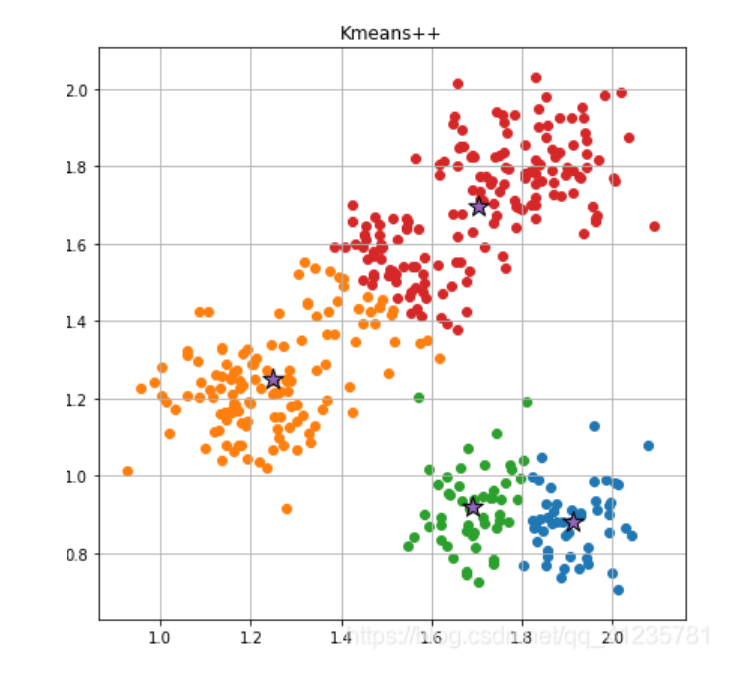
3.2.2 Calculate the Distance from Samples to Centroids, Classifying Those Closest to the Centroid into One Class, Forming k Classes
Calculate the Euclidean distance of samples excluding the centroids; the sample closest to which centroid will be classified with that centroid.
In other words, the small dot is the little brother, and the pentagon is the big brother; the little brother will follow whichever big brother he is closest to.
3.2.3 Calculate the New Centroid for Each Class After Classification
We have already classified into 4 classes; now we need to select new centroids (new big brothers) from these 4 classes.
3.2.4 Again Calculate the Distance from Samples to New Centroids, Classifying Those Closest to the New Centroids into One Class
Again calculate the Euclidean distance from samples to the new centroids (newly created big brothers); the boxed area is the new big brother.
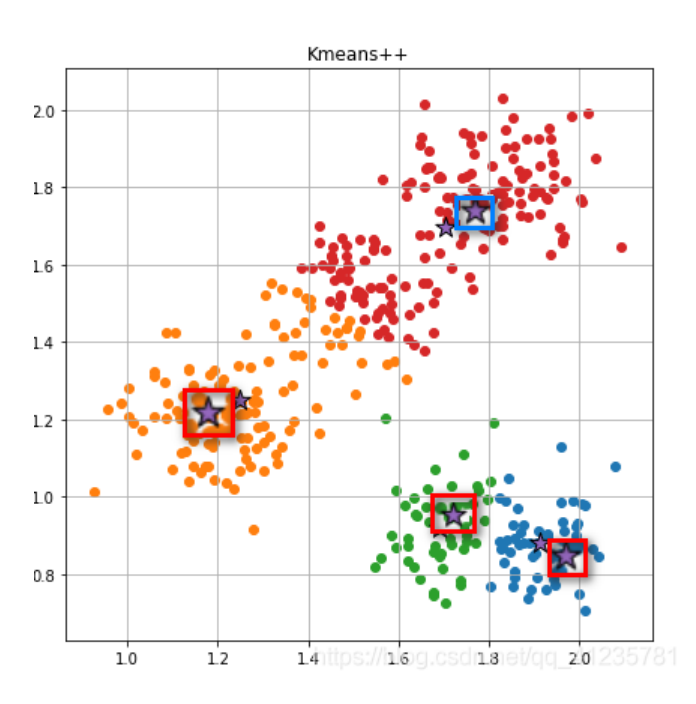
3.2.5 Determine if the New and Old Clusters are the Same
When it is found that the clustering situation has not changed, it indicates that our calculations have converged, and there is no need to continue grouping; the data has been successfully divided into 4 groups based on similarity. That is red, orange, green, and blue, completing the clustering.
4. Summary:
4.1 KNN
-
1. The k-nearest neighbor method is a basic and simple classification and regression method. The basic approach of k-nearest neighbor is: Given the training instance points and the input instance points, first determine the k nearest training instance points to the input instance point, and then use the majority of these k training instance points to predict the class of the input instance point.
-
2. The k-nearest neighbor model corresponds to a partitioning of the feature space based on the training dataset. In k-nearest neighbor, once the training set, distance metric, k value, and classification decision rule are determined, the result is uniquely determined.
-
3. The three elements of k-nearest neighbor are: distance metric, choice of k value, and classification decision rule. Commonly used distance metrics are Euclidean distance and more general L distances. When k is small, the k-nearest neighbor model is more complex; when k is large, the k-nearest neighbor model is simpler. The choice of k reflects the trade-off between approximation error and estimation error, usually determined by cross-validation to select the optimal k. The common classification decision rule is majority voting, corresponding to empirical risk minimization.
-
4. Implementing the k-nearest neighbor method requires considering how to quickly search for the k nearest neighbors. The kd-tree is a data structure that facilitates quick retrieval of data in k-dimensional space. The kd-tree is a binary tree that represents a partitioning of k-dimensional space, with each node corresponding to a hyper-rectangular area in the partitioning. Using the kd-tree can eliminate the need to search through a large number of data points, thereby reducing computational complexity.
4.2 K-means
-
1. Clustering is a data analysis problem that merges given samples into several “classes” or “clusters” based on their attribute similarity or distance. A class is a subset of samples. Intuitively, similar samples cluster together in the same class, while dissimilar samples are dispersed across different classes.
-
2. Distance or similarity metrics play an important role in clustering.
-
Commonly used distance metrics include Minkowski distance, such as Euclidean distance, Manhattan distance, Chebyshev distance, and Mahalanobis distance. Common similarity metrics include correlation coefficients and cosine angles.
-
When using distance metrics for similarity, smaller distances indicate more similarity; when using correlation coefficients, larger coefficients indicate more similarity.
-
3. K-means clustering is a commonly used clustering algorithm with the following characteristics: it is a partition-based clustering method; the number of classes k is specified in advance; it represents the distance or similarity between samples using the square of Euclidean distance; it represents classes with the mean of samples; the optimization objective function is the total distance between samples and their class center; the resulting classes are flat and non-hierarchical; the algorithm is iterative and does not guarantee global optimality.
-
4. The k-means clustering algorithm first selects k class centers and assigns samples to the closest class, obtaining a clustering result; then calculates the mean of samples in each class as the new center; repeats the above steps until convergence.
5. Code Practice:
5.1 KNN Practice:
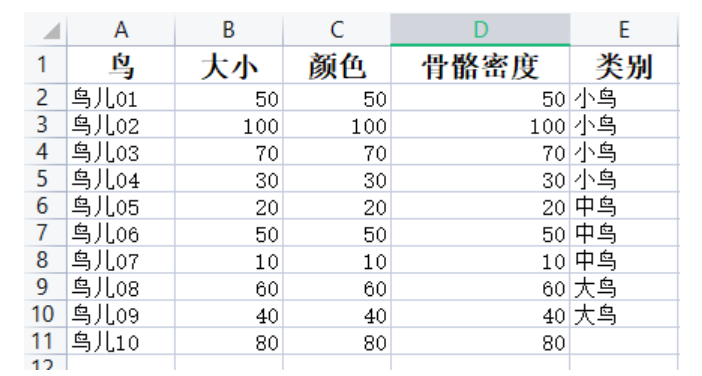
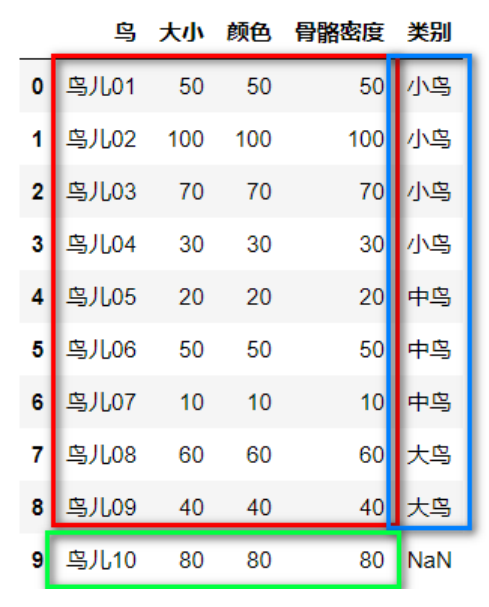
(1) First, create a dataset:
(2) Import libraries
import pandas as pd
from sklearn.neighbors import KNeighborsClassifier
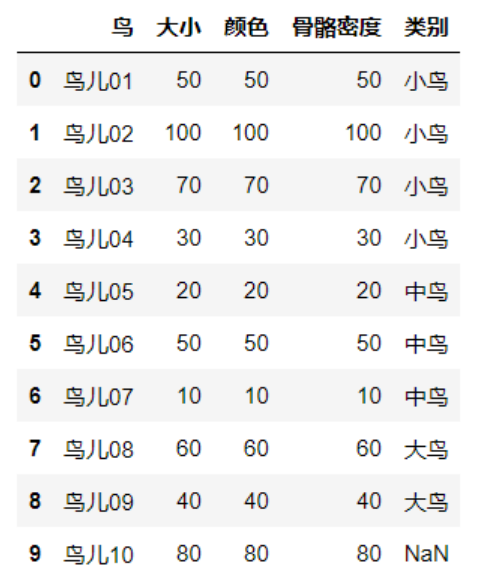
(3) Read data
data=pd.read_excel("knndata.xlsx")
data  # Print to check
(4) Split dataset
train_feature=data.iloc[0:9,1:4]# Red part
train_label=data.iloc[0:9,4:5]# Blue part
test_feature=data.iloc[9:10,1:4]# Green part
(5) Model prediction
knn=KNeighborsClassifier(n_neighbors=4)# n_neighbors=4 specifies K value as 4
knn.fit(train_feature,train_label)# Model training
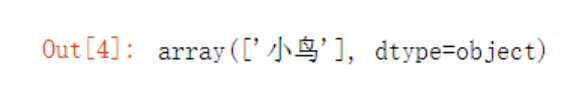
knn.predict(test_feature)# Model prediction
Output:
5.2 K-means Code Practice:
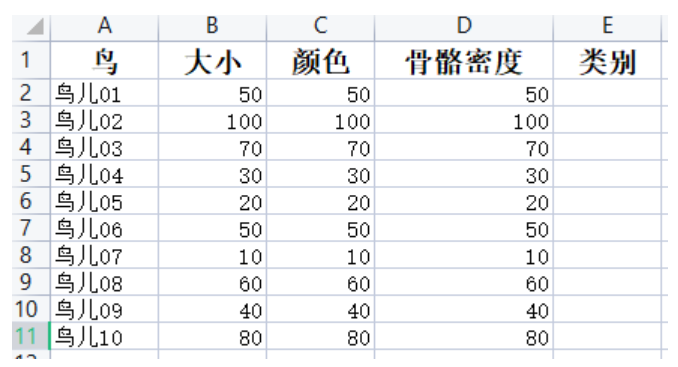
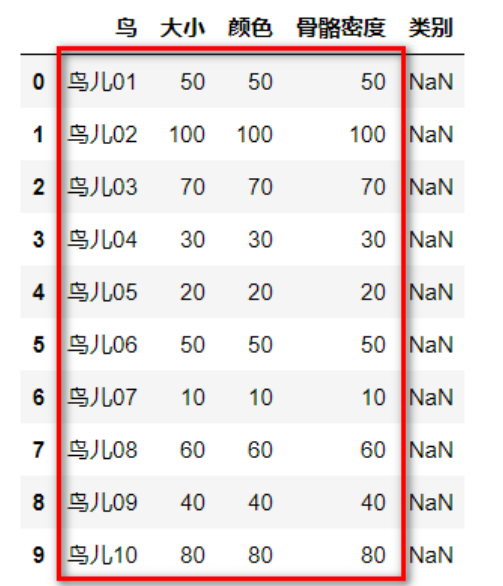
(1) Create a dataset
(2) Import libraries
import pandas as pd
from sklearn.cluster import KMeans
(3) Read data
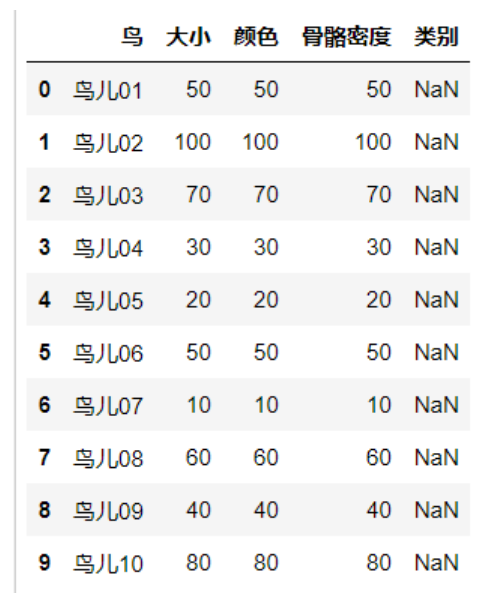
data=pd.read_excel("kmeans.xlsx")
data# Print to check
(4) Split dataset
train_feature=data.iloc[0:10,1:4]# Red part
(5) Model prediction
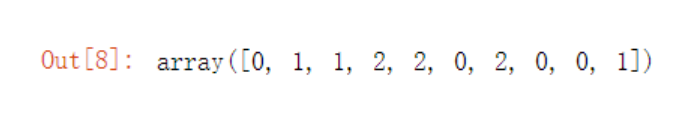
kmeans = KMeans(n_clusters=3)# n_clusters=3 specifies clustering into 3 types
kmeans.fit(train_feature)# Model training
label_kmeans = kmeans.predict(train_feature)# Model prediction
label_kmeans
Output:
To join the technical exchange group, please add the AINLP assistant WeChat (id: ainlper)

Please note the specific direction + related technologies used

About AINLP
AINLP is an interesting AI natural language processing community, focusing on sharing technologies related to AI, NLP, machine learning, deep learning, recommendation algorithms, etc. Themes include text summarization, intelligent Q&A, chatbots, machine translation, automatic generation, knowledge graphs, pre-trained models, recommendation systems, computational advertising, recruitment information, job experience sharing, etc. Welcome to follow! To join the technical exchange group, please add AINLPer (id: ainlper), noting your work/research direction + purpose of joining the group.

Having read this far, please share, like, or give a thumbs up, your choice! 🙏